
22.3: Patterns in Biodiversity
- Page ID
- 84224
\( \newcommand{\vecs}[1]{\overset { \scriptstyle \rightharpoonup} {\mathbf{#1}} } \)
\( \newcommand{\vecd}[1]{\overset{-\!-\!\rightharpoonup}{\vphantom{a}\smash {#1}}} \)
\( \newcommand{\dsum}{\displaystyle\sum\limits} \)
\( \newcommand{\dint}{\displaystyle\int\limits} \)
\( \newcommand{\dlim}{\displaystyle\lim\limits} \)
\( \newcommand{\id}{\mathrm{id}}\) \( \newcommand{\Span}{\mathrm{span}}\)
( \newcommand{\kernel}{\mathrm{null}\,}\) \( \newcommand{\range}{\mathrm{range}\,}\)
\( \newcommand{\RealPart}{\mathrm{Re}}\) \( \newcommand{\ImaginaryPart}{\mathrm{Im}}\)
\( \newcommand{\Argument}{\mathrm{Arg}}\) \( \newcommand{\norm}[1]{\| #1 \|}\)
\( \newcommand{\inner}[2]{\langle #1, #2 \rangle}\)
\( \newcommand{\Span}{\mathrm{span}}\)
\( \newcommand{\id}{\mathrm{id}}\)
\( \newcommand{\Span}{\mathrm{span}}\)
\( \newcommand{\kernel}{\mathrm{null}\,}\)
\( \newcommand{\range}{\mathrm{range}\,}\)
\( \newcommand{\RealPart}{\mathrm{Re}}\)
\( \newcommand{\ImaginaryPart}{\mathrm{Im}}\)
\( \newcommand{\Argument}{\mathrm{Arg}}\)
\( \newcommand{\norm}[1]{\| #1 \|}\)
\( \newcommand{\inner}[2]{\langle #1, #2 \rangle}\)
\( \newcommand{\Span}{\mathrm{span}}\) \( \newcommand{\AA}{\unicode[.8,0]{x212B}}\)
\( \newcommand{\vectorA}[1]{\vec{#1}} % arrow\)
\( \newcommand{\vectorAt}[1]{\vec{\text{#1}}} % arrow\)
\( \newcommand{\vectorB}[1]{\overset { \scriptstyle \rightharpoonup} {\mathbf{#1}} } \)
\( \newcommand{\vectorC}[1]{\textbf{#1}} \)
\( \newcommand{\vectorD}[1]{\overrightarrow{#1}} \)
\( \newcommand{\vectorDt}[1]{\overrightarrow{\text{#1}}} \)
\( \newcommand{\vectE}[1]{\overset{-\!-\!\rightharpoonup}{\vphantom{a}\smash{\mathbf {#1}}}} \)
\( \newcommand{\vecs}[1]{\overset { \scriptstyle \rightharpoonup} {\mathbf{#1}} } \)
\(\newcommand{\longvect}{\overrightarrow}\)
\( \newcommand{\vecd}[1]{\overset{-\!-\!\rightharpoonup}{\vphantom{a}\smash {#1}}} \)
\(\newcommand{\avec}{\mathbf a}\) \(\newcommand{\bvec}{\mathbf b}\) \(\newcommand{\cvec}{\mathbf c}\) \(\newcommand{\dvec}{\mathbf d}\) \(\newcommand{\dtil}{\widetilde{\mathbf d}}\) \(\newcommand{\evec}{\mathbf e}\) \(\newcommand{\fvec}{\mathbf f}\) \(\newcommand{\nvec}{\mathbf n}\) \(\newcommand{\pvec}{\mathbf p}\) \(\newcommand{\qvec}{\mathbf q}\) \(\newcommand{\svec}{\mathbf s}\) \(\newcommand{\tvec}{\mathbf t}\) \(\newcommand{\uvec}{\mathbf u}\) \(\newcommand{\vvec}{\mathbf v}\) \(\newcommand{\wvec}{\mathbf w}\) \(\newcommand{\xvec}{\mathbf x}\) \(\newcommand{\yvec}{\mathbf y}\) \(\newcommand{\zvec}{\mathbf z}\) \(\newcommand{\rvec}{\mathbf r}\) \(\newcommand{\mvec}{\mathbf m}\) \(\newcommand{\zerovec}{\mathbf 0}\) \(\newcommand{\onevec}{\mathbf 1}\) \(\newcommand{\real}{\mathbb R}\) \(\newcommand{\twovec}[2]{\left[\begin{array}{r}#1 \\ #2 \end{array}\right]}\) \(\newcommand{\ctwovec}[2]{\left[\begin{array}{c}#1 \\ #2 \end{array}\right]}\) \(\newcommand{\threevec}[3]{\left[\begin{array}{r}#1 \\ #2 \\ #3 \end{array}\right]}\) \(\newcommand{\cthreevec}[3]{\left[\begin{array}{c}#1 \\ #2 \\ #3 \end{array}\right]}\) \(\newcommand{\fourvec}[4]{\left[\begin{array}{r}#1 \\ #2 \\ #3 \\ #4 \end{array}\right]}\) \(\newcommand{\cfourvec}[4]{\left[\begin{array}{c}#1 \\ #2 \\ #3 \\ #4 \end{array}\right]}\) \(\newcommand{\fivevec}[5]{\left[\begin{array}{r}#1 \\ #2 \\ #3 \\ #4 \\ #5 \\ \end{array}\right]}\) \(\newcommand{\cfivevec}[5]{\left[\begin{array}{c}#1 \\ #2 \\ #3 \\ #4 \\ #5 \\ \end{array}\right]}\) \(\newcommand{\mattwo}[4]{\left[\begin{array}{rr}#1 \amp #2 \\ #3 \amp #4 \\ \end{array}\right]}\) \(\newcommand{\laspan}[1]{\text{Span}\{#1\}}\) \(\newcommand{\bcal}{\cal B}\) \(\newcommand{\ccal}{\cal C}\) \(\newcommand{\scal}{\cal S}\) \(\newcommand{\wcal}{\cal W}\) \(\newcommand{\ecal}{\cal E}\) \(\newcommand{\coords}[2]{\left\{#1\right\}_{#2}}\) \(\newcommand{\gray}[1]{\color{gray}{#1}}\) \(\newcommand{\lgray}[1]{\color{lightgray}{#1}}\) \(\newcommand{\rank}{\operatorname{rank}}\) \(\newcommand{\row}{\text{Row}}\) \(\newcommand{\col}{\text{Col}}\) \(\renewcommand{\row}{\text{Row}}\) \(\newcommand{\nul}{\text{Nul}}\) \(\newcommand{\var}{\text{Var}}\) \(\newcommand{\corr}{\text{corr}}\) \(\newcommand{\len}[1]{\left|#1\right|}\) \(\newcommand{\bbar}{\overline{\bvec}}\) \(\newcommand{\bhat}{\widehat{\bvec}}\) \(\newcommand{\bperp}{\bvec^\perp}\) \(\newcommand{\xhat}{\widehat{\xvec}}\) \(\newcommand{\vhat}{\widehat{\vvec}}\) \(\newcommand{\uhat}{\widehat{\uvec}}\) \(\newcommand{\what}{\widehat{\wvec}}\) \(\newcommand{\Sighat}{\widehat{\Sigma}}\) \(\newcommand{\lt}{<}\) \(\newcommand{\gt}{>}\) \(\newcommand{\amp}{&}\) \(\definecolor{fillinmathshade}{gray}{0.9}\)Biodiversity is not evenly distributed on the planet. For example, Lake Victoria in Africa (Figure \(\PageIndex{1}\)) contained almost 500 species from a family of fishes called cichlids before the introduction of the invasive Nile Perch in the 1980s and 1990s caused a mass extinction. Note that this number does not include species of other fish families. Lake Huron, the second largest of North America's Great Lakes, contains about 79 species of fish, all of which are found in many other lakes in North America.
What accounts for the difference in diversity between Lake Victoria and Lake Huron? Lake Victoria is a tropical lake, while Lake Huron is a temperate lake. Lake Huron in its present form is only about 7,000 years old, while Lake Victoria in its present form is about 15,000 years old. These two factors, latitude and age, are two of several hypotheses that biogeographers have suggested explain biodiversity patterns on Earth.
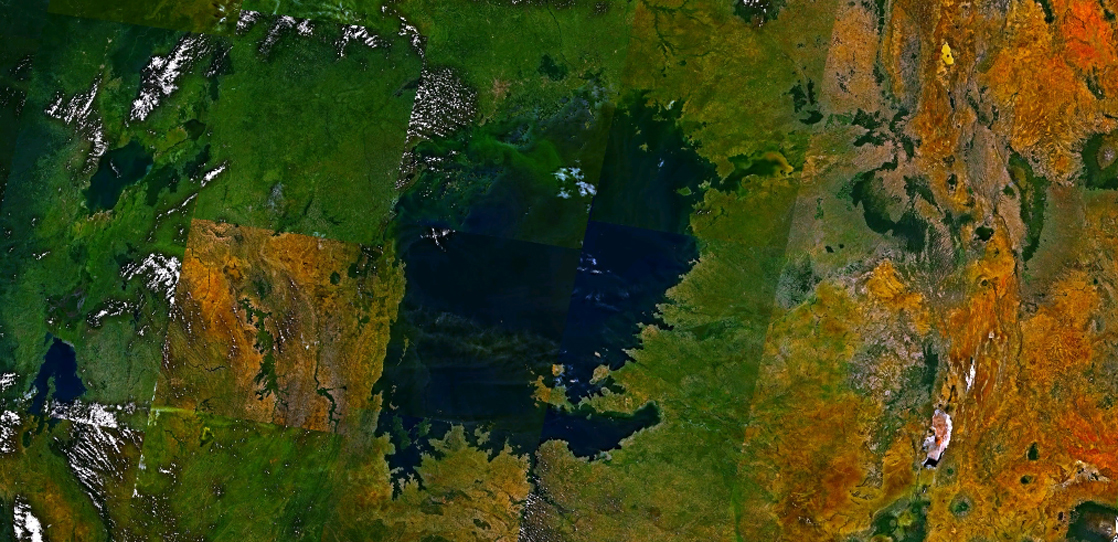
Figure \(\PageIndex{1}\): Lake Victoria in Africa, shown in this satellite image, was the site of one of the most extraordinary evolutionary findings on the planet, as well as a casualty of devastating biodiversity loss (credit: modification of work by Rishabh Tatiraju, using NASA World Wind software).
Biogeography is the study of the distribution of the world’s species both in the past and in the present. The work of biogeographers is critical to understanding our physical environment, how the environment affects species, and how changes in environment impact the distribution of a species. There are three main subfields of biogeography: ecological biogeography, historical biogeography (called paleobiogeography), and conservation biogeography. Ecological biogeography studies the current factors affecting the distribution of plants and animals. Historical biogeography, as the name implies, studies the past distribution of species. Conservation biogeography, on the other hand, is focused on the protection and restoration of species based upon the known historical and current ecological information.
Understanding the global distribution of biodiversity is one of the most significant objectives for ecologists and biogeographers. Beyond purely scientific goals and satisfying curiosity, this understanding is essential for applied issues of major concern to humankind, such as the spread of invasive species, the control of diseases and their vectors, and the likely effects of global climate change on the maintenance of biodiversity (Gaston, 2000).
22.3.1 Latitudinal Gradients in Biodiversity
Source: https://en.wikipedia.org/wiki/Latitu...cies_diversity
Species richness, or biodiversity, increases from the poles to the tropics for a wide variety of terrestrial and marine organisms Figure \(\PageIndex{2}\). This effect is often referred to as the latitudinal diversity gradient (LDG). The LDG is one of the most widely recognized patterns in ecology. A parallel trend has been found with elevation (elevational diversity gradient), though this is less well-studied. Tropical areas play prominent roles in the understanding of the distribution of biodiversity, as their rates of habitat degradation and biodiversity loss are exceptionally high.
Explaining the latitudinal diversity gradient has been called one of the great contemporary challenges of biogeography and macroecology (e.g. Willig et al., 2003; Pimm & Brown, 2004). There is a lack of consensus among ecologists about the mechanisms underlying the pattern, and many hypotheses have been proposed and debated.
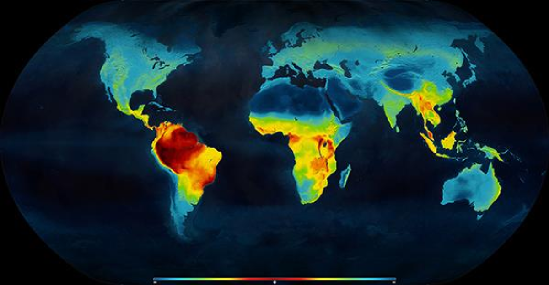
Figure \(\PageIndex{2}\): Map latitudinal gradient of living terrestrial vertebrate species richness (Mannion, 2014).
22.3.2 Hypotheses for Latitudinal Gradients 
Although many of the hypotheses exploring the latitudinal diversity gradient are closely related and interdependent, the major hypotheses can be split into three general hypotheses. As you will see below, all of these hypotheses have experienced considerable criticisms and debate among members of the scientific community.
Spatial/Area Hypothesis
Mid-domain effect
Using computer simulations, Cowell and Hurt (1994) and Willig and Lyons (1998) first pointed out that if species’ latitudinal ranges were randomly shuffled within the geometric constraints of a bounded biogeographical domain (e.g. the continents of the New World, for terrestrial species), species' ranges would tend to overlap more toward the center of the domain than towards its limits, forcing a mid-domain peak in species richness. Colwell and Lees (2000) called this stochastic phenomenon the mid-domain effect (MDE) and suggested the hypothesis that MDE might contribute to the latitudinal gradient in species richness, together with other explanatory factors considered here, including climatic and historical ones. Mid-domain effects have proven controversial. While some studies have found evidence of a potential role for MDE in latitudinal gradients of species richness, particularly for wide-ranging species, others report little correspondence between predicted and observed latitudinal diversity patterns.
Species-energy hypothesis
The species energy hypothesis suggests that the amount of available energy sets limits to the richness of the system. Thus, increased solar energy (with an abundance of water) at low latitudes causes increased net primary productivity (or photosynthesis). This hypothesis proposes the higher the net primary productivity the more individuals can be supported, and the more species there will be in an area. Put another way, this hypothesis suggests that extinction rates are reduced towards the equator as a result of the higher populations sustainable by the greater amount of available energy in the tropics. Lower extinction rates lead to more species in the tropics.
One critique of this hypothesis has been that increased species richness over broad spatial scales is not necessarily linked to an increased number of individuals, which in turn is not necessarily related to increased productivity (Cardillo et al., 2005). The effect of energy has, however, been supported by several studies in terrestrial and marine taxa (Tittensor et al., 2010). The potential mechanisms underlying the species-energy hypothesis, their unique predictions and empirical support have been assessed in a major review by Currie et al. (2004).
Climate-related hypotheses
Another climate-related hypothesis is the climate harshness hypothesis, which states the latitudinal diversity gradient may exist simply because fewer species can physiologically tolerate conditions at higher latitudes than at low latitudes because higher latitudes are often colder and drier than tropical latitudes. Currie et al. (2004) found fault with this hypothesis by stating that, although it is clear that climatic tolerance can limit species distributions, it appears that species are often absent from areas whose climate they can tolerate.
Similarly to the climate harshness hypothesis, climate stability is suggested to be the reason for the latitudinal diversity gradient. The mechanism for this hypothesis is that while a fluctuating environment may increase the extinction rate or preclude specialization, a constant environment can allow species to specialize on predictable resources, allowing them to have narrower niches and facilitating speciation. The fact that temperate regions are more variable both seasonally and over geological timescales (discussed in more detail below) suggests that temperate regions are thus expected to have less species diversity than the tropics. Critiques for this hypothesis include the fact that there are many exceptions to the assumption that climate stability means higher species diversity. Additionally, many habitats with high species diversity do experience seasonal climates, including many tropical regions that have highly seasonal rainfall (Brown & Lomolino, 1998).
Historical/Evolutionary hypotheses
The historical perturbation hypothesis
The historical perturbation hypothesis proposes the low species richness of higher latitudes is a consequence of an insufficient time period available for species to colonize or recolonize areas because of historical perturbations such as glaciation (Brown & Lomolino, 1998; Gaston & Blackburn, 2000). This hypothesis suggests that diversity in the temperate regions has not yet reached equilibrium and that the number of species in temperate areas will continue to increase until saturated (Clarke & Crame, 2003).
The evolutionary rate hypothesis
The evolutionary rate hypothesis argues that higher evolutionary rates in the tropics have caused higher speciation rates and thus increased diversity at low latitudes (Cardillo et al., 2005; Weir & Schluter, 2007; Rolland et al., 2014). Higher evolutionary rates in the tropics have been attributed to higher ambient temperatures, higher mutation rates, shorter generation time and/or faster physiological processes (Rohde, 1992; Allen et al., 2006), and increased selection pressure from other species that are themselves evolving (Schemske et al., 2009). Faster rates of microevolution in warm climates (i.e. low latitudes and altitudes) have been shown for plants (Wright et al. 2006), mammals (Gillman et al., 2009), and amphibians (Wright et al., 2010). Based on the expectation that faster rates of microevolution result in faster rates of speciation, these results suggest that faster evolutionary rates in warm climates almost certainly have a strong influence on the latitudinal diversity gradient. More research needs to be done to determine whether or not speciation rates actually are higher in the tropics. Understanding whether extinction rate varies with latitude will also be important to whether or not this hypothesis is supported (Rolland et al., 2014).
The hypothesis of effective evolutionary time
The hypothesis of effective evolutionary time assumes that diversity is determined by the evolutionary time under which ecosystems have existed under relatively unchanged conditions, and by evolutionary speed directly determined by effects of environmental energy (temperature) on mutation rates, generation times, and speed of selection (Rohde, 1992). It differs from most other hypotheses in not postulating an upper limit to species richness set by various abiotic and biotic factors, i.e., it is a nonequilibrium hypothesis assuming a largely non-saturated niche space. It does accept that many other factors may play a role in causing latitudinal gradients in species richness as well. The hypothesis is supported by much recent evidence, in particular, the studies of Allen et al. (2006) and Wright et al. (2006).
Biotic hypotheses
Biotic hypotheses claim ecological species interactions such as competition, predation, mutualism, and parasitism are stronger in the tropics and these interactions promote species coexistence and specialization of species, leading to greater speciation in the tropics. These hypotheses are problematic because they cannot be the ultimate cause of the latitudinal diversity gradient as they fail to explain why species interactions might be stronger in the tropics. An example of one such hypothesis is the greater intensity of predation and more specialized predators in the tropics has contributed to the increase of diversity in the tropics (Pianka, 1966). This intense predation could reduce the importance of competition (see competitive exclusion) and permit greater niche overlap and promote higher richness of prey. Some recent large-scale experiments suggest predation may indeed be more intense in the tropics,[12][13] although this cannot be the ultimate cause of high tropical diversity because it fails to explain what gives rise to the richness of the predators in the tropics. Interestingly, the largest test of whether biotic interactions are strongest in the tropics, which focused on predation exerted by large fish predators in the world's open oceans, found predation to peak at mid-latitudes. Moreover, this test further revealed a negative association of predation intensity and species richness, thus contrasting the idea that strong predation near the equator drives or maintains high diversity.[14] Other studies have failed to observe consistent changes in ecological interactions with latitude altogether (Lambers et al., 2002),[1] suggesting that the intensity of species interactions is not correlated with the change in species richness with latitude. Overall, these results highlight the need for more studies on the importance of species interactions in driving global patterns of diversity.
With the enormous number of species that exist on Earth, it is remarkable that the distribution of these species is so highly concentrated in specific areas. Species richness, the total number of species found in an area, is not evenly distributed around the globe: two-thirds of all known species occur in tropical areas.
In order to prioritize the areas that should be protected, scientists look for areas that are home to a large number of species, especially those species that are under threat of extinction. or that are currently being destroyed at a fast pace. These areas that are particularly important for biodiversity conservation are called biodiversity hotspots. Two things are crucial when determining that a place is a biodiversity hotspot: (i) the number of different species there; and (ii) whether species in that area are endangered or currently being destroyed. Figure \(\PageIndex{3}\) shows the location of 36 biodiversity hotspots, according to the Critical Ecosystem Partnership Fund.
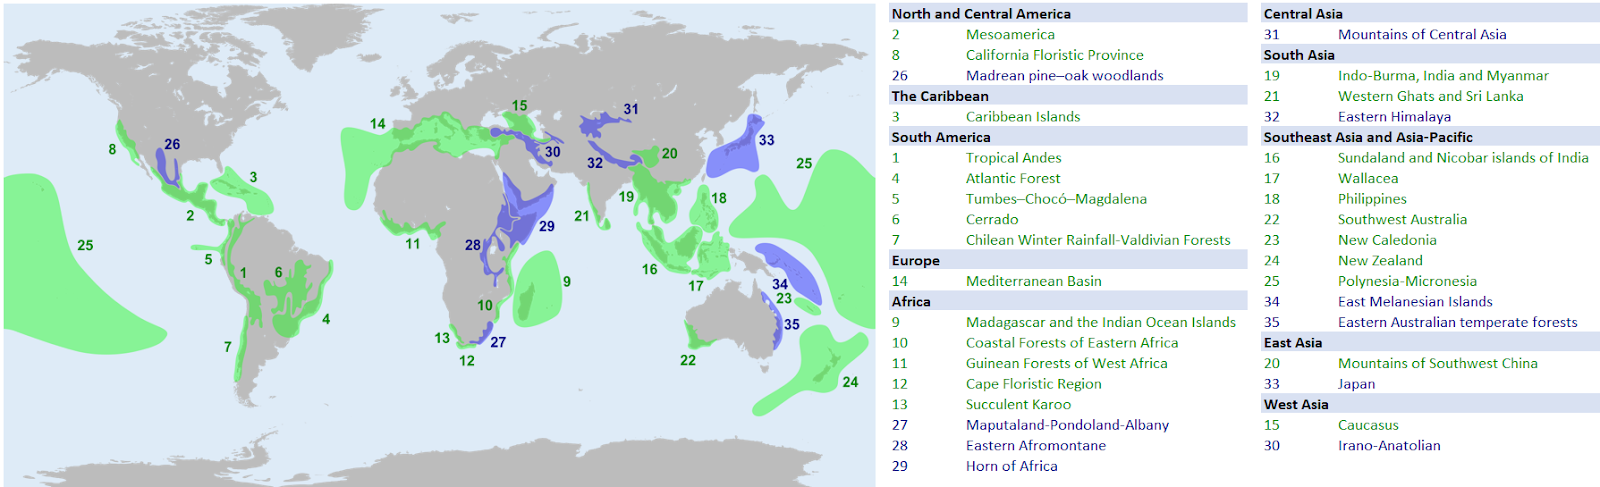
Figure \(\PageIndex{3}\): The names and locations of current biodiversity hotspots around the globe. The original 25 in green, and added regions in purple (Wikipedia, edited by Andy Wilson).
Scientists have observed that, even though biodiversity hotspots make up only approximately 1.4% of land on our planet, they are home to 60% of Earth’s plant, bird, mammal, and reptile species (Possingham and Wilson 2005). Just the endangered species in the tropics accounts for 43% of vertebrates (animals with backbones and their close relatives) and 80% of all amphibians (Marchese 2015). Species found only in a certain geographical area are known as endemic species, and biodiversity hotspots are full of them! For example, the Banana Tree Frog can only be found in Ethiopia, and you will only find lemurs in Madagascar (Herrera 2017). Tropical forests are typically biodiversity hotspots and are usually filled with endemic species. The Upper Amazonia/Guyana Shield, the Congo Basin, and the New Guinea/Melanesian Islands have the highest number of endemic terrestrial (land-living) species on Earth (Cincotta et al. 2000). Figure \(\PageIndex{4}\) shows some examples of biodiversity hotspots and some of their endemic animals and plants.
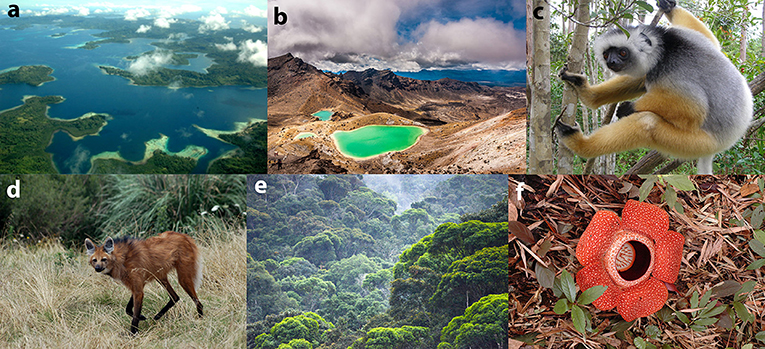
Figure \(\PageIndex{4}\): Biodiversity hotspots and some of their endemic species. (a) Melanesian Islands ["Solomon Islands" by Jim Lounsbury is available for open access]; (b) Emerald Lakes, New Zealand [Photo by Marcus Holland-Moritz is licensed under CC BY-SA 2.0]; (c) Diademed sifaca, one of the endemic lemur species from Mantadia National Park, Madagascar ["Diademed ready to push off" by Michael Hogan is available in the public domain]; (d) Maned wolf, the largest canid of South America, a species from the Cerrado hotspot [Photo by Aguará is licensed under CC SA 3.0]; (e) Atlantic Forest, Caparaó, Brazil ["Caparaó e a Mata Atlântica" by Heris Luiz Cordeiro Rocha is licensed under CC SA 3.0]; (f) Rafflesia, one of the largest flowers in nature. This particular one, from Borneo, is 80 cm wide ["Rafflesia keithii bloom" by Steve Cornish is licensed under CC BY 2.0]
In addition to land, the waters surrounding these tropical regions are just as important, and equally in danger (Marchese, 2015). Tropical coral reefs are currently being threatened by climate change. The change of weather and temperature patterns around the world cause intense habitat destruction, especially of these reefs. These areas are some of the most biodiverse ecosystems on our planet! Scientific studies of 3,235 marine species in these areas, including fishes, corals, snails, and lobsters, show that high percentages of these species are at serious risk of becoming extinct (Roberts et al., 2002). Conservation of species living in fresh or seawater is especially difficult, because many bodies of water are interconnected. For example, all the oceans are connected through sea currents that allow the movement of species, minerals, and pollution across the entire globe (Pimm et al., 2014).
Sources
Allen, A.P., Gillooly, J.F., Savage, V.M., & Brown, J.H. (2006). Kinetic effects of temperature on rates of genetic divergence and speciation. PNAS, 103(24), pp. 9130–9135. doi:10.1073/pnas.0603587103. PMC 1474011. PMID 16754845.
Brown, J.H., & Lomolino, M.V. (1998). Biogeography. Sinauer Associates, Sunderland.
Cardillo, M., Orme, C.D. L., & Owens, I.P.F. (2005). Testing for latitudinal bias in diversification rates: An example using New World birds. Ecology, 86(9), pp. 2278–2287. doi:10.1890/05-0112.
Cincotta, R.P., Wisnewski, J., & Engelman, R. (2000). Human population in the biodiversity hotspots. Nature, 404, pp. 990–2. doi: 10.1038/35010105
Clarke, A., & Crame, J.A. (2003). The importance of historical processes in global patterns of diversity. In Blackburn T.M., & Gaston, K.J. (Eds.), Macroecology concepts and consequences (pp. 130-151). Blackwell Scientific, Oxford.
Colwell, R.K., & Lees, D.C. (2000). The mid-domain effect: Geometric constraints on the geography of species richness. Trends in Ecology & Evolution, 15(2), pp. 70–76. doi:10.1016/s0169-5347(99)01767-x. PMID 10652559.
Currie, D.J., Mittelbach, G.G., Cornell, H.V., Kaufman, D.M., Kerr, J.T., & Oberdorff, T. (2004). Predictions and tests of climate-based hypotheses of broad-scale variation in taxonomic richness. Ecology Letters, 7(12), pp. 1121–1134. doi:10.1111/j.1461-0248.2004.00671.x.
Gaston, K.J. (2000). Global patterns in biodiversity. Nature, 405(6783), pp. 220–227. doi:10.1038/35012228. PMID 10821282. S2CID 4337597.
Gaston, K.J., & Blackburn, T.M. (2000). Pattern and processes in macroecology. Blackwell Scientific, Oxford.
Herrera, J.P. (2017). Testing the adaptive radiation hypothesis for the Lemurs of Madagascar. R. Soc. Open Sci., 4, 161014. doi: 10.1098/rsos.161014
Lambers, J.H.R., Clark, J.S., & Beckage, B. (2002). Density-dependent mortality and the latitudinal gradient in species diversity. Nature, 417(6890), pp. 732–735. doi:10.1038/nature00809.
Marchese, C. (2015). Biodiversity hotspots: A shortcut for a more complicated concept. Glob. Ecol. Conserv., 3, pp. 297–309. doi: 10.1016/j.gecco.2014.12.008
Pianka, E.R. (1966). Latitudinal gradients in species diversity: A review of concepts. The American Naturalist, 100(910), pp. 33–46. doi:10.1086/282398. S2CID 84244127.
Pimm, S.L., Jenkins, C.N., Abell, R., Brooks, T.M., Gittleman, J.L., Joppa, L.N., et al. (2014). The biodiversity of species and their rates of extinction, distribution, and protection. Science, 344, 1246752. doi: 10.1126/science.1246752.
Possingham, H.P., & Wilson, K.A. (2005). Biodiversity: Turning up the heat on hotspots. Nature, 436, pp.919–20. doi: 10.1038/436919a.
Roberts, C.M., McClean, C.J., Veron, J.E., Hawkins, J.P., Allen, G.R., McAllister, D.E., et al. (2002). Marine biodiversity hotspots and conservation priorities for tropical reefs. Science, 295, pp. 1280–4. doi: 10.1126/science.1067728.
Rohde, K. (1997). The larger area of the tropics does not explain latitudinal gradients in species diversity. Oikos, 79(1), pp. 169–172. doi:10.2307/3546102. JSTOR 3546102.
Rolland, J., Condamine, F.L., Jiguet, F., & Morlon, H. (2014). Faster speciation and reduced extinction in the tropics contribute to the mammalian latitudinal diversity gradient. PLOS Biology, 12(1), e1001775. doi:10.1371/journal.pbio.1001775. PMC 3904837. PMID 24492316.
Schemske, D.W., Mittelbach, G.G., Cornell, H.V., Sobel, J.M., & Kaustuv, R. (2009). Is there a latitudinal gradient in the importance of biotic interactions? Annual Review of Ecology, Evolution, and Systematics, 40(1), pp. 245–269. doi:10.1146/annurev.ecolsys.39.110707.173430.
Tittensor, D.P., Mora, C., Jetz, W., Lotze, H.K., Ricard, D., Berghe, E.V., & Worm, B. (2010). Global patterns and predictors of marine biodiversity across taxa. Nature, 466(7310), pp. 1098–1101. doi:10.1038/nature09329.
Weir, J.T., & Schluter, D. (2007). The latitudinal gradient in recent speciation and extinction rates of birds and mammals. Science, 315(5818), pp. 1574–1576. Bibcode:2007Sci...315.1574W. doi:10.1126/science.1135590. PMID 17363673. S2CID 46640620.
Willig, M.R., & Lyons, S.K. (1998). An analytical model of latitudinal gradients of species richness with an empirical test for marsupials and bats in the New World. Oikos, 81(1), pp. 93–98. doi:10.2307/3546471. JSTOR 3546471.
Willig, M.R., Kaufmann, D.M., & Stevens, R.D. (2003). Latitudinal gradients of biodiversity: Pattern, process, scale and synthesis. Annu. Rev. Ecol. Syst., 34, pp. 273–309. doi:10.1146/annurev.ecolsys.34.012103.144032.
Wright, S., Keeling, J., & Gillman, L. (2006). The road from Santa Rosalia: A faster tempo of evolution in tropical climates. Proceedings of the National Academy of Sciences, 103(20), pp. 7718–7722. doi:10.1073/pnas.0510383103.
Wright, S.D., Gillman, L.N., Ross, H.A., & Keeling, D.J. (2010). Energy and the tempo of evolution in amphibians: Energy and the tempo of evolution in amphibians. Global Ecology and Biogeography: no–no. doi:10.1111/j.1466-8238.2010.00549.x.
Contributors and Attributions
Written and curated by A. Wilson and N. Gownaris (Gettysburg College) from the following open-access sources:
- Chapter 9.4 in Environmental Science by Melissa Ha and Rachel Schleiger, licensed under CC BY - SA
- Latitudinal Gradients in Species Diversity by Wikipedia, the Free Encyclopedia
- What are Biodiversity Hotspots? on Frontiers for Young Minds By Melanie Merritt, Maria Eduarda Maldaner, and Ana Maria Rocha de Almeida and Reviewed by Songo Info