
22.4: How many species are there?
- Page ID
- 84223
To date, taxonomists have described about 2.2 million species that share this planet with us (http://www.catalogueoflife.org/annual-checklist/2019/info/about). While this total may seem impressive, available evidence suggests that this estimate vastly underestimates the true extent of Earth’s biodiversity. In fact, even now, after all the exploration in years gone by, several thousand new species are being described each year. Many new discoveries are made by skilled researchers recognizing new species by being able to discern variation in morphological characters; that includes the discoveries of a new small forest antelope from West Africa (Colyn et al., 2010) and a new species of shark off Mozambique (Ebert and Cailliet, 2011). New genetic technologies have highlighted that there are many thousands of species yet to be described. Both traditional and genetic techniques rely heavily on the availability of specimens in Natural History Museums collections to help identify and describe new species (Sforzi et al. 2018). A lack of taxonomists and natural history collections in many of the world's most biodiverse countries means there is a still a great deal of work to do (Paknia et al. 2015).
The most exciting and newsworthy discoveries of new species generally involve higher-level taxa, especially living fossils. For example, in 1938, biologists across the world were stunned by the report of a strange fish caught in the Indian Ocean off South Africa. This fish, subsequently named coelacanth Latimeria chalumnae, belongs to a group of marine fishes that were common in ancient seas but were thought to have gone extinct 65 million years ago. Coelacanths are of interest to evolutionary biologists because they show certain features of muscles and bones in their fins that are comparable to the limbs of the first vertebrates that crawled onto land. Following the initial discovery, coelacanths have been found along Africa’s Indian Ocean coast from South Africa to the Comoros and through to Kenya. Unfortunately, the entire coelacanth population, estimated at fewer than 500 individuals, is currently highly threatened because of ongoing fishing pressures (Musick, 2000).
Although field surveys have proven to be of great importance for discovering new species and populations, perhaps the greatest taxonomic progress has come from advances in genetic analyses which help to separate cryptic species previously lumped under more widespread species. For example, advances in genetic research recently highlighted that the African clawed frog Xenopus laevis—a popular model organism in biomedical research—consists of seven distinct species (Evans et al., 2015). Similarly, using new genetic methods, scientists recently confirmed that the slender-snouted crocodile Mecistops cataphractus consists of two different species, one endemic to West Africa and the other to Central Africa (Shirley et al., 2018).
Estimates suggest there are somewhere between 1–6 billion distinct species on Earth. The most diverse group of species is bacteria.
The presence of so many undiscovered species and communities makes precise estimates of species diversity incredibly difficult, especially in Africa where so many areas remain scientifically unexplored. Our most recent estimates, combining genetic analysis of well-known groups with mathematical patterns, suggests there are between 1–6 billion distinct species on Earth (Table \(\PageIndex{1}\)) of which there are only about 163 million animals and 340 thousand plants (Larsen et al., 2017)—this is obviously much greater than the current catalog of almost 2 million species!
|
Kingdom |
Weight (Gt)a |
Number of species (in million) |
% of all speciesb |
Number of described speciesc |
% of described species |
|---|---|---|---|---|---|
|
Animals |
2 |
163 |
7 |
1,205,336 |
< 1 |
|
Fungi |
12 |
165 |
7 |
135,110 |
< 0.1 |
|
Plants |
450 |
0.382c |
< 0.5 |
364,009 |
95 |
|
Chromista |
Unknown |
0.025c |
< 0.5 |
23,428 |
94 |
|
Protozoans |
4 |
163 |
7 |
2,686 |
0.1 |
|
Archaea |
7 |
0.0005 |
< 0.5 |
377 |
75 |
|
Bacteria |
70 |
1,746 |
78 |
9,982 |
0.1 |
a As gigatonnes of carbon, from Bar-On et al., 2018
b From Larsen et al. (2017)’s Table 1, Scenario 1
c From http://www.catalogueoflife.org
In ecology, rarefaction is a technique to assess species richness from the results of sampling. When sampling various species in a community, the larger the number of individuals sampled, the greater number of species that will be found. Rarefaction allows the calculation of species richness for a given number of individual samples, based on the construction of so-called rarefaction curves. This curve is a plot of the number of species as a function of the number of samples. Rarefaction curves generally grow rapidly at first, as the most common species are found, but the curves plateau as only the rarest species remain to be sampled.
Rarefaction curves are necessary for estimating species richness. Raw species richness counts, which are used to create accumulation curves, can only be compared when the species richness has reached a clear asymptote. Rarefaction curves also help to tell us what we don’t know. If a curve hasn’t yet reached its asymptote, there are additional species in that habitat still to discover.
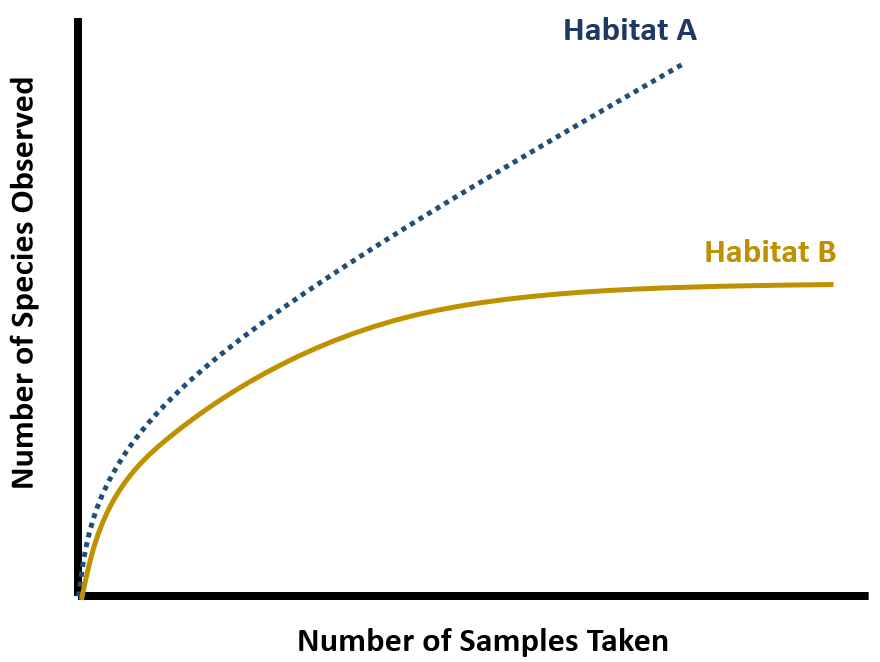
Figure \(\PageIndex{1}\): A simplified example of a rarefaction curve. In both habitats, the number of species observed (species richness) increases with the number of samples taken. In Habitat B, the curve eventually saturates (reaches an asymptote), suggesting that the actual species richness of the habitat has been reached. Habitat A, however, has not yet reached its asymptote, so additional sampling would reveal additional new species in this habitat.
Case Study: The Deep Sea of the Mediterranean Basin
From: Danovaro, R., Company, J.B., Corinaldesi, C., D'Onghia, G., Galil, B., Gambi, C., Gooday, A.J., Lampadariou, N., Luna, G.M., Morigi, C. and Olu, K., 2010. Deep-sea biodiversity in the Mediterranean Sea: the known, the unknown, and the unknowable. PloS one, 5(8), p.e11832.
Deep-sea ecosystems represent the largest biome of the global biosphere, but knowledge of their biodiversity is still scant. The Mediterranean basin has been proposed as a hotspot of terrestrial and coastal marine biodiversity, but has been supposed to be impoverished of deep-sea species richness. Danovaro et al. (2010) summarized all available information on benthic biodiversity (Prokaryotes, Foraminifera, Meiofauna, Macrofauna, and Megafauna) in different deep-sea ecosystems of the Mediterranean Sea (200 to more than 4,000 m depth), including open slopes, deep basins, canyons, cold seeps, seamounts, deep-water corals and deep-hypersaline anoxic basins and analyzed overall longitudinal and bathymetric patterns.
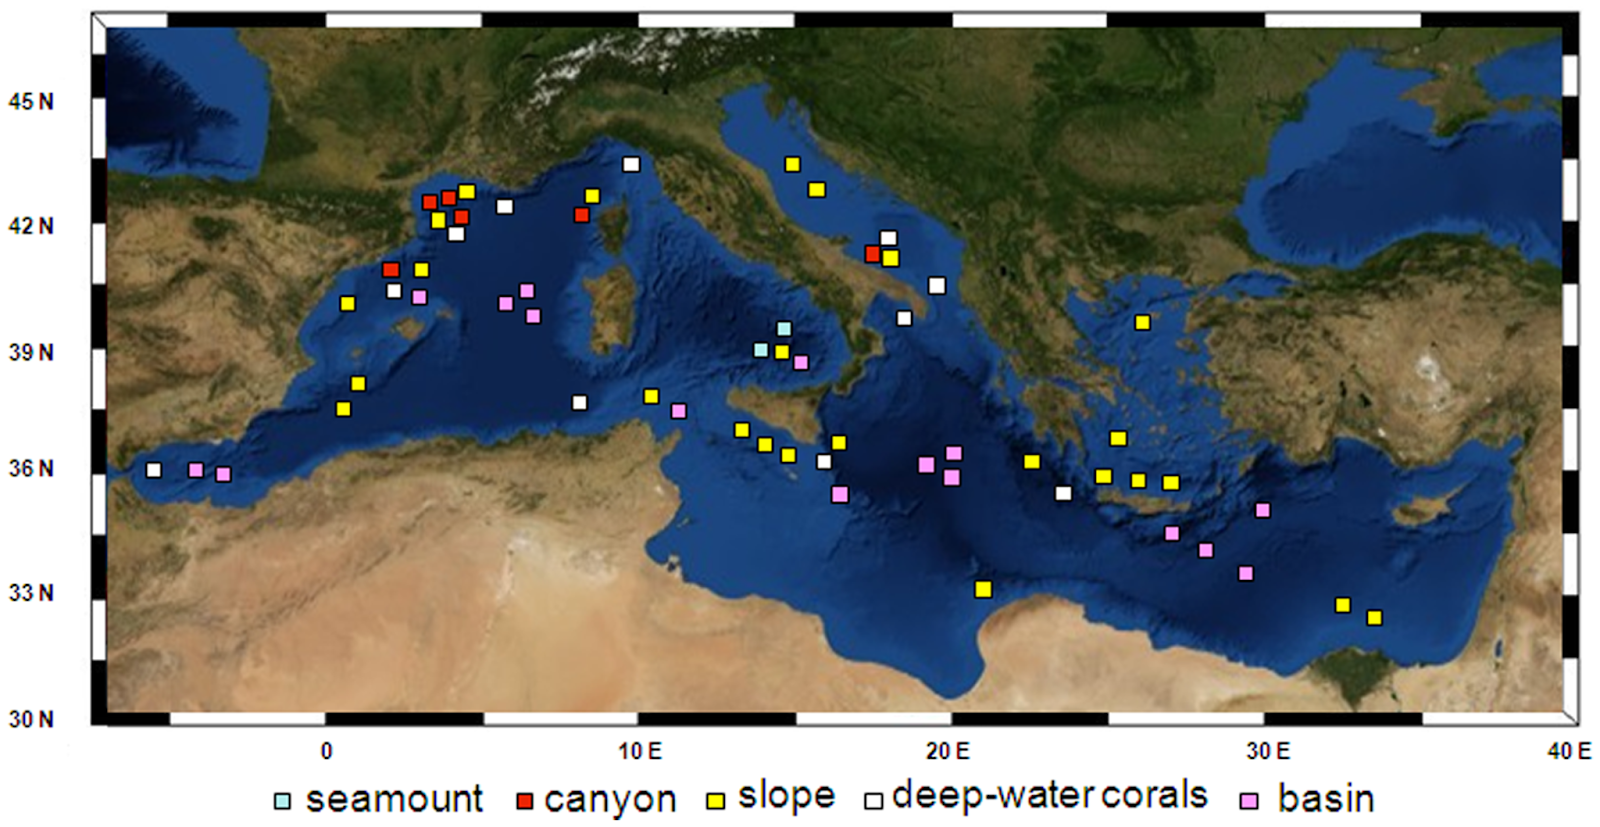
Figure \(\PageIndex{2}\): Investigated areas in the Mediterranean basin. Areas include slopes, seamounts, canyons, deep-water corals, and basin.
Danovaro et al. (2010) found that all of the biodiversity components, except Bacteria and Archaea, displayed a decreasing pattern with increasing water depth, but to a different extent for each component. Unlike patterns observed for faunal abundance, highest negative values of the slopes of the biodiversity patterns were observed for Meiofauna, followed by Macrofauna and Megafauna. Comparison of the biodiversity associated with open slopes, deep basins, canyons, and deep-water corals showed that the deep basins were the least diverse. Rarefaction curves allowed for estimation of the expected number of species for each benthic component in different bathymetric ranges. Species were unique across ecosystems, so each ecosystem contributes significantly to overall biodiversity.
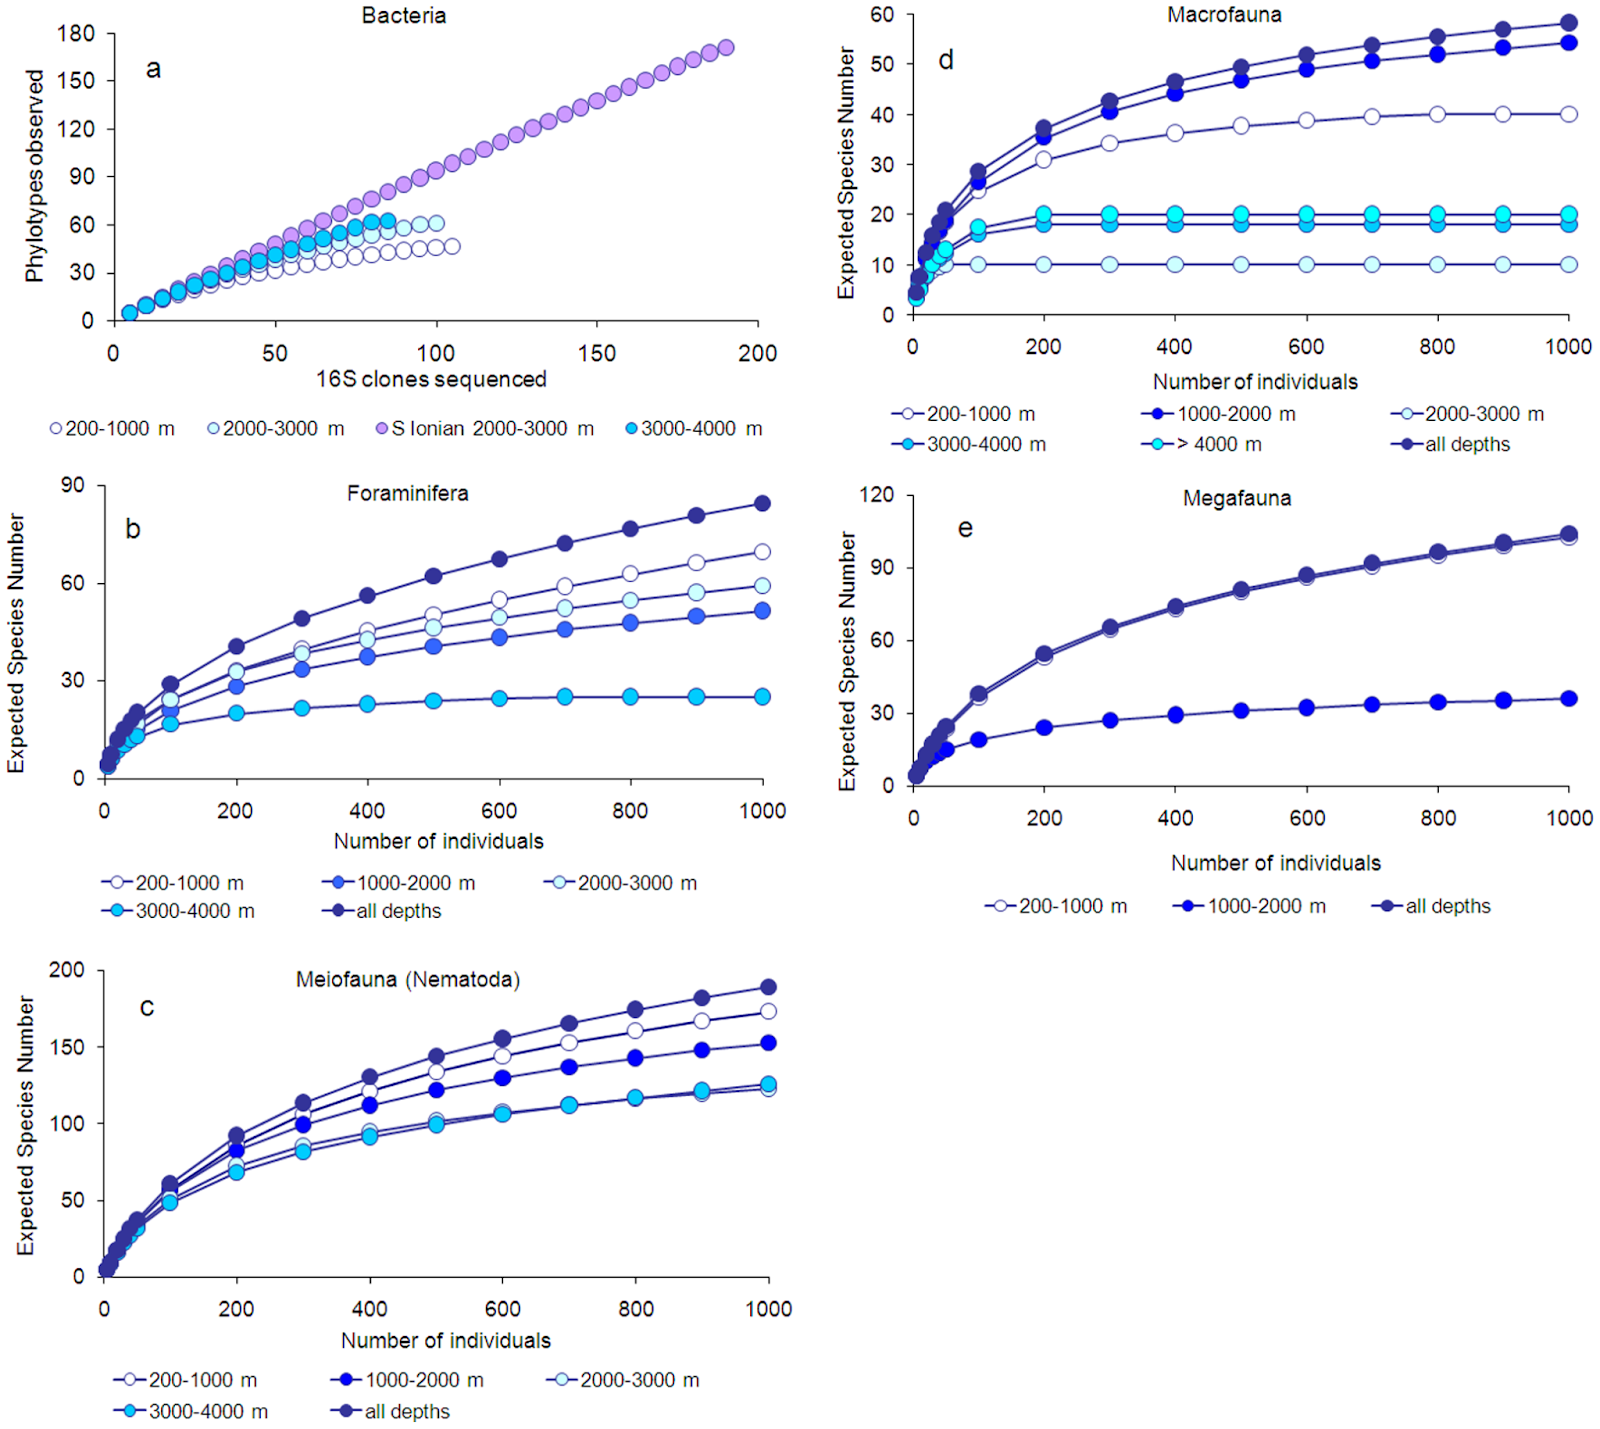
Figure \(\PageIndex{3}\): Rarefaction curves for the different components of the deep biota.
Danovaro et al. (2010) estimated that the overall deep-sea Mediterranean biodiversity (excluding prokaryotes) reaches approximately 2,805 species, of which about 66% is still undiscovered. Among the biotic components investigated (Prokaryotes excluded), most of the unknown species are within the phylum Nematoda, followed by Foraminifera, but an important fraction of macrofaunal and megafaunal species also remains unknown. The data in this study provide new insights into the patterns of biodiversity in the deep-sea Mediterranean and new clues for future investigations aimed at identifying the factors controlling and threatening deep-sea biodiversity.
References
Bar-On, Y.M., Phillips, R., & Milo, R. (2018). The biomass distribution on Earth. Proceedings of the National Academy of Sciences, 25, pp. 6505–11. https://doi.org/10.1073/pnas.1711842115
Colyn, M., Hulselmans, J., Sonet, G., et al. (2010). Discovery of a new duiker species (Bovidae: Cephalophinae) from the Dahomey Gap, West Africa. Zootaxa, 2637, pp. 1–30. http://doi. org/10.11646/zootaxa.2637.1.1
Costello, M.J., Wilson, S., & Houlding, B. (2012). Predicting total global species richness using rates of species description and estimates of taxonomic effort. Systematic Biology, 61, pp. 871–83. http://doi.org/10.1093/sysbio/syr080
Danovaro, R., Company, J.B., Corinaldesi, C., D'Onghia, G., Galil, B., Gambi, C., Gooday, A.J., Lampadariou, N., Luna, G.M., Morigi, C., & Olu, K. (2010). Deep-sea biodiversity in the Mediterranean Sea: The known, the unknown, and the unknowable. PloS one, 5(8), p.e11832.
Ebert, D.A., & Cailliet, G.M. (2011). Pristiophorus nancyae, a new species of sawshark (Chondrichthyes: Pristiophoridae) from southern Africa. Bulletin of Marine Science, 87, pp. 501– 12. https://doi.org/10.5343/bms.2010.1108
Paknia, O, Rajaei H., & Koch, A. (2015). Lack of well-maintained natural history collections and taxonomists in megadiverse developing countries hampers global biodiversity exploration. Organisms Diversity & Evolution, 15, pp. 619-629. http://doi.org/10.1007/s13127-015-0202-1
Larsen, B.B., E.C. Miller, M.K. Rhodes, et al. (2017). Inordinate fondness multiplied and redistributed: The number of species on Earth and the new pie of life. Quarterly Review of Biology, 92, pp. 229–65. https://doi.org/10.1086/693564
Musick, J.A. (2000). Latimeria chalumnae. The IUCN Red List of Threatened Species, e.T11375A3274618. http://doi.org/10.2305/IUCN.UK.2000....375A3274618.en
Ruggiero, M.A., Gordon, D.P., Orrell, T.M., et al. (2015). A higher-level classification of all living organisms. PLoS ONE 10: e0119248. http://doi.org/10.1371/journal.pone.0119248
Sforzi, A., Tweddle, J., Vogel, J., Lois, G., Wägele, W., Lakeman-Fraser, P., Makuch, Z., & Vohland, K. (2018). In Hecker, S., Haklay, M., Bowser, A., Makuch, Z., Vogel, J. & Bonn, A. (Eds.), Citizen science: Innovation in open science, society and policy. UCL Press, London. https://doi.org/10.14324 /111.9781787352339
Shirley, M.H., Carr, A.N., Nestler, J.H., et al. (2018). Systematic revision of the living African slender-snouted crocodiles (Mecistops Gray, 1844). Zootaxa, 4504, pp. 151–93. http://doi. org/10.11646/zootaxa.4504.2.1
Contributors and Attributions
Written and curated by A. Wilson and N. Gownaris (Gettysburg College) with material from the following open-access sources:
- Conservation Biology of Sub-Saharan Africa by John W. Wilson and Richard B. Primack
- Rarefaction (ecology) by Wikipedia, the Free Encyclopedia
- Danovaro, R., Company, J.B., Corinaldesi, C., D'Onghia, G., Galil, B., Gambi, C., Gooday, A.J., Lampadariou, N., Luna, G.M., Morigi, C. and Olu, K., 2010. Deep-sea biodiversity in the Mediterranean Sea: the known, the unknown, and the unknowable. PloS one, 5(8), p.e11832.