
9.4: Patterns of Biodiversity
- Page ID
- 33512

\( \newcommand{\vecs}[1]{\overset { \scriptstyle \rightharpoonup} {\mathbf{#1}} } \)
\( \newcommand{\vecd}[1]{\overset{-\!-\!\rightharpoonup}{\vphantom{a}\smash {#1}}} \)
\( \newcommand{\id}{\mathrm{id}}\) \( \newcommand{\Span}{\mathrm{span}}\)
( \newcommand{\kernel}{\mathrm{null}\,}\) \( \newcommand{\range}{\mathrm{range}\,}\)
\( \newcommand{\RealPart}{\mathrm{Re}}\) \( \newcommand{\ImaginaryPart}{\mathrm{Im}}\)
\( \newcommand{\Argument}{\mathrm{Arg}}\) \( \newcommand{\norm}[1]{\| #1 \|}\)
\( \newcommand{\inner}[2]{\langle #1, #2 \rangle}\)
\( \newcommand{\Span}{\mathrm{span}}\)
\( \newcommand{\id}{\mathrm{id}}\)
\( \newcommand{\Span}{\mathrm{span}}\)
\( \newcommand{\kernel}{\mathrm{null}\,}\)
\( \newcommand{\range}{\mathrm{range}\,}\)
\( \newcommand{\RealPart}{\mathrm{Re}}\)
\( \newcommand{\ImaginaryPart}{\mathrm{Im}}\)
\( \newcommand{\Argument}{\mathrm{Arg}}\)
\( \newcommand{\norm}[1]{\| #1 \|}\)
\( \newcommand{\inner}[2]{\langle #1, #2 \rangle}\)
\( \newcommand{\Span}{\mathrm{span}}\) \( \newcommand{\AA}{\unicode[.8,0]{x212B}}\)
\( \newcommand{\vectorA}[1]{\vec{#1}} % arrow\)
\( \newcommand{\vectorAt}[1]{\vec{\text{#1}}} % arrow\)
\( \newcommand{\vectorB}[1]{\overset { \scriptstyle \rightharpoonup} {\mathbf{#1}} } \)
\( \newcommand{\vectorC}[1]{\textbf{#1}} \)
\( \newcommand{\vectorD}[1]{\overrightarrow{#1}} \)
\( \newcommand{\vectorDt}[1]{\overrightarrow{\text{#1}}} \)
\( \newcommand{\vectE}[1]{\overset{-\!-\!\rightharpoonup}{\vphantom{a}\smash{\mathbf {#1}}}} \)
\( \newcommand{\vecs}[1]{\overset { \scriptstyle \rightharpoonup} {\mathbf{#1}} } \)
\( \newcommand{\vecd}[1]{\overset{-\!-\!\rightharpoonup}{\vphantom{a}\smash {#1}}} \)
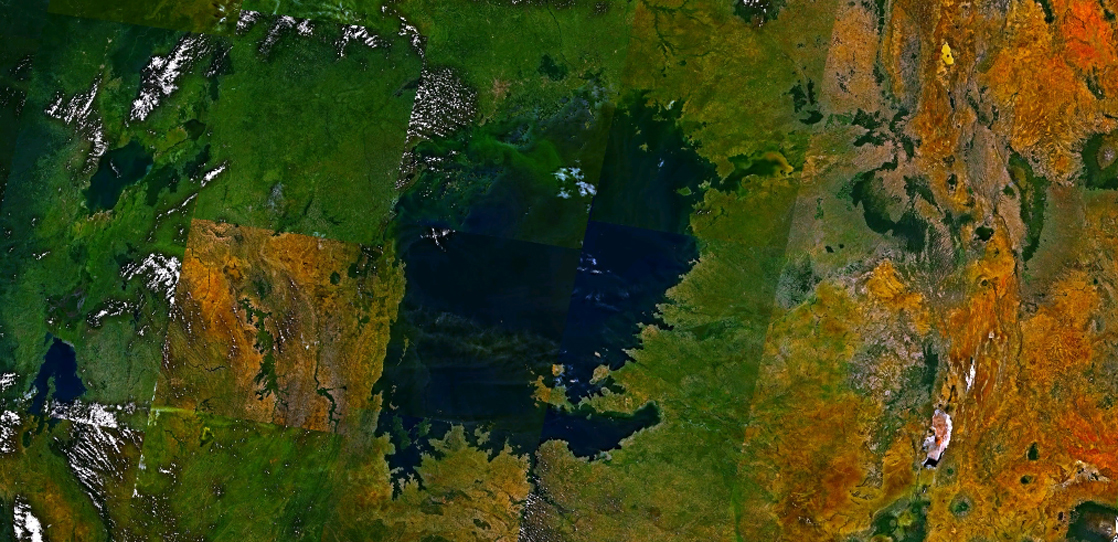
\(\newcommand{\avec}{\mathbf a}\) \(\newcommand{\bvec}{\mathbf b}\) \(\newcommand{\cvec}{\mathbf c}\) \(\newcommand{\dvec}{\mathbf d}\) \(\newcommand{\dtil}{\widetilde{\mathbf d}}\) \(\newcommand{\evec}{\mathbf e}\) \(\newcommand{\fvec}{\mathbf f}\) \(\newcommand{\nvec}{\mathbf n}\) \(\newcommand{\pvec}{\mathbf p}\) \(\newcommand{\qvec}{\mathbf q}\) \(\newcommand{\svec}{\mathbf s}\) \(\newcommand{\tvec}{\mathbf t}\) \(\newcommand{\uvec}{\mathbf u}\) \(\newcommand{\vvec}{\mathbf v}\) \(\newcommand{\wvec}{\mathbf w}\) \(\newcommand{\xvec}{\mathbf x}\) \(\newcommand{\yvec}{\mathbf y}\) \(\newcommand{\zvec}{\mathbf z}\) \(\newcommand{\rvec}{\mathbf r}\) \(\newcommand{\mvec}{\mathbf m}\) \(\newcommand{\zerovec}{\mathbf 0}\) \(\newcommand{\onevec}{\mathbf 1}\) \(\newcommand{\real}{\mathbb R}\) \(\newcommand{\twovec}[2]{\left[\begin{array}{r}#1 \\ #2 \end{array}\right]}\) \(\newcommand{\ctwovec}[2]{\left[\begin{array}{c}#1 \\ #2 \end{array}\right]}\) \(\newcommand{\threevec}[3]{\left[\begin{array}{r}#1 \\ #2 \\ #3 \end{array}\right]}\) \(\newcommand{\cthreevec}[3]{\left[\begin{array}{c}#1 \\ #2 \\ #3 \end{array}\right]}\) \(\newcommand{\fourvec}[4]{\left[\begin{array}{r}#1 \\ #2 \\ #3 \\ #4 \end{array}\right]}\) \(\newcommand{\cfourvec}[4]{\left[\begin{array}{c}#1 \\ #2 \\ #3 \\ #4 \end{array}\right]}\) \(\newcommand{\fivevec}[5]{\left[\begin{array}{r}#1 \\ #2 \\ #3 \\ #4 \\ #5 \\ \end{array}\right]}\) \(\newcommand{\cfivevec}[5]{\left[\begin{array}{c}#1 \\ #2 \\ #3 \\ #4 \\ #5 \\ \end{array}\right]}\) \(\newcommand{\mattwo}[4]{\left[\begin{array}{rr}#1 \amp #2 \\ #3 \amp #4 \\ \end{array}\right]}\) \(\newcommand{\laspan}[1]{\text{Span}\{#1\}}\) \(\newcommand{\bcal}{\cal B}\) \(\newcommand{\ccal}{\cal C}\) \(\newcommand{\scal}{\cal S}\) \(\newcommand{\wcal}{\cal W}\) \(\newcommand{\ecal}{\cal E}\) \(\newcommand{\coords}[2]{\left\{#1\right\}_{#2}}\) \(\newcommand{\gray}[1]{\color{gray}{#1}}\) \(\newcommand{\lgray}[1]{\color{lightgray}{#1}}\) \(\newcommand{\rank}{\operatorname{rank}}\) \(\newcommand{\row}{\text{Row}}\) \(\newcommand{\col}{\text{Col}}\) \(\renewcommand{\row}{\text{Row}}\) \(\newcommand{\nul}{\text{Nul}}\) \(\newcommand{\var}{\text{Var}}\) \(\newcommand{\corr}{\text{corr}}\) \(\newcommand{\len}[1]{\left|#1\right|}\) \(\newcommand{\bbar}{\overline{\bvec}}\) \(\newcommand{\bhat}{\widehat{\bvec}}\) \(\newcommand{\bperp}{\bvec^\perp}\) \(\newcommand{\xhat}{\widehat{\xvec}}\) \(\newcommand{\vhat}{\widehat{\vvec}}\) \(\newcommand{\uhat}{\widehat{\uvec}}\) \(\newcommand{\what}{\widehat{\wvec}}\) \(\newcommand{\Sighat}{\widehat{\Sigma}}\) \(\newcommand{\lt}{<}\) \(\newcommand{\gt}{>}\) \(\newcommand{\amp}{&}\) \(\definecolor{fillinmathshade}{gray}{0.9}\)Biodiversity is not evenly distributed on the planet. For example, Lake Victoria in Africa (figure \(\PageIndex{a}\)) contained almost 500 species from a family of fishes called cichlids before the introduction of the invasive Nile Perch in the 1980s and 1990s caused a mass extinction. (Note that this number does not include species of other fish families.) Lake Huron, the second largest of North America's Great Lakes, contains about 79 species of fish, all of which are found in many other lakes in North America. What accounts for the difference in diversity between Lake Victoria and Lake Huron? Lake Victoria is a tropical lake, while Lake Huron is a temperate lake. Lake Huron in its present form is only about 7,000 years old, while Lake Victoria in its present form is about 15,000 years old. These two factors, latitude and age, are two of several hypotheses biogeographers have suggested to explain biodiversity patterns on Earth.
Biogeography is the study of the distribution of the world’s species both in the past and in the present. The work of biogeographers is critical to understanding our physical environment, how the environment affects species, and how changes in environment impact the distribution of a species. There are three main subfields of biogeography: ecological biogeography, historical biogeography (called paleobiogeography), and conservation biogeography. Ecological biogeography studies the current factors affecting the distribution of plants and animals. Historical biogeography, as the name implies, studies the past distribution of species. Conservation biogeography, on the other hand, is focused on the protection and restoration of species based upon the known historical and current ecological information.
The Tropics Have High Biodiversity
One of the oldest observed patterns in ecology is that biodiversity typically increases as latitude declines. In other words, the greatest species richness occurs near the equator and the lowest richness occurs near the poles (figure \(\PageIndex{b}\)).
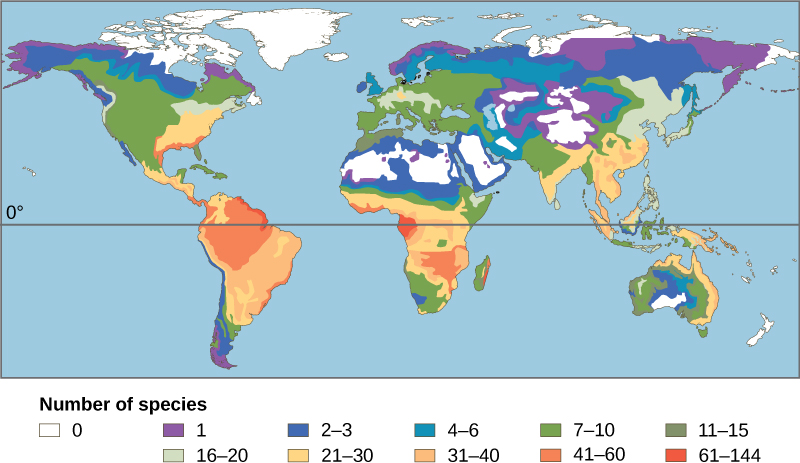
It is not yet clear why biodiversity increases closer to the equator, but hypotheses include the greater age of the ecosystems in the tropics versus temperate regions, which were largely devoid of life or drastically impoverished during the last ice age. The greater age provides more time for speciation, the evolutionary process of creating new species. Another possible explanation is the greater energy the tropics receive from the sun, but scientists have not been able to explain how greater energy input could translate into more species. The complexity of tropical ecosystems may promote speciation by increasing the habitat complexity, thus providing more ecological niches (see Communities chapter). Lastly, the tropics have been perceived as being more stable than temperate regions, which have a pronounced climate and day-length seasonality. The stability of tropical ecosystems might promote speciation. Regardless of the mechanisms, it is certainly true that biodiversity is greatest in the tropics. There are also high numbers of endemic species.
Biodiversity Hotspots
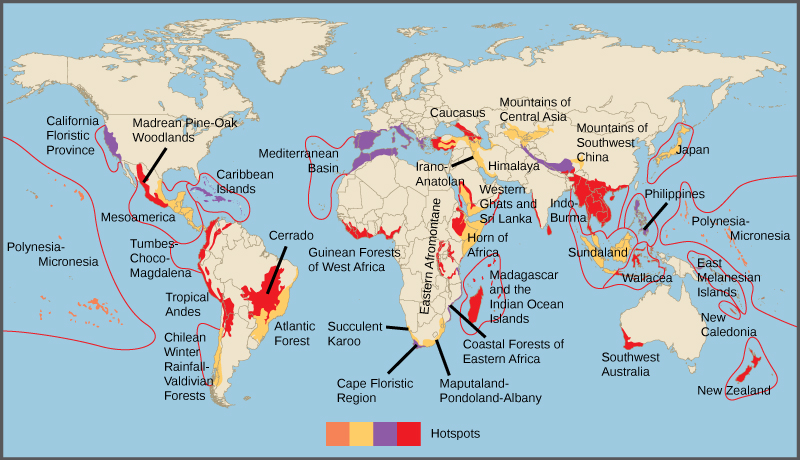
In 1988, British environmentalist Norman Myers developed a conservation concept to identify geographical areas rich in species and at significant risk for species loss: biodiversity hotspots. The original criteria for a hotspot included the presence of 1500 or more endemic plant species and 70 percent of the area disturbed by human activity. Endemic species are found in only one location. For example, all of cichlid species found in Lake Victoria only occurred there. The blue jay is endemic to North America, while the Barton Springs salamander is endemic to the mouth of one spring in Austin, Texas. Endemic species with highly restricted distributions, like the Barton Springs salamander, are particularly vulnerable to extinction. If a population of a widespread species declines in one region, individuals from another region may be able to recolonize the first location, but this is not possible for endemic species. Endemic species are particularly common in isolated regions, such as mountaintops or islands. Endemism is especially likely on islands that are large and far from the mainland. Identifying biodiversity hotspots aids with conservation efforts, a kind of conservation triage. By protecting hotspots, governments are able to protect a larger number of species. There are now 34 biodiversity hotspots (figure \(\PageIndex{c}\)) containing large numbers of endemic species, which include half of Earth’s endemic plants.
Biodiversity Hotspots in South Africa
A rich species diversity is found in South Africa. With a land surface of approximately 148,000 km2 (about 57,000 square miles), representing approximately 1% of the Earth's total surface, South Africa contains 10% of the world's total known bird, fish and plant species, and 6% of the world's mammal and reptile species.
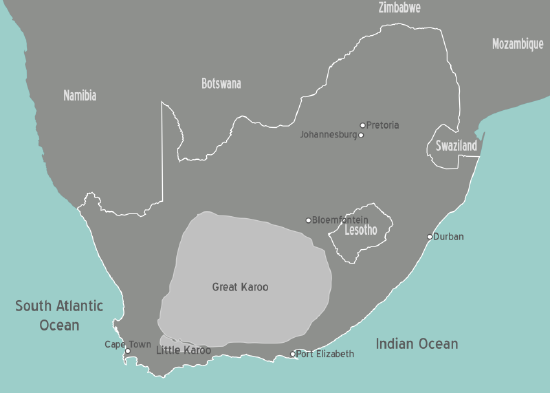
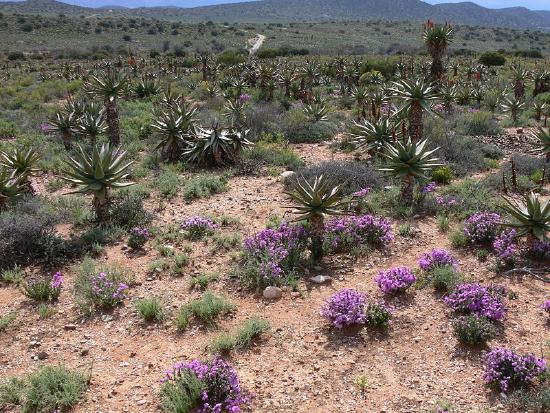
This natural wealth is threatened by the expansion of the human population and the increasing demand this places on the environment. The Karoo (figure \(\PageIndex{d}\)) and the Cape are biodiversity hotspots in South Africa. South Africa has a wide range of climatic conditions and many variations in landscape, creating a variety of ecological niches, which can promote species diversity. These various landscapes give rise to the biomes which allow a wide variety of life to survive.
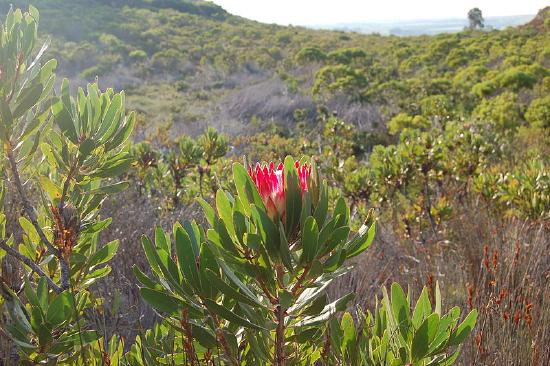
More than 20,300 species of flowering plants occur in South Africa (figure \(\PageIndex{e}\)). One of the six most important areas of plant growth in the world is in the Western Cape. Most of the 2,000 threatened species of plants are found in the fynbos in South-West Cape (figure \(\PageIndex{f}\)).
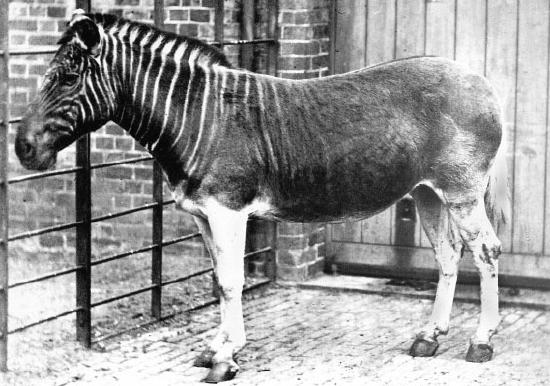
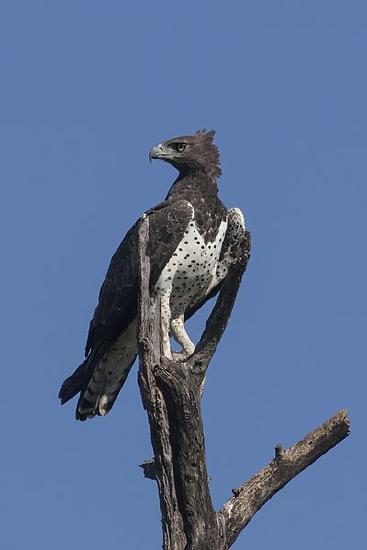
South Africa is home to 243 mammal species. Among the 17 threatened species in South Africa are the black rhino, pangolin, and giant golden mole. The blue antelope and quagga (figure \(\PageIndex{g}\)) have become extinct. Of more than 800 bird species, 26 are threatened, including the penguin, Cape vulture, martial eagle (figure \(\PageIndex{h}\)), and Cape parrot. In total 370 reptiles and amphibians occur in the region of which 21 are threatened. Six of these are endangered. Of the 220 freshwater fishes in South Africa, 21 are threatened. There are more than 2,000 marine fish species. While many insect species remain unidentified, 80,000 insects are known to occur.
Modified by Melissa Ha from Biodiversity and Biomes from Life Sciences Grade 10 by Siyavula (CC-BY)
Spatial and Temporal Heterogeneity Promote Biodiversity
Environmental heterogeneity refers to the lack of uniformity in an area. Regions that are spatially heterogeneous are composed of smaller areas with contrasting vegetation, water and nutrient availability, soils and rocks, or other features. In regions that are temporally heterogeneous, conditions fluctuate over time. Heterogeneity promotes species richness by increasing the number of ecological niches, and heterogenous regions are thus priorities with respect to conserving biodiversity. Some regions are more hetergeneous than others. For example, a wetland consists of many microhabitats that differ in soil type and water availability, and water levels change over the seasons. Other regions, like the temperate grasslands in the midwestern United States, are relatively homogenous (uniform). Just as biodiversity can be assessed at a variety of scales, heterogeneity can be measured at large scales (such as within an entire biome) or small scales (such as within a single meadow).
Attributions
Modified by Melissa Ha from the following sources:
- Importance of Biodiversity from Environmental Biology by Matthew R. Fisher (licensed under CC-BY)
- The Biodiverisity Crisis and Prelude to Conservation Biology and Biodiversity from General Biology by OpenStax (licensed under CC-BY)