Biology LibreTexts

20.3: Eutrophication and Dead Zones

  • Page ID
    92905
  • \( \newcommand{\vecs}[1]{\overset { \scriptstyle \rightharpoonup} {\mathbf{#1}} } \)

    \( \newcommand{\vecd}[1]{\overset{-\!-\!\rightharpoonup}{\vphantom{a}\smash {#1}}} \)

    \( \newcommand{\id}{\mathrm{id}}\) \( \newcommand{\Span}{\mathrm{span}}\)

    ( \newcommand{\kernel}{\mathrm{null}\,}\) \( \newcommand{\range}{\mathrm{range}\,}\)

    \( \newcommand{\RealPart}{\mathrm{Re}}\) \( \newcommand{\ImaginaryPart}{\mathrm{Im}}\)

    \( \newcommand{\Argument}{\mathrm{Arg}}\) \( \newcommand{\norm}[1]{\| #1 \|}\)

    \( \newcommand{\inner}[2]{\langle #1, #2 \rangle}\)

    \( \newcommand{\Span}{\mathrm{span}}\)

    \( \newcommand{\id}{\mathrm{id}}\)

    \( \newcommand{\Span}{\mathrm{span}}\)

    \( \newcommand{\kernel}{\mathrm{null}\,}\)

    \( \newcommand{\range}{\mathrm{range}\,}\)

    \( \newcommand{\RealPart}{\mathrm{Re}}\)

    \( \newcommand{\ImaginaryPart}{\mathrm{Im}}\)

    \( \newcommand{\Argument}{\mathrm{Arg}}\)

    \( \newcommand{\norm}[1]{\| #1 \|}\)

    \( \newcommand{\inner}[2]{\langle #1, #2 \rangle}\)

    \( \newcommand{\Span}{\mathrm{span}}\) \( \newcommand{\AA}{\unicode[.8,0]{x212B}}\)

    \( \newcommand{\vectorA}[1]{\vec{#1}}      % arrow\)

    \( \newcommand{\vectorAt}[1]{\vec{\text{#1}}}      % arrow\)

    \( \newcommand{\vectorB}[1]{\overset { \scriptstyle \rightharpoonup} {\mathbf{#1}} } \)

    \( \newcommand{\vectorC}[1]{\textbf{#1}} \)

    \( \newcommand{\vectorD}[1]{\overrightarrow{#1}} \)

    \( \newcommand{\vectorDt}[1]{\overrightarrow{\text{#1}}} \)

    \( \newcommand{\vectE}[1]{\overset{-\!-\!\rightharpoonup}{\vphantom{a}\smash{\mathbf {#1}}}} \)

    \( \newcommand{\vecs}[1]{\overset { \scriptstyle \rightharpoonup} {\mathbf{#1}} } \)

    \( \newcommand{\vecd}[1]{\overset{-\!-\!\rightharpoonup}{\vphantom{a}\smash {#1}}} \)

    \(\newcommand{\avec}{\mathbf a}\) \(\newcommand{\bvec}{\mathbf b}\) \(\newcommand{\cvec}{\mathbf c}\) \(\newcommand{\dvec}{\mathbf d}\) \(\newcommand{\dtil}{\widetilde{\mathbf d}}\) \(\newcommand{\evec}{\mathbf e}\) \(\newcommand{\fvec}{\mathbf f}\) \(\newcommand{\nvec}{\mathbf n}\) \(\newcommand{\pvec}{\mathbf p}\) \(\newcommand{\qvec}{\mathbf q}\) \(\newcommand{\svec}{\mathbf s}\) \(\newcommand{\tvec}{\mathbf t}\) \(\newcommand{\uvec}{\mathbf u}\) \(\newcommand{\vvec}{\mathbf v}\) \(\newcommand{\wvec}{\mathbf w}\) \(\newcommand{\xvec}{\mathbf x}\) \(\newcommand{\yvec}{\mathbf y}\) \(\newcommand{\zvec}{\mathbf z}\) \(\newcommand{\rvec}{\mathbf r}\) \(\newcommand{\mvec}{\mathbf m}\) \(\newcommand{\zerovec}{\mathbf 0}\) \(\newcommand{\onevec}{\mathbf 1}\) \(\newcommand{\real}{\mathbb R}\) \(\newcommand{\twovec}[2]{\left[\begin{array}{r}#1 \\ #2 \end{array}\right]}\) \(\newcommand{\ctwovec}[2]{\left[\begin{array}{c}#1 \\ #2 \end{array}\right]}\) \(\newcommand{\threevec}[3]{\left[\begin{array}{r}#1 \\ #2 \\ #3 \end{array}\right]}\) \(\newcommand{\cthreevec}[3]{\left[\begin{array}{c}#1 \\ #2 \\ #3 \end{array}\right]}\) \(\newcommand{\fourvec}[4]{\left[\begin{array}{r}#1 \\ #2 \\ #3 \\ #4 \end{array}\right]}\) \(\newcommand{\cfourvec}[4]{\left[\begin{array}{c}#1 \\ #2 \\ #3 \\ #4 \end{array}\right]}\) \(\newcommand{\fivevec}[5]{\left[\begin{array}{r}#1 \\ #2 \\ #3 \\ #4 \\ #5 \\ \end{array}\right]}\) \(\newcommand{\cfivevec}[5]{\left[\begin{array}{c}#1 \\ #2 \\ #3 \\ #4 \\ #5 \\ \end{array}\right]}\) \(\newcommand{\mattwo}[4]{\left[\begin{array}{rr}#1 \amp #2 \\ #3 \amp #4 \\ \end{array}\right]}\) \(\newcommand{\laspan}[1]{\text{Span}\{#1\}}\) \(\newcommand{\bcal}{\cal B}\) \(\newcommand{\ccal}{\cal C}\) \(\newcommand{\scal}{\cal S}\) \(\newcommand{\wcal}{\cal W}\) \(\newcommand{\ecal}{\cal E}\) \(\newcommand{\coords}[2]{\left\{#1\right\}_{#2}}\) \(\newcommand{\gray}[1]{\color{gray}{#1}}\) \(\newcommand{\lgray}[1]{\color{lightgray}{#1}}\) \(\newcommand{\rank}{\operatorname{rank}}\) \(\newcommand{\row}{\text{Row}}\) \(\newcommand{\col}{\text{Col}}\) \(\renewcommand{\row}{\text{Row}}\) \(\newcommand{\nul}{\text{Nul}}\) \(\newcommand{\var}{\text{Var}}\) \(\newcommand{\corr}{\text{corr}}\) \(\newcommand{\len}[1]{\left|#1\right|}\) \(\newcommand{\bbar}{\overline{\bvec}}\) \(\newcommand{\bhat}{\widehat{\bvec}}\) \(\newcommand{\bperp}{\bvec^\perp}\) \(\newcommand{\xhat}{\widehat{\xvec}}\) \(\newcommand{\vhat}{\widehat{\vvec}}\) \(\newcommand{\uhat}{\widehat{\uvec}}\) \(\newcommand{\what}{\widehat{\wvec}}\) \(\newcommand{\Sighat}{\widehat{\Sigma}}\) \(\newcommand{\lt}{<}\) \(\newcommand{\gt}{>}\) \(\newcommand{\amp}{&}\) \(\definecolor{fillinmathshade}{gray}{0.9}\)

    Key Points

    • Excess phosphorus and nitrogen in the ecosystem leads to the death of many organisms, causing dead zones.
    • Dead zones are caused by by eutrophication, oil spills, dumping of toxic chemicals, and other human activities.

    Key Terms

    • eutrophication: process whereby excess levels of nitrogen or phosphorus cause excessive growth of microorganisms, depleting dissolved oxygen levels and kill ecosystem fauna
    • dead zone: an area within a freshwater or marine ecosystem where large areas are depleted of their normal flora and fauna; caused by excessive nutrient pollution

    Eutrophication and Dead Zones

    Nutrients in soil and water are generally beneficial when they exist at naturally occurring levels. Nitrogen fertilizers have been applied to farm fields for decades in order to maximize production of agricultural lands. However, an unintended consequence is that the same nutrients can be detrimental to aquatic ecosystems when introduced excessively for agricultural or other purposes. Nitrogen (N) and Phosphorus (P) are introduced by fertilizers that are used intensively in agriculture, as well as golf courses and some lawns and gardens. Farm animal waste and sewage also provide large amounts of reactive N and P. Phosphorus was formerly used heavily as an additive in laundry and dishwater detergents, but since the 1970's it has been phased out in both through a combination of state and federal regulations. Overall, our modern society has altered the global N and P cycles such that there is an overabundance in many settings.

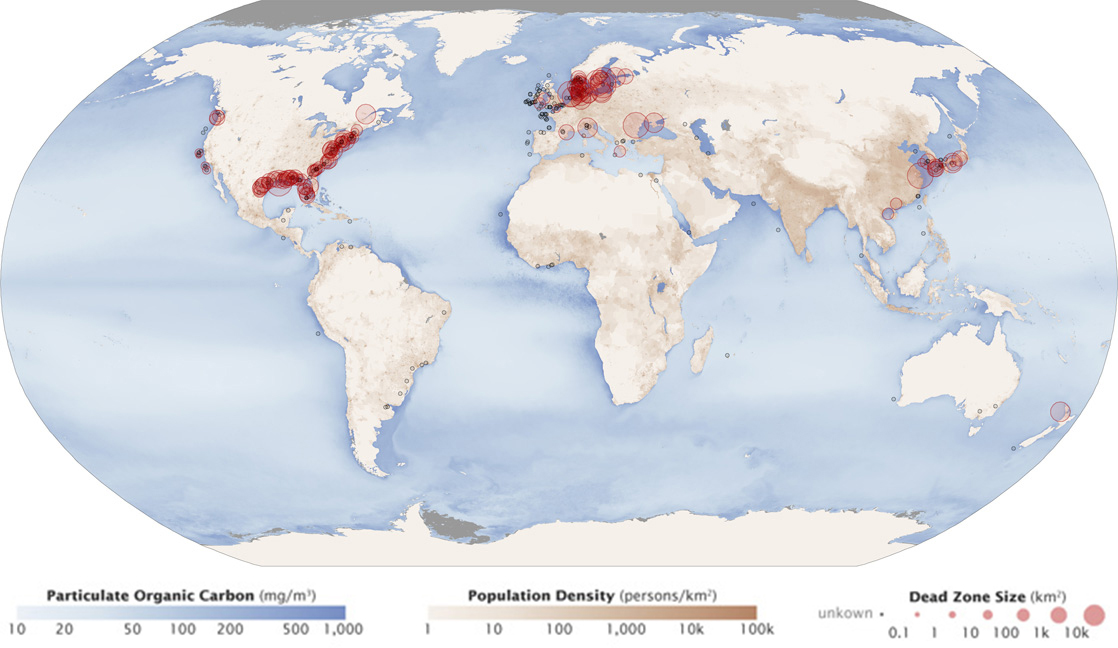
    Excessive nutrients (not utilized) are often washed into drainage ways, streams, and rivers during rainfall and storm events. Eutrophication occurs when excess phosphorus and nitrogen from fertilizer runoff or sewage causes excessive growth of algae. Algal blooms that block light and therefore kill aquatic plants in rivers, lakes, and seas. The subsequent death and decay of these organisms depletes dissolved oxygen, which leads to the death of aquatic organisms such as shellfish and fish. This process is responsible for dead zones, large areas in lakes and oceans near the mouths of rivers that are periodically depleted of their normal flora and fauna, and for massive fish kills, which often occur during the summer months (figure \(\PageIndex{1}\)). There are more than 500 dead zones worldwide. Phosphate and nitrate runoff from fertilizers also negatively affect several lake and bay ecosystems including the Chesapeake Bay in the eastern United States.

    One of the worst dead zones is off the coast of the United States in the Gulf of Mexico (figure \(\PageIndex{1}\)). Fertilizer runoff from the Mississippi River basin created a dead zone, which reached its peak size of 8,776 square miles in 2017. The Mississippi River dumps high-nutrient runoff from its drainage basin that includes vast agricultural lands in the American Midwest. Increased algal growth produced by these nutrients has affected important shrimp fishing grounds in the Gulf. The primary source of the nutrients is the heavily tile-drained areas of farmland in the Midwest corn and soybean belt (SW Minnesota, N Iowa, NE Illinois, N Indiana and NW Ohio). Improved soil drainage systems over the past century or more have allowed for effective transport of nitrate compounds as stormwater runoff into drainage basins (Ohio River, Wabash River, Illinois River, Missouri River, etc.) that feed into the Mississippi River.  Prior to drainage, these wetlands would also have removed nutrients through denitrification and other biogeochemical processes. In other words, the same drainage tiles that allow for the agricultural benefit of having rich bottomland/wetland soils in production, have the disadvantage of increased and more rapid movements of nitrate solutes to the Gulf of Mexico. Such large-scale problems, across state governmental boundaries, can only be fully addressed in the future with a national system of incentives, regulations, or laws.

    Red circles mark dead zones along the coast of the eastern and southern U.S., western Europe, and surrounding South Korea and Japan on a world map.

    Figure \(\PageIndex{1}\): Dead zones occur when phosphorus and nitrogen from fertilizers cause excessive growth of microorganisms, which depletes oxygen and kills fauna. This map shows dead zones around the world in 2008. Worldwide, large dead zones are found in coastal areas of high population density (credit: NASA Earth Observatory).

    In addition to fertilizers, nitrogen inputs to watersheds can also include atmospheric deposition, livestock waste, and sewage, but nitrogen fertilizers comprise a significant majority of the input to monitored streams, particularly in springtime when much fertilizer is applied. Possible solutions to this problem include encouraging farmers to apply a more limited quantity of fertilizer in the spring (only as much as necessary), rather than in the fall, to allow for considerably less time for stormwater or meltwater runoff. Other solutions include maintaining cover crops, or restoring wetlands in key locations to contain nitrate losses. An overall strategy that limits the excess capacity of nutrients can simultaneously benefit farmers (by limiting cost), the ecology of stream watersheds and coastal ecosystems (also locally stressed by oil spills and other pollution). Over the long term, more efforts will need to be made in the Mississippi River Basin, and globally in similarly stressed agricultural or urban watersheds (figure \(\PageIndex{1}\)), to improve the health and sustainability of our soil, land, and aquatic ecosystems.

    Everyday Connection: Chesapeake Bay

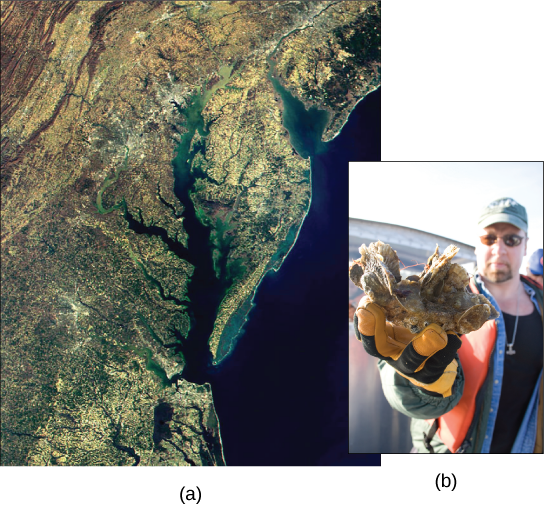
    The Chesapeake Bay has long been valued as one of the most scenic areas on Earth; it is now in distress and is recognized as a declining ecosystem. In the 1970s, the Chesapeake Bay was one of the first ecosystems to have identified dead zones, which continue to kill many fish and bottom-dwelling species, such as clams, oysters, and worms (Figure \(\PageIndex{2}\)). Several species have declined in the Chesapeake Bay due to surface water runoff containing excess nutrients from artificial fertilizer used on land. The source of the fertilizers (with high nitrogen and phosphate content) is not limited to agricultural practices. There are many nearby urban areas and more than 150 rivers and streams empty into the bay that are carrying fertilizer runoff from lawns and gardens. Thus, the decline of the Chesapeake Bay is a complex issue and requires the cooperation of industry, agriculture, and everyday homeowners.

    Aerial view of the Chesapeake Bay (a). A man holding a clump of oysters (b).

    Figure \(\PageIndex{2}\): This (a) satellite image shows the Chesapeake Bay, an ecosystem affected by phosphate and nitrate runoff. A (b) member of the Army Corps of Engineers holds a clump of oysters being used as a part of the oyster restoration effort in the bay (credit a: modification of work by NASA/MODIS; credit b: modification of work by U.S. Army).

    Of particular interest to conservationists is the oyster population; it is estimated that more than 200,000 acres of oyster reefs existed in the bay in the 1700s, but that number has now declined to only 36,000 acres. Oyster harvesting was once a major industry for Chesapeake Bay, but it declined 88 percent between 1982 and 2007. This decline was due not only to fertilizer runoff and dead zones but also to overexploitation. Oysters require a certain minimum population density because they must be in close proximity to reproduce. Human activity has altered the oyster population and locations, greatly disrupting the ecosystem.

    The restoration of the oyster population in the Chesapeake Bay has been ongoing for several years with mixed success. Not only do many people find oysters good to eat, but they also clean up the bay. Oysters are filter feeders, and as they eat, they clean the water around them. In the 1700s, it was estimated that it took only a few days for the oyster population to filter the entire volume of the bay. Today, with changed water conditions, it is estimated that the present population would take nearly a year to do the same job.

    Restoration efforts have been ongoing for several years by non-profit organizations, such as the Chesapeake Bay Foundation. The restoration goal is to find a way to increase population density so the oysters can reproduce more efficiently. Many disease-resistant varieties (developed at the Virginia Institute of Marine Science for the College of William and Mary) are now available and have been used in the construction of experimental oyster reefs. Efforts to clean and restore the bay by Virginia and Delaware have been hampered because much of the pollution entering the bay comes from other states, which stresses the need for inter-state cooperation to gain successful restoration.

    The new, hearty oyster strains have also spawned a new and economically viable industry—oyster aquaculture—which not only supplies oysters for food and profit, but also has the added benefit of cleaning the bay.

    Suggested Supplementary Reading

    Bruckner, M. 2018. The Gulf of Mexico Dead Zone. [Website]

    References

    Cell Press. (2020, August 6). Researchers hope to save seabirds by calculating the value of their excrement. Retrieved August 7, 2020 from ScienceDaily.

    Contributors and Attributions

    Modified by Kyle Whittinghill (University of Pittsburgh) and Melissa Ha from the following sources:


    This page titled 20.3: Eutrophication and Dead Zones is shared under a CC BY-NC-SA license and was authored, remixed, and/or curated by Melissa Ha and Rachel Schleiger (ASCCC Open Educational Resources Initiative) .