
1.6: Spectrophotometry
- Page ID
- 36748
\( \newcommand{\vecs}[1]{\overset { \scriptstyle \rightharpoonup} {\mathbf{#1}} } \)
\( \newcommand{\vecd}[1]{\overset{-\!-\!\rightharpoonup}{\vphantom{a}\smash {#1}}} \)
\( \newcommand{\dsum}{\displaystyle\sum\limits} \)
\( \newcommand{\dint}{\displaystyle\int\limits} \)
\( \newcommand{\dlim}{\displaystyle\lim\limits} \)
\( \newcommand{\id}{\mathrm{id}}\) \( \newcommand{\Span}{\mathrm{span}}\)
( \newcommand{\kernel}{\mathrm{null}\,}\) \( \newcommand{\range}{\mathrm{range}\,}\)
\( \newcommand{\RealPart}{\mathrm{Re}}\) \( \newcommand{\ImaginaryPart}{\mathrm{Im}}\)
\( \newcommand{\Argument}{\mathrm{Arg}}\) \( \newcommand{\norm}[1]{\| #1 \|}\)
\( \newcommand{\inner}[2]{\langle #1, #2 \rangle}\)
\( \newcommand{\Span}{\mathrm{span}}\)
\( \newcommand{\id}{\mathrm{id}}\)
\( \newcommand{\Span}{\mathrm{span}}\)
\( \newcommand{\kernel}{\mathrm{null}\,}\)
\( \newcommand{\range}{\mathrm{range}\,}\)
\( \newcommand{\RealPart}{\mathrm{Re}}\)
\( \newcommand{\ImaginaryPart}{\mathrm{Im}}\)
\( \newcommand{\Argument}{\mathrm{Arg}}\)
\( \newcommand{\norm}[1]{\| #1 \|}\)
\( \newcommand{\inner}[2]{\langle #1, #2 \rangle}\)
\( \newcommand{\Span}{\mathrm{span}}\) \( \newcommand{\AA}{\unicode[.8,0]{x212B}}\)
\( \newcommand{\vectorA}[1]{\vec{#1}} % arrow\)
\( \newcommand{\vectorAt}[1]{\vec{\text{#1}}} % arrow\)
\( \newcommand{\vectorB}[1]{\overset { \scriptstyle \rightharpoonup} {\mathbf{#1}} } \)
\( \newcommand{\vectorC}[1]{\textbf{#1}} \)
\( \newcommand{\vectorD}[1]{\overrightarrow{#1}} \)
\( \newcommand{\vectorDt}[1]{\overrightarrow{\text{#1}}} \)
\( \newcommand{\vectE}[1]{\overset{-\!-\!\rightharpoonup}{\vphantom{a}\smash{\mathbf {#1}}}} \)
\( \newcommand{\vecs}[1]{\overset { \scriptstyle \rightharpoonup} {\mathbf{#1}} } \)
\(\newcommand{\longvect}{\overrightarrow}\)
\( \newcommand{\vecd}[1]{\overset{-\!-\!\rightharpoonup}{\vphantom{a}\smash {#1}}} \)
\(\newcommand{\avec}{\mathbf a}\) \(\newcommand{\bvec}{\mathbf b}\) \(\newcommand{\cvec}{\mathbf c}\) \(\newcommand{\dvec}{\mathbf d}\) \(\newcommand{\dtil}{\widetilde{\mathbf d}}\) \(\newcommand{\evec}{\mathbf e}\) \(\newcommand{\fvec}{\mathbf f}\) \(\newcommand{\nvec}{\mathbf n}\) \(\newcommand{\pvec}{\mathbf p}\) \(\newcommand{\qvec}{\mathbf q}\) \(\newcommand{\svec}{\mathbf s}\) \(\newcommand{\tvec}{\mathbf t}\) \(\newcommand{\uvec}{\mathbf u}\) \(\newcommand{\vvec}{\mathbf v}\) \(\newcommand{\wvec}{\mathbf w}\) \(\newcommand{\xvec}{\mathbf x}\) \(\newcommand{\yvec}{\mathbf y}\) \(\newcommand{\zvec}{\mathbf z}\) \(\newcommand{\rvec}{\mathbf r}\) \(\newcommand{\mvec}{\mathbf m}\) \(\newcommand{\zerovec}{\mathbf 0}\) \(\newcommand{\onevec}{\mathbf 1}\) \(\newcommand{\real}{\mathbb R}\) \(\newcommand{\twovec}[2]{\left[\begin{array}{r}#1 \\ #2 \end{array}\right]}\) \(\newcommand{\ctwovec}[2]{\left[\begin{array}{c}#1 \\ #2 \end{array}\right]}\) \(\newcommand{\threevec}[3]{\left[\begin{array}{r}#1 \\ #2 \\ #3 \end{array}\right]}\) \(\newcommand{\cthreevec}[3]{\left[\begin{array}{c}#1 \\ #2 \\ #3 \end{array}\right]}\) \(\newcommand{\fourvec}[4]{\left[\begin{array}{r}#1 \\ #2 \\ #3 \\ #4 \end{array}\right]}\) \(\newcommand{\cfourvec}[4]{\left[\begin{array}{c}#1 \\ #2 \\ #3 \\ #4 \end{array}\right]}\) \(\newcommand{\fivevec}[5]{\left[\begin{array}{r}#1 \\ #2 \\ #3 \\ #4 \\ #5 \\ \end{array}\right]}\) \(\newcommand{\cfivevec}[5]{\left[\begin{array}{c}#1 \\ #2 \\ #3 \\ #4 \\ #5 \\ \end{array}\right]}\) \(\newcommand{\mattwo}[4]{\left[\begin{array}{rr}#1 \amp #2 \\ #3 \amp #4 \\ \end{array}\right]}\) \(\newcommand{\laspan}[1]{\text{Span}\{#1\}}\) \(\newcommand{\bcal}{\cal B}\) \(\newcommand{\ccal}{\cal C}\) \(\newcommand{\scal}{\cal S}\) \(\newcommand{\wcal}{\cal W}\) \(\newcommand{\ecal}{\cal E}\) \(\newcommand{\coords}[2]{\left\{#1\right\}_{#2}}\) \(\newcommand{\gray}[1]{\color{gray}{#1}}\) \(\newcommand{\lgray}[1]{\color{lightgray}{#1}}\) \(\newcommand{\rank}{\operatorname{rank}}\) \(\newcommand{\row}{\text{Row}}\) \(\newcommand{\col}{\text{Col}}\) \(\renewcommand{\row}{\text{Row}}\) \(\newcommand{\nul}{\text{Nul}}\) \(\newcommand{\var}{\text{Var}}\) \(\newcommand{\corr}{\text{corr}}\) \(\newcommand{\len}[1]{\left|#1\right|}\) \(\newcommand{\bbar}{\overline{\bvec}}\) \(\newcommand{\bhat}{\widehat{\bvec}}\) \(\newcommand{\bperp}{\bvec^\perp}\) \(\newcommand{\xhat}{\widehat{\xvec}}\) \(\newcommand{\vhat}{\widehat{\vvec}}\) \(\newcommand{\uhat}{\widehat{\uvec}}\) \(\newcommand{\what}{\widehat{\wvec}}\) \(\newcommand{\Sighat}{\widehat{\Sigma}}\) \(\newcommand{\lt}{<}\) \(\newcommand{\gt}{>}\) \(\newcommand{\amp}{&}\) \(\definecolor{fillinmathshade}{gray}{0.9}\)Learning Objectives
Goals:
- Identify the main features on the spectrophotometer and define their functions.
- Use a spectrophotometer to obtain an absorbance spectrum.
Student Learning Outcomes:
Upon completion of this lab, students will be able to:- Identify the parts of a spectrophotometer and their related functions.
- “Blank” a spectrophotometer.
- Obtain an absorbance spectrum for a molecule.
- Use the wavelength absorption scans to determine the dyes in colored skittles.
Introduction
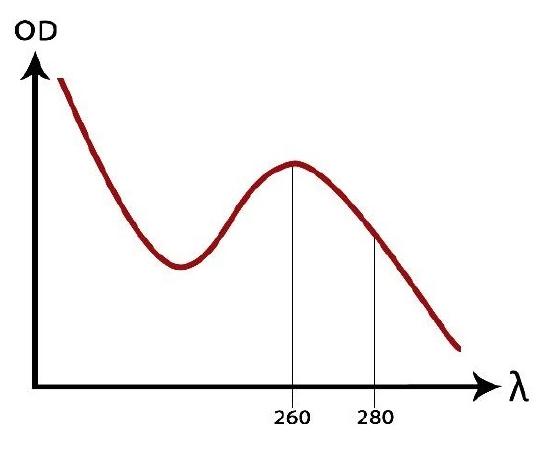
Spectrophotometers are one of the most frequently used tools by scientists to determine both the presence and concentration of dissolved chemicals. As radiant energy (visible light) strikes matter, molecules will absorb certain wavelengths of light and transmit or reflect others based on the nature of their chemical bonds. For example, proteins and nucleic acids absorb wavelengths in the visible light range of 240-300 nanometers (nm), pigments and dyes absorb light in the 400-770-nm range, and other organic molecules absorb wavelengths above 770-nm. Each chemical has a distinctive atomic arrangement and bonding pattern, and thus absorbs or transmits different wavelengths of visible light in a pattern that is unique for that chemical. This unique pattern of light absorption and transmittance creates a “fingerprint” for that chemical. In this exercise you will determine the unique “fingerprint” for a colored molecule and use a spectrophotometer to measure the concentration of a chemical in a given sample.
Spectrophotometers are instruments designed to detect the amount of light energy that is absorbed or transmitted by molecules dissolved in a solution. Since molecules have wavelengths unique to their structure, different chemicals and their concentrations can be identified based on their absorbance or transmittance.
A spectrophotometer is an instrument used for detecting the presence of any light-absorbing particles dissolved in a solution and for measuring the concentration of those particles. A light source inside the spectrophotometer emits a full spectrum of white light towards a compartment where a sample liquid is placed. The samples are prepared in cuvettes that are made using specialized plastics or quartz so that they do not absorb any light and will not affect our measurements. Before the light passes through the sample in the cuvette, an adjustable prism and diffraction grating filters the light so that only a single wavelength of light can be selected and allowed to pass through the sample. All molecules differ in how strongly they absorb each wavelength of light in the visible spectrum because of differences in their molecular structure and composition. This allows us to use a specific wavelength of light to detect the presence of, and quantify, one molecular compound in a simple or complex liquid mixture. Spectrophotometers are also calibrated by using a “blank” solution that we prepare containing all of the components of the solution to be analyzed except for the one compound we are testing for so that the instrument can zero out these background readings and only report values for the compound of interest.
Light passing through a sample solution will partially be absorbed by molecules present in the sample. The amount of light unable to pass through a sample is measured as the absorbance value. Absorbance is directly proportional to the concentration of the molecules and is measured on a logarithmic scale from 0 to infinity. The amount of light that is not absorbed is transmitted or passed through the sample. Compared to the amount of light entering the sample, the amount that exits is measured as a percentage of the light transmitted. Percent transmittance is inversely proportional to the concentration of the molecules in the sample and is measured on a linear scale from 0% to 100%.
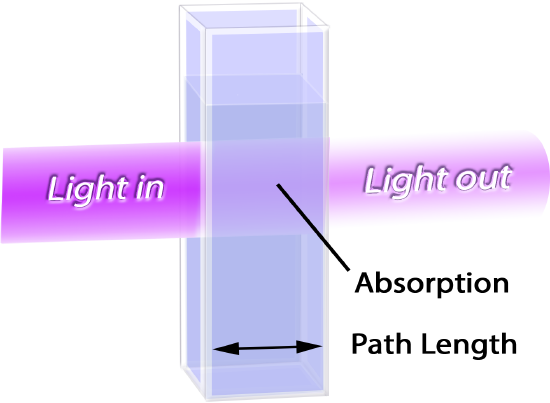
A photodetector on the other side of the sample compartment converts the intensity of the light it receives into an electrical signal. The instrument can then calculate and display the absorbance and % transmittance values by measuring the difference between the intensity of light of the selected wavelength entering and exiting the sample.
The absorbance scale reflects the measurement of the amount of light absorbed and converted into absorbance (\(A\)) units by the spectrophotometer. Absorbance units are calculated by using the following equation:
\[\text{Absorbance} (A) = \log_{10} \left(\dfrac{1}{T}\right) \nonumber\]
where “\(T\)” is the decimal form of “\(\%T\)”
\[T = \dfrac{\%T}{100} \nonumber\]
If a solution containing a given dye is found to transmit 10% of the light when placed in a spectrophotometer, its absorbance then would be calculated as follows:
Transmittance (T) = 10% = 10%/100 = 0.10
Absorbance (A) = log10 (1 / 0.10) = 1.0
Part I: Identifying Food Dyes in Candies
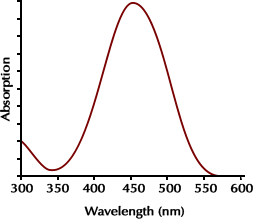
Many foods, drugs and cosmetics are artificially colored with federally approved food dyes (FD & C dyes). These dyes include Red 40, Red 3, Yellow 5, Yellow 6, Blue 1, and Blue 2. Since each dye has an identifiable absorption spectrum and peak, a spectrophotometer may be used to identify the types of FD & C dye used in a product.
Pigments may be extracted from foods and drinks that contain one or more of these dyes. An absorption spectrum of that extract can then determine what dyes are in that food or drink by comparing the peaks of maximum absorbance with information in the table below. If the absorption spectrum of a food extract has a peak at 630 nm and one at 428 nm, you can assume the food contains both Blue #1 and Yellow #5. The following table gives the wavelength of peak absorbance for each of these dyes.
| FD & C Dye | Name | Wavelength (nm) of Maximum Absorbance |
|---|---|---|
| Blue #1 | Brilliant Blue FCF | 630 |
| Green #3 | Solid Green FCF | 625 |
| Blue #2 | Indigo Carmine | 610 |
| Red #3 | Erythrosine | 527 |
| Red #40 | Allura Red AC | 502 |
| Yellow #6 | Sunset Yellow FCF | 484 |
| Yellow #5 | Tartrazine | 428 |
Materials
- Spectrophotometer
- Cuvette
- Skittles
- KimWipes
- Test tubes
Procedure
A. Extracting Dye from Candy (Your Instructor will do this for you)
You will need one test tube and one cuvette for each color to be tested. Measure 4 mL water into one tube. Place 2-4 candies of the same color in a test tube with the water. Gently swirl, and wait one minute. After, pour approximately 1 mL of liquid into a microcentrifuge tube. Spin the microcentrifuge tube at max speed for 60 seconds. Make sure the centrifuge is balanced before spinning. Transfer the clear liquid (supernatant) into a cuvette. Make sure to leave behind the particulates (pellet).
B. Measuring Absorbance with Spectrophotometer
- Turn on the spectrophotometer. Let it warm up for 15 minutes.
- Select wavelength scan.
- Fill a cuvette 2/3 full with DI water to serve as the “BLANK” cuvette.
- Calibrate the Spectrometer
-
- Wipe the outside of the BLANK cuvette with a KimWipe
- Place cuvette into the machine so that the clear portions of the cuvette are oriented left to right. (The light needs to pass through clear area on cuvette).
- Press "Zero"
- Remove the blank.
- Determine optimum wavelength absorbance and set up data collection mode.
-
- Place a cuvette with a sample into the spectrophotometer
- Press "read"
- Set cursor mode to peak and valley under "Options" > "More" > "Cursor Mode"
- Press the left and right arrows to the right of the graph to select the highest peak.
- Record the wavelength and absorbance in Table 6.2.
- Decide which dyes were used to make each color. Enter the Wavelength of that dye in the last column of table 6.2. Explain your reasoning for each choice in your lab notebook.
Results
|
Color skittle |
Maximum Absorbance |
Wavelength (nm) at Maximum Absorption |
Proposed Dye |
Wavelength (nm) of Maximum Absorption for Proposed Dye |
|---|---|---|---|---|
|
Red |
||||
|
Orange |
||||
|
Yellow |
||||
|
Green |
||||
|
Purple |
Instructions for Cleaning Cuvettes
- Discard solutions to sink
- Rinse with tap water once
- Rinse with DI water two times
- Place in tube rack, allow to air dry
Study Questions
- Name the parts of the spectrophotometer and identify their function.
- What is the difference between % transmittance and absorbance?
- How did you determine which wavelength was absorbed at the highest level? How is this process useful in determining the identity of a molecule?
- How do you clean a cuvette?