
19.1: Electron-Transfer Reactions in Mitochondria
- Page ID
- 15039


\( \newcommand{\vecs}[1]{\overset { \scriptstyle \rightharpoonup} {\mathbf{#1}} } \)
\( \newcommand{\vecd}[1]{\overset{-\!-\!\rightharpoonup}{\vphantom{a}\smash {#1}}} \)
\( \newcommand{\dsum}{\displaystyle\sum\limits} \)
\( \newcommand{\dint}{\displaystyle\int\limits} \)
\( \newcommand{\dlim}{\displaystyle\lim\limits} \)
\( \newcommand{\id}{\mathrm{id}}\) \( \newcommand{\Span}{\mathrm{span}}\)
( \newcommand{\kernel}{\mathrm{null}\,}\) \( \newcommand{\range}{\mathrm{range}\,}\)
\( \newcommand{\RealPart}{\mathrm{Re}}\) \( \newcommand{\ImaginaryPart}{\mathrm{Im}}\)
\( \newcommand{\Argument}{\mathrm{Arg}}\) \( \newcommand{\norm}[1]{\| #1 \|}\)
\( \newcommand{\inner}[2]{\langle #1, #2 \rangle}\)
\( \newcommand{\Span}{\mathrm{span}}\)
\( \newcommand{\id}{\mathrm{id}}\)
\( \newcommand{\Span}{\mathrm{span}}\)
\( \newcommand{\kernel}{\mathrm{null}\,}\)
\( \newcommand{\range}{\mathrm{range}\,}\)
\( \newcommand{\RealPart}{\mathrm{Re}}\)
\( \newcommand{\ImaginaryPart}{\mathrm{Im}}\)
\( \newcommand{\Argument}{\mathrm{Arg}}\)
\( \newcommand{\norm}[1]{\| #1 \|}\)
\( \newcommand{\inner}[2]{\langle #1, #2 \rangle}\)
\( \newcommand{\Span}{\mathrm{span}}\) \( \newcommand{\AA}{\unicode[.8,0]{x212B}}\)
\( \newcommand{\vectorA}[1]{\vec{#1}} % arrow\)
\( \newcommand{\vectorAt}[1]{\vec{\text{#1}}} % arrow\)
\( \newcommand{\vectorB}[1]{\overset { \scriptstyle \rightharpoonup} {\mathbf{#1}} } \)
\( \newcommand{\vectorC}[1]{\textbf{#1}} \)
\( \newcommand{\vectorD}[1]{\overrightarrow{#1}} \)
\( \newcommand{\vectorDt}[1]{\overrightarrow{\text{#1}}} \)
\( \newcommand{\vectE}[1]{\overset{-\!-\!\rightharpoonup}{\vphantom{a}\smash{\mathbf {#1}}}} \)
\( \newcommand{\vecs}[1]{\overset { \scriptstyle \rightharpoonup} {\mathbf{#1}} } \)
\(\newcommand{\longvect}{\overrightarrow}\)
\( \newcommand{\vecd}[1]{\overset{-\!-\!\rightharpoonup}{\vphantom{a}\smash {#1}}} \)
\(\newcommand{\avec}{\mathbf a}\) \(\newcommand{\bvec}{\mathbf b}\) \(\newcommand{\cvec}{\mathbf c}\) \(\newcommand{\dvec}{\mathbf d}\) \(\newcommand{\dtil}{\widetilde{\mathbf d}}\) \(\newcommand{\evec}{\mathbf e}\) \(\newcommand{\fvec}{\mathbf f}\) \(\newcommand{\nvec}{\mathbf n}\) \(\newcommand{\pvec}{\mathbf p}\) \(\newcommand{\qvec}{\mathbf q}\) \(\newcommand{\svec}{\mathbf s}\) \(\newcommand{\tvec}{\mathbf t}\) \(\newcommand{\uvec}{\mathbf u}\) \(\newcommand{\vvec}{\mathbf v}\) \(\newcommand{\wvec}{\mathbf w}\) \(\newcommand{\xvec}{\mathbf x}\) \(\newcommand{\yvec}{\mathbf y}\) \(\newcommand{\zvec}{\mathbf z}\) \(\newcommand{\rvec}{\mathbf r}\) \(\newcommand{\mvec}{\mathbf m}\) \(\newcommand{\zerovec}{\mathbf 0}\) \(\newcommand{\onevec}{\mathbf 1}\) \(\newcommand{\real}{\mathbb R}\) \(\newcommand{\twovec}[2]{\left[\begin{array}{r}#1 \\ #2 \end{array}\right]}\) \(\newcommand{\ctwovec}[2]{\left[\begin{array}{c}#1 \\ #2 \end{array}\right]}\) \(\newcommand{\threevec}[3]{\left[\begin{array}{r}#1 \\ #2 \\ #3 \end{array}\right]}\) \(\newcommand{\cthreevec}[3]{\left[\begin{array}{c}#1 \\ #2 \\ #3 \end{array}\right]}\) \(\newcommand{\fourvec}[4]{\left[\begin{array}{r}#1 \\ #2 \\ #3 \\ #4 \end{array}\right]}\) \(\newcommand{\cfourvec}[4]{\left[\begin{array}{c}#1 \\ #2 \\ #3 \\ #4 \end{array}\right]}\) \(\newcommand{\fivevec}[5]{\left[\begin{array}{r}#1 \\ #2 \\ #3 \\ #4 \\ #5 \\ \end{array}\right]}\) \(\newcommand{\cfivevec}[5]{\left[\begin{array}{c}#1 \\ #2 \\ #3 \\ #4 \\ #5 \\ \end{array}\right]}\) \(\newcommand{\mattwo}[4]{\left[\begin{array}{rr}#1 \amp #2 \\ #3 \amp #4 \\ \end{array}\right]}\) \(\newcommand{\laspan}[1]{\text{Span}\{#1\}}\) \(\newcommand{\bcal}{\cal B}\) \(\newcommand{\ccal}{\cal C}\) \(\newcommand{\scal}{\cal S}\) \(\newcommand{\wcal}{\cal W}\) \(\newcommand{\ecal}{\cal E}\) \(\newcommand{\coords}[2]{\left\{#1\right\}_{#2}}\) \(\newcommand{\gray}[1]{\color{gray}{#1}}\) \(\newcommand{\lgray}[1]{\color{lightgray}{#1}}\) \(\newcommand{\rank}{\operatorname{rank}}\) \(\newcommand{\row}{\text{Row}}\) \(\newcommand{\col}{\text{Col}}\) \(\renewcommand{\row}{\text{Row}}\) \(\newcommand{\nul}{\text{Nul}}\) \(\newcommand{\var}{\text{Var}}\) \(\newcommand{\corr}{\text{corr}}\) \(\newcommand{\len}[1]{\left|#1\right|}\) \(\newcommand{\bbar}{\overline{\bvec}}\) \(\newcommand{\bhat}{\widehat{\bvec}}\) \(\newcommand{\bperp}{\bvec^\perp}\) \(\newcommand{\xhat}{\widehat{\xvec}}\) \(\newcommand{\vhat}{\widehat{\vvec}}\) \(\newcommand{\uhat}{\widehat{\uvec}}\) \(\newcommand{\what}{\widehat{\wvec}}\) \(\newcommand{\Sighat}{\widehat{\Sigma}}\) \(\newcommand{\lt}{<}\) \(\newcommand{\gt}{>}\) \(\newcommand{\amp}{&}\) \(\definecolor{fillinmathshade}{gray}{0.9}\)Search Fundamentals of Biochemistry
-
Describe the Role of NADH and FADH2:
• Explain how these reducing agents, generated in the citric acid cycle, donate electrons to the electron transport chain.
• Differentiate between the roles of NADH and FADH2 in electron transport under aerobic conditions. -
Understand the Overall Process of Electron Transport and Oxidative Phosphorylation:
• Summarize how electrons flow from NADH and FADH2 through a series of membrane-bound complexes to dioxygen, forming water.
• Explain how the energy from electron transfer is used to pump protons across the mitochondrial inner membrane, establishing a proton gradient that drives ATP synthesis via ATP synthase (Complex V). -
Detail the Structure and Function of Each Mitochondrial Complex:
• Identify and describe the key features and functions of Complexes I, II, III, and IV.
• Discuss the role of mobile electron carriers—ubiquinone (UQ) and cytochrome C—in shuttling electrons between complexes. -
Explain the Mechanisms of Electron Transfer:
• Describe the sequence of redox reactions in Complex I, including the roles of FMN and iron–sulfur (FeS) clusters.
• Outline the Q cycle in Complex III and the importance of its dual electron pathways. -
Analyze Proton Pumping and Its Coupling to Electron Transfer:
• Explain how electron flow through Complexes I, III, and IV is coupled with proton translocation to generate the electrochemical gradient across the inner mitochondrial membrane.
• Discuss the structural features (e.g., antiporter-like domains, water channels, and conformational changes) that facilitate proton movement. -
Evaluate Redox Potentials and Their Influence on Electron Flow:
• Understand how the standard reduction potentials (E₀ values) of various electron carriers drive the directionality of electron transfer.
• Relate changes in the redox environment to the formation of reactive oxygen species (ROS). -
Examine the Impact of Inhibitors and ROS Formation:
• Identify common inhibitors of Complex I (e.g., rotenone, piericidin A) and describe their effects on electron transport and ROS production.
• Explain how disruptions in electron flow can lead to increased ROS, potentially resulting in cellular damage. -
Discuss the Concept and Significance of Supercomplexes:
• Describe how the organization of complexes into supercomplexes (respirasomes) optimizes electron transfer and minimizes electron leak that can form ROS. -
Integrate Mitochondrial Electron Transport with Cellular Metabolism:
• Explain how the mitochondrial electron transport chain links to broader metabolic pathways (e.g., the citric acid cycle) to support cellular energy production.
• Discuss the physiological importance of maintaining efficient electron transport and proton gradients in aerobic metabolism.
These goals aim to provide students with a deep, integrative understanding of mitochondrial electron transport, from the molecular details of each complex to the overall coupling of electron flow and ATP synthesis in cellular respiration.
An Overview of Mitochondrial Electron Transport
The primary oxidizing agent utilized during aerobic metabolism in the citric acid cycle is NAD+ (although FAD is employed in one step). In the process, these oxidizing agents get reduced to form NADH (and FADH2). Unless NAD+ is regenerated, glycolysis and the citric acid cycle will halt. This occurs under anaerobic conditions when NADH formed in glycolysis is reoxidized to NAD+ by pyruvate, which is converted to lactate.
Under aerobic conditions, we continually breathe one of the best oxidizing agents, dioxygen. NADH is oxidized back to NAD+ not directly by dioxygen, but indirectly as electrons flow from NADH through a series of electron carriers to dioxygen, which is then reduced to water. This process is called electron transport. No atoms of oxygen are incorporated into NADH or any intermediary electron carrier. Hence, the enzyme involved in the terminal electron transport step, in which electrons pass to dioxygen, is an oxidase. The citric acid cycle enzymes and electron transport are localized in mitochondria, which is shown in Figure \(\PageIndex{1}\).
-en.svg?revision=2&size=bestfit&width=699&height=613)
By analogy to the coupling mechanism under anaerobic conditions, it would be useful from a biological perspective if this electron transport from NADH to dioxygen, a thermodynamically favorable reaction (ΔG of about -55 kcal/mol, -230 kJ/mol), were coupled to ATP synthesis. It is! For years, scientists tried to find a molecule with "high energy" (with respect to its hydrolysis product) phosphorylated intermediate similar to 1,3-bisphosphoglycerate (formed by glyceraldehyde-3-phosphate dehydrogenase in glycolysis), which could drive ATP synthesis in the mitochondria. (Remember, there is no such thing as a "high energy" bond.) None could be found. Peter Mitchell put forward a startling hypothesis, which was proven correct, and he was awarded the Nobel Prize in Chemistry in 1978. The immediate source of energy to drive ATP synthesis was shown to come not from a phosphorylated intermediate but from a proton gradient across the mitochondrial inner membrane. All the enzyme complexes in electron transport are localized in the inner membrane of the mitochondria, as opposed to the cytoplasmic enzymes of glycolysis. A pH gradient is formed across the inner membrane in respiring mitochondria. In electron transport, electrons are passed from mobile electron carriers through membrane complexes back to another mobile carrier.
Four inner mitochondrial membrane complexes are involved in the flow of electrons to dioxygen. The first, Complex I, transfers two electrons from NADH to a flavin derivative, FMN, covalently attached to Complex I. The oxidation of NADH occurs, as expected, by hydride transfer. The reduced form of FMN then passes electrons in single electron steps (characteristic of FAD-like molecules, which can undergo 1 or 2 electron transfers) through the complex to the lipophilic electron carrier, ubiquinone, UQ, as shown in Figure \(\PageIndex{2}\).

This then passes electrons through Complex III to another mobile electron carrier, a small protein, cytochrome C. This protein has a covalently attached heme with a central iron ion that can undergo one-electron redox reactions (Fe3+ + 1e- ↔ Fe2+). Reduce cytochrome C (Fe2+), which passes electrons through Complex IV, cytochrome C oxidase, to dioxygen to form water. At each step, electrons are passed to stronger oxidizing agents, as indicated by their increasing positive standard reduction potentials. Hence, the oxidation at each complex is thermodynamically favored. Four electrons must be added to dioxygen and four H+ ions to form water.
\[\ce{O_2 + 4e^{-} + 4H^{+} → 2H_2O}. \nonumber \]
What happened to Complex II? Complex II (also called succinate:quinone oxidoreductase) contains the citric cycle enzyme succinate dehydrogenase, which catalyzes the oxidation of succinate to fumarate by FAD. The bound FADH2 does not dissociate from the enzyme, which is functionally dead for further formation of fumarate until it is oxidized back to FAD by additional components of Complex II. In this process, electrons from FADH2 are passed to the same lipophilic mobile electron carrier from Complex I, ubiquinone. Reduced ubiquinone can then transfer electrons to cytochrome C through Complex III.
For Complex I, III, and IV, the energy released by the oxidative event is used to drive protons from the matrix to the intermembrane space of the mitochondria. The oxidative energy released is not used to form a "high-energy" mixed anhydride, as seen in the glyceraldehyde-3-phosphate dehydrogenase reaction from glycolysis. The resulting proton gradient collapses in a thermodynamically favorable process that energetically drives the endergonic synthesis of ATP by the last inner membrane complex, ATP synthase, which is sometimes called Complex V. This aerobic coupling of electron transfer (from NADH to dioxygen) and ATP synthesis is shown schematically in Figure \(\PageIndex{3}\). Electron transfer is often referred to as electron transport, which might suggest that it requires energy, as is the case with active transport. However, it does not, since it is strongly favored thermodynamically with dioxygen as the final electron acceptor.

You may wish to question the need for such a complicated series of reactions to move the simple electron from one chemical species to another, and a simple H+ from one side of a membrane to another to form a proton gradient that collapses anyway. The movers of these species are aligned in the membrane to optimize the processes and allow the vectorial, nonrandom flow of electrons and protons. This is what evolution has produced. One reason must be to maintain optimal control over the efficiency of the coupled reaction. Another powerful explanation is to reduce dangerous side reactions. In redox chemistry, this process involves the formation of highly reactive free radicals that can react quickly and uncontrollably with any nearby species. This is especially true when dioxygen is involved (see Chapter 13.4 - The Chemistry and Biology of Dioxygen). It takes 4 electrons to reduce dioxygen to water. If this process is interrupted, highly reactive oxygen species (ROS), such as superoxide and peroxide, can form, damaging membranes, proteins, and nucleic acids.
Before we explore each complex in more detail, let's get a lower-resolution view of the entire mitochondrial electron transport and ATP synthesis (often called oxidative phosphorylation or ox-phos), which is shown in cartoon form in Figure \(\PageIndex{4}\).
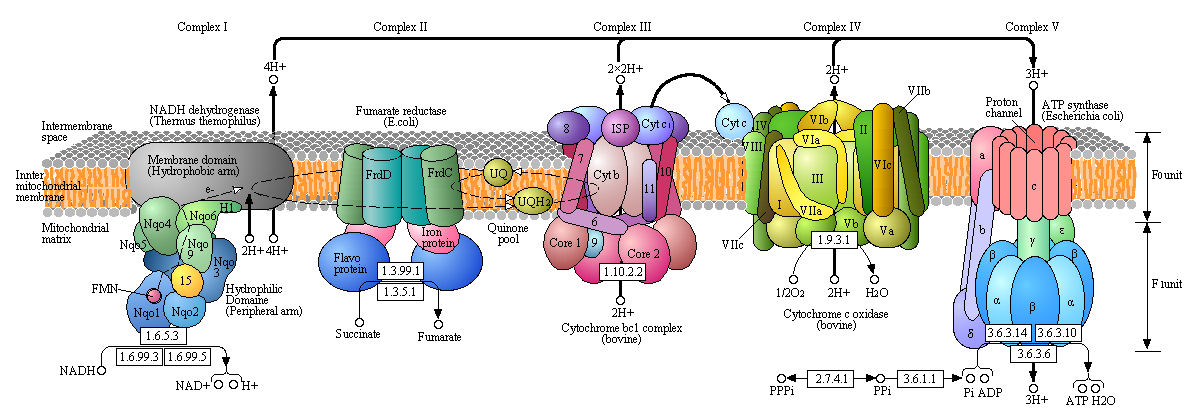
Especially note:
- the subunit complexity of each Complex;
- the location of the subunits (many integral membrane proteins, others more hydrophilic and located in the polar matrix);
- the mobile electron carriers NADH/NAD+, lipophilic UQH2/UQ used for both complex I and II, cytochrome C (a protein), and O2;
- the number of H+s moved from the matrix to the intermembrane space through Complexes I, III, and IV and back through ATP synthase.
Also note that the prokaryotic structures are displayed, even though they are placed within the mitochondrial membrane. Bacteria do not have organelles like mitochondria, but have the same complexes inserted into their plasma membranes. For bacteria, protons are ejected into the periplasmic space, which lies between the plasma membrane and the cell wall.
Diagrams like the one shown in Figure \(\PageIndex{4}\) are useful in simplifying complex biological systems. At the same time, they constrain our ideas about how, in this case, the individual complexes are arranged in the membrane. Much evidence suggests that Complex I, III, and IV (those that pump protons) form a large supercomplex called the respirasome, which has approximately 80 subunits in mammals. Clustering the subunits in a supercomplex increases the likelihood that shared mobile electron carriers will not diffuse away but continue passing electrons along the electron transport chain. As mentioned, some reactions generate reactive oxygen species, which must be kept in the complex to avoid their toxic effects. The stability of the individual complexes is also likely to be increased in the larger aggregate.
Using cryoelectron microscopy (cryoEM), the structures of two large super- and megacomplexes have been solved, revealing the arrangement of all the respiratory complexes. Two different structures showing the SuperComplex-I1III2IV1 (SCI1III2IV1) and MegaComplex-I2III2IV2 (MCI2III2IV2) are shown below in Figure \(\PageIndex{5}\).

Panel (A) shows human SCI1III2IV1 (PDB ID: 5XTH) in side view (along the inner membrane) and a top-down view. Note that CI is adjacent to CIII (located in the center), which is adjacent to CIV. This is the expected orientation, given the flow of electrons from NADH to dioxygen. In panel (B), substrates and products are included in the side view, along with the flow of H+ (from all of the complexes) into the matrix. Panel C shows the added cofactors (FeS clusters, FMN, hemes, etc). Panel (D) shows a beautiful top-down view of the human megacomplex, which has two copies of each subunit. Again, note the centrality of Complex III.
Figure \(\PageIndex{6a}\) shows another model of the megacomplex with Complex II (CII, which does not translocate protons across the membrane) added. It also shows a tetramer of Complex V (ATP synthase)

Recently, Cryo-electron tomography and electron microscopy were used to determine the structures of the respirasome supercomplex in Chlamydomonas reinhardtii (green algae). A model (similar but different from the one shown in Figure 6a) was constructed, which is shown in Figure \(\PageIndex{6b}\) below.

Figure \(\PageIndex{6b}\): Schematic side view of a crista in Chlamydomonas reinhardtii. From Florent Waltz et al. In-cell architecture of the mitochondrial respiratory chain. Science 387,1296-1301(2025).DOI:10.1126/science.ads8738. Reprinted with permission from AAAS.
IM (transparent gray); Blue, complex I; green; complex III; red-orange/yellow/light yellow, complex IV monomers, respectively. Cytochrome C is depicted as a labeled, reddish circle labeled 'c'.
Complexes I, III, and IV assemble in the flat membrane region of mitochondrial cristae. At the same time, multiple copies of ATP synthase (also called Complex V) are found in the curved membrane connecting the two flat cristae inner membranes. ATP synthase likely induces the curvature of the cristae membrane.
Cytochrome C is a substrate/product of complexes III and IV (see Figure 4 above). Given the membranes and complexes' spacing, cytochrome C likely diffuses freely between copies of supercomplexes of I, III, and IV instead of channeling between multiple complexes in a faster than 3D diffusional search for its binding sites. No free complex I and III were observed, suggesting they are in supercomplexes (i.e., respirasomes). Hence, the respirasomes appear to create the geometry of the cristae and membranes, with the small spacing (150 Å) between the inner membranes facilitating proton flux to the curved membrane occupied by ATP synthase for efficient respiration.
Now, let's explore each complex in more detail.
Complex I - NADH-quinone oxidoreductase
Complex I is located in the inner mitochondrial membrane in eukaryotes and the plasma membrane of bacteria. Bacteria have only 14 subunits, while the mammalian Complex I has 45, including the core 14 found in bacteria. Another 31 are termed supernumerary (in excess of the "normal number") subunits that support the function of the core. The significance of the extra mammalian subunits is still unclear. A cartoon model with the actual crystal structure of the Thermus thermophilus (bacterial) complex is shown in Figure \(\PageIndex{7}\). The hydrophilic or peripheral domain catalyzes electron transfer, while the membrane domain (encoded by mitochondrial DNA) is involved in the active transport of protons. It is one of the biggest "enzymes" around, making it exciting to try and understand!

Figure \(\PageIndex{8}\) shows an interactive iCn3D model of the mammalian respiratory complex I (5LDW)
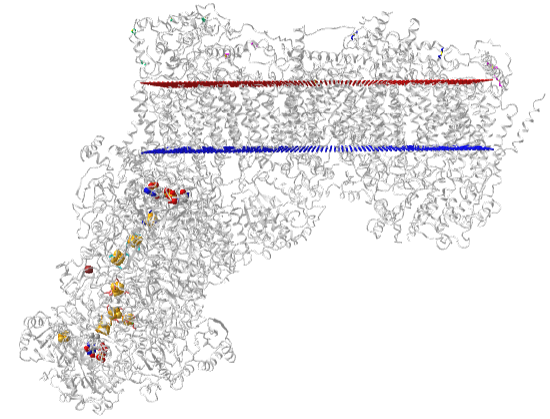
 Figure \(\PageIndex{8}\): Mammalian respiratory complex I (5LDW). (Copyright; author via source).
Click the image for a popup or use this external link: https://structure.ncbi.nlm.nih.gov/i...xVjRPLLgaLCi17 (both load slowly given the size of the structures). For the external link, use the mouse scroll to zoom the structure to see the labeled FeS clusters and FMN.
The red and blue parallel "dummy" atoms represent the boundary of the mitochondrial inner membrane.
Electron Transfer in Complex I
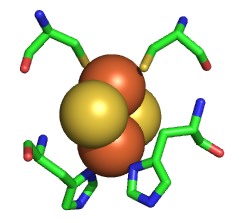
Electron flow occurs from NADH to UQ through a series of one-electron carriers in the hydrophilic or peripheral domain of Complex I. The initial handoff of electrons occurs to a flavin cofactor, FMN, and then through a series of Fe/S clusters to ubiquinone. These electron acceptors include tetranuclear (Fe4S4) and binuclear (Fe2S2) iron-sulfur clusters, a FMN flavin mononucleotide, and a Mn (II) ion. These are shown in Figure \(\PageIndex{9}\).

The tetranuclear Fe4S4 cluster is based on the cubane structure with Fe and S occupying alternating corners of a square in a tetrahedral geometry. Each Fe is also coordinated to thiolate (RS-) groups from coordinating cysteines, as well as sulfide (S2-) anions. The actual structure is a distorted cube, as shown in Figure \(\PageIndex{10}\), along with that of the binuclear Fe2S2 cluster, whose bond angles also deviate from those in a perfect tetrahedron.

Many micro-redox states with different standard reduction potentials are possible for tetranuclear Fe4S4 clusters, much as polyprotic acids have multiple pKa values. The two relevant to the tetranuclear clusters in Complex I are shown below:
a. Fe(II)Fe(III)3/S2(CysS)21- + e- ↔ Fe(II)2Fe(III)2/S2(CysS)22- (less positive standard reduction potential)
b. Fe(II)2Fe(III)2/S2(CysS)22- + e- ↔ Fe(II)3Fe(III)/S2(CysS)23- (more positive standard reduction potential)
You have studied Bronsted acids in many courses and are familiar with the factors that affect the pKa of structurally similar acids. These include the initial charge on a potential proton donor. The relative strength of a series of structurally similar acids can be predicted by examining the factors that stabilize the negative charge on the resulting conjugate base. The more stable the conjugate base, the more acidic the parent acid. Factors that stabilize a negative conjugate base are the electronegativity of the atom holding the negative charge, resonance, which might delocalize the charge, the inductive/electron release effect of substituents, and the hybridization of the atom holding the charge (sp anions are more stable due to more s character with electrons pulled more closely to the nucleus).
What about a single acid? The pKa of a given acid is a constant for a given set of conditions (temperature, solvent polarity, etc), but it can be altered by changing conditions. The diagram below in Figure \(\PageIndex{11}\) shows ways to "tip" the pKa of a given acid (in this case, a simple carboxylic acid) to a lower value, making the acid stronger in the new set of conditions.

The same ideas apply to the strength of a potential oxidizing agent (electron acceptor) as described by the E0 value (higher for stronger oxidizing agents/electron acceptors). Figure \(\PageIndex{12}\) shows the factors that could alter the E0 value for a binuclear FeS cluster. In this case, changes in coordinating ligands, analogous to changes in substituents for an acid) are included since most students have probably spent more time thinking about pKa values than E0 values.

In both acid/base and oxidizing agent/reducing agent cases, the balance of the reactions can be understood through Le Chatelier's principle. The chemical equilibrium can be shifted to the right (deprotonating) for a stronger acid with a lower pKa, or (accepting an electron) for a strong oxidizing agent with a higher E0. In both cases, this is achieved by preferentially stabilizing products over the initial reactants.
Electrons are passed singly to oxidized UQ in one-electron steps to form UQH2.
Fe-S clusters are synthesized predominantly in the mitochondria, serving as redox cofactors in electron transport, as described above. They are ubiquitous in all life forms and serve additional roles beyond being redox cofactors. They serve structural roles in proteins and are utilized in redox signaling within the cell, as they change oxidation states. Many proteins interacting with DNA (repair enzymes, polymerases, and helicases) contain an FeS cluster.
Evidence suggests that they played critical roles in the abiotic evolution of life, where oxygen was absent as a terminal electron acceptor in exergonic oxidation reactions. When oxygen became more readily available, it became toxic to the cell as free Fe2+ could participate in reactions (such as the Fenton reaction), leading to deleterious reactive oxygen species (such as superoxide). To prevent toxicity from the iron ions themselves, they are carried and delivered to the cytoplasm and nucleus by cytoplasmic iron-sulfur assembly (CIA) proteins.
Figure \(\PageIndex{13}\) shows models of the complex and paths for electron flow.

Electrons "tunnel" from one cofactor to another in Complex I through quantum mechanical "hops". Since all redox cofactors after the favored hand-off of electrons from NADH to FMN are FeS clusters with similar E0 values (modulated only by local environments), there is no significant thermodynamic barrier to electron flow. The final N2 FeS cluster has an E0 value about 100 mV higher than the initial clusters; this final electron acceptor most readily accepts an electron.
The separation of the hydrophilic mitochondrial matrix domains, where electron transfer occurs, from the transmembrane domains, where proton transfer occurs, is an elegant design that keeps the key and reactive particles, e- and H+, from reacting with each other. The electrons stay on one side of the membrane, as the protons move to the other side (until the return in the last step when Complex V produces ATP).
Proton Transfer in Complex I
Proton transport occurs in the membrane domain. Available evidence suggests that 4 protons move from the cytoplasm to the periplasmic space against a concentration gradient during a catalytic cycle of Complex I in bacteria and other organisms.
Figure \(\PageIndex{14}\) shows multiple views of both the key electron transfer step and H+ ejection from the matrix into the intermembrane space. The key to proton transport is the discrete membrane domains shown in the bottom left part of Panel (a). There are four such domains involved from left to right, each one associated with the transport of 1H+. The individual membrane domains have different names and abbreviations depending on the organism. They are from left to right:
- Nqo12, NuoL or ND5
- Nqo13, NuoM, or ND4
- Nquo14, NuoN or ND2
- Nqo8, NuoH, or ND1.
The Nqo8, NuoH, or ND1 domain is proximal and closely linked to the site for the reduction of UQ to UQH2.

Figure \(\PageIndex{14}\): Structure and function of complex I. Panel (a) shows a large structural model of complex I from Thermus thermophilus (4HEA) showing the flow of electrons in the hydrophilic domain, while the mammalian complex (5LC5), with its supernumerary subunits in blue, is shown at the top left. Panel (b) shows the NADH/FMN site (3IAM) and its close proximity to the N3 tetranuclear cluster. Panel (c) shows the N2/Q reduction site with pi-stacking interactions of the ubiquinone ring with the aromatic His 38 ring. The P (positive side) accumulated H+s while the N (negative side) becomes depleted in them. Kaila VRI. 2018 Long-range proton-coupled electron transfer in biological energy conversion: towards mechanistic understanding of respiratory complex I. J. R. Soc. Interface 15: 20170916. http://dx.doi.org/10.1098/rsif.2017.0916. Creative Commons Attribution License http://creativecommons.org/licenses/by/4.0/,""
The NuoN/Nqo14/ND2, NuoM/Nqo13/ND4, and NuoL/Nqo12/ND5 domains act as and are structurally similar to antiporters. Note also a very long helix that crosses the left three-most antiporter domains. This helix runs parallel to the membrane and likely acts as a lever, allowing for coupled conformational changes in the three H+ transporters. We examined transporters in a previous chapter, and it was demonstrated in both cartoon and structural models that they alternated between inward- and outward-open conformations.
Figure \(\PageIndex{15}\) details the antiporter domains and the unique structural features allowing proton transport. Each antiporter domain consists of two 5-helix bundles, displaying pseudo-symmetry, with transmembrane helices numbered TM4-8 and TM9-13. The next-to-last helix in each bundle (7 and 9) is interpreted, with unbroken parts of the helices numbered TM7a/b and TM12a/b. Running along the middle of each of the antiporter-like domains of the membrane domain is a series of conserved charged amino acids (aspartate, glutamate, lysine, and histidine) that participate in a hydrogen bonding network. Molecular dynamics simulations show water molecules (panel b), represented by red dots (for the oxygen atoms), transiently occupying a hydrogen-bonded water network that serves as a conduit for H+ flow. An unbound "naked" proton (H+) would not persist long in any aqueous biological system. Panel C shows the conformational flexibility in broken interrupted helices that presumably gates the proton pore open and closed.

(a) The membrane domain of complex I has conserved buried charged/hydrophilic residues. NuoL (red); NuoM (blue); NuoN (yellow); NuoH (green); Ubiquone - Q (blue van der Waals representation). Inset: The conformation of the Lys/Glu ion pair (here Lys-204M/Glu-123M) can modulate the pKa of the middle Lys (Lys-235M).
(b) The NuoM antiporter-like subunit with water molecules (red dots). The arrow indicates the flow of protons through a hydrogen-bond-linked network of water molecules that "visit" the structure during a μs molecular dynamics simulation.
(c) Snapshot of structures obtained from molecular dynamic simulations of open (in blue) and closed (in red) proton channels from the N-side in Nqo13 (NuoM/ND4), showing conformational changes in the broken helix element.
(d ) The structural symmetry of the antiporter-like subunits with an N-side input channel near broken helix TM7b and an output channel near broken helix TM12b.
Kaila VRI. 2018 Long-range proton-coupled electron transfer in biological energy conversion: towards mechanistic understanding of respiratory complex I. J. R. Soc. Interface 15: 20170916. http://dx.doi.org/10.1098/rsif.2017.0916. Creative Commons Attribution License http://creativecommons.org/licenses/by/4.0/,
How is the reduction of ubiquinone and proton transport coupled? The mechanism likely involves conformational changes in flexible regions at the interface of the complex's hydrophilic and membrane domains.
Inhibition of Complex I
Complex I is inhibited by more than 60 different families of compounds. They include the classic Complex I inhibitor rotenone and many other synthetic insecticides/acaricides. The classes include Class I/A (the prototype of which is Piericidin A), Class II/B (the prototype of which is Rotenone), and Class C (the prototype of which is Capsaicin). They appear to bind at the same site. Figure \(\PageIndex{16}\) shows their structures. From the structure of the three prototypes, what are the characteristics of the pharmacophore, the “ideal binding ligand”? Where are they likely bound? How “promiscuous” is the binding site?

Many devastating neurological diseases are associated with defects in Complex I. In addition to major problems with oxidative ATP production, reactive oxygen species (ROS) increase. Complex I and Complex III are the major sites for generating ROS. Given the locations of the electron carriers at the periphery and internal within the protein complex, which electron carriers might most readily leak electrons to dioxygen? What ROS is likely to form in the process?
Inhibitors might block access to UQ or conformational changes necessary for the final reduction of the ubiquinone free radical. Class A inhibitors dramatically increase ROS production. The actual site of ROS production in Complex I is a bit controversial. One possible electron donor to dioxygen is FMN since both can engage in 1 e- transfers. Mutants that lack N2 iron-sulfur cluster showed ROS production.
In submitochondrial preparations, normal Complex I activity occurs (which leads to the formation of a sustained proton gradient). Also, reverse electron transport, powered by an artificial proton gradient, can occur, which leads to the reduction of NAD+, as shown in Figure \(\PageIndex{17}\).
Figure: Normal and Reverse Electron Transport Complex I
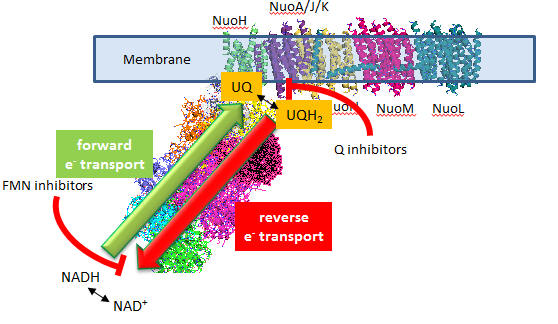
Figure \(\PageIndex{17}\): Overview of forward and reverse electron transport in Complex I.
A summary of the findings on superoxide production by Complex I shows that:
- flavin site inhibitors inhibit superoxide production but not Q site inhibitors.
- reverse electron transport leads to NAD+ and O2 reduction
- Reverse electron transport superoxide production is inhibited by both flavin and Q site inhibitors
Figure \(\PageIndex{18}\) shows an expanded view of electron transport and sites where ROS production is enhanced. Refer to the legend for details.

(A) During forward electron transfer (FET), ubiquinone, also called Coenzyme Q (CoQ), receives electrons from complexes I and II, glycerol-3-phosphate dehydrogenase (G3P), electron-transferring flavoprotein (ETF-QO), or dihydroorotate dehydrogenase (DHODH). During this process, electrons mainly leak to produce superoxide from the FMN binding site (IF) of CI during the oxidation of NADH to NAD+.
(B) In these conditions, if rotenone blocks the ubiquinone binding site (IQ), electrons cannot be transferred to CoQ, so they leak and generate ROS. FCCP, a molecule that collapses the H+ gradient by simple diffusion across the membrane, bypassing Complex V - ATP synthase. This also increases mitochondrial ROS generation during FET.
(C) When the CoQ pool becomes over-reduced, a high membrane potential favors the reverse transfer of electrons from ubiquinol to CI in a process called reverse electron transport (RET). During RET, electrons leak at either IF or IQ, generating a significant amount of superoxide.
(D) Blocking the IQ site with rotenone during RET prevents CoQ from transferring electrons back to CI and reduces ROS production. Similarly, FCCP reduces ROS by dissipating membrane potential.
Complex III
Complex III is a complicated, multisubunit protein at the heart of the respirasome. The subunits involved in electron transfer are cytochrome b, cytochrome c1, and the Rieske iron-sulfur protein (ISP). Cytochrome b has two hemes. One is cyto b562, which is also known as the low-potential heme or cyto bL. The other is cyto b566, the high-potential heme or cyto bH. The cytochrome c1 subunit has one heme. The Rieske iron-sulfur protein contains a Fe2S2 cluster. Figure \(\PageIndex{19}\) shows the relative position of the bound mobile electron carrier, cytochrome C, and the internal ones, the Rieske Fe/S cluster and cytochrome bL and bH. The molecule stigmatellin A also binds to the site where UQ becomes reduced (called the Qo site) and inhibits the complex. This shows that UQ/UQH2 are in a position to react readily with the Rieske center and cytochrome bL heme.

Figure \(\PageIndex{20}\) shows an interactive iCn3D model of a eukaryotic respiratory complex III (3CX5)
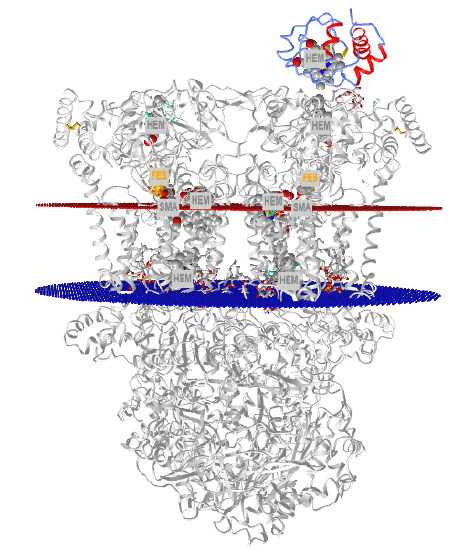
Figure \(\PageIndex{20}\): eukaryotic respiratory complex III (3CX5). (Copyright; author via source).
Click the image for a popup or use this external link:https://structure.ncbi.nlm.nih.gov/i...5riT4GSSGhCHfA. (loads slowly, given the size of the structures).
The Rieske iron-sulfur protein has a Fe2S2 iron-sulfur cluster, which differs from other such clusters in that each Fe is also coordinated to two His side chains, as shown in Figure \(\PageIndex{21}\). Alterations in H bonds to the histidines and the sulfurs in the complex can dramatically affect the standard reduction potential of the cluster.
As with Complexes I and IV, proton and electron transfer are coupled processes. However, in contrast to Complex I, in which protons pass through protein domains that have homology to K+/H+ antiporters, and Complex IV, in which they pass through a combination of a water channel and the H-bond network, the protons in Complex III are carried across the intermembrane space by ubiquinone itself. Two reduced ubiquinones (UQH2) from complex I pass their four matrix-derived protons into the intermembrane space. In the process, four electrons are removed in a multiple-step process called the Q cycle.
The two electrons from each UQH2 take different paths. One electron moves to a Fe/S Rieske cluster and the other to cytochrome bL. The electrons moved to the Rieske center, then moved to cytochrome c1, and then to the mobile electron carrier cytochrome C, which is bound to the complex in the intermembrane space. The electrons moved to cytochrome bL are transferred to cytochrome bH in the complex. Through this latter path, two electrons (from two UQH2) are moved to oxidized UQ, and two matrix protons are added to reform one UQH2. Hence, only one UQH2 participates in the net reaction shown below.
QH2 + 2 cyto c3+ + 2H+matrix → Q + 2 cyto c 2+ + 4H+IMS
Figure \(\PageIndex{22}\) illustrates this net overall reaction, called the Q cycle.

Once again, the protein has no “proton” channels or hydrogen-bonded networks for proton transfer across the inner membrane.
Another way to think about the electron transfer process from UQH2 to cytochrome C is that the two electrons from UQH2 take two different paths: one a high-potential path to the Rieske center and on to cytochrome C, and another a low-potential path to the bL heme and on to the bH heme and then to UQ to reform UQH2 (see figure above).
Complex III, as did Complex I, can also produce unwanted reactive oxygen species (ROS). Only three of the protein subunits, cytochrome b (with the bL and bH hemes), cytochrome c1, and the Rieske iron-sulfur protein (ISP) are involved in electron transfer, so one of those is most likely involved in ROS production. Experiments and mathematical models support a mechanism that involves a reduction of UQ by adding one electron from cytochrome bL to form UQ., which then passes its electron to dioxygen to form superoxide (O2-.).
As two ubiquinones must bind to the complex, there must be two proximal sites. One is the Qi site, where oxidized UQ binds and receives an electron, and the other is the Qo site, where UQH2 binds.
From a kinetic perspective, the first UQH2 binds and transfers two electrons, one to the Rieske cluster (and on to cytochrome c1 and then to cytochrome C) and one to cytochrome bL (and on to heme bH) and then to an oxidized UQ bound at the Qi site. The UQ. radical is stabilized by the adjacent bH heme, which has a lower affinity for electrons. A second UQH2 binds to the Qo site, transferring two electrons (one via the Rieske cluster and the second through cytochrome bL and bH) to the UQ. radical present at the Qi site. This forms UQH2 after two protons are transferred to it from the matrix.
Antimycin A, an extremely toxic drug, binds to the UQ Qi site and hence blocks electron transfer from cytochrome bL to bH at the Qi site. Heme bL can then pass its electron to dioxygen to produce superoxide.
Before we leave Complex III, think about this. The complex has two identical cytochrome b subunits, each with a bL and bH heme. The standard reduction potential of the bL and bH hemes in a subunit differ. This is another example that shows that the standard reduction potential, E0, depends on the environment of the electron acceptor/donor, just as the pKa of an acid depends on its environment.
Figure \(\PageIndex{23}\) shows an interactive iCn3D model of just the cytochrome b subunits and all the hemes in the eukaryotic respiratory complex III (3CX5) to give more clarity to the differing environments of the hemes in the two identical cytochrome b subunits.
.png?revision=1)
Figure \(\PageIndex{20}\): Cytochrome b subunits and all the hemes in the eukaryotic respiratory complex III (3CX5). (Copyright; author via source).
Click the image for a popup or use this external link: https://structure.ncbi.nlm.nih.gov/i...BaLQH2KwahNFt9
Complex IV - Cytochrome C oxidase (CCOx)
This is the final complex in the electron transport chains. It passes 4 electrons and 4 "substrate" protons to dioxygen to produce water. Additionally, it transports as many as 4 H+ ions from the matrix to the intermembrane space, resulting in a net change of 8 H+ ions. Here is a modified version of Equation 1 that represents the transported Hs.
\[\ce{O_2 + 4e^{-} + 4H^{+} + 4H^{+}_(in) → 2H_2O + 4H^{+}_(out)}. \nonumber \]
The structure of complex IV is shown in Figure \(\PageIndex{24}\). KEGG pathways (with permission).
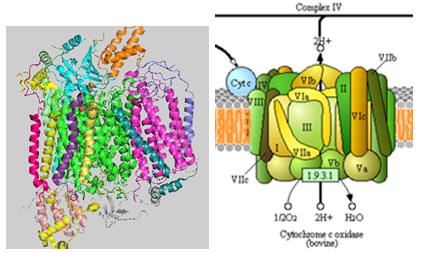
The 4 H+s moved across the membrane are not transported by protein domains that are structural equivalents of antiporters, as in Complex I. Rather, elaborate H-bonded water channels with contributions from a space of polar backbone and side chain H-bond donors and acceptors are involved in proton transport. Hence, a key question to understand is how electron transfer is coupled to H+ transfer through this hydrogen-bonded network. Since it's quite complicated, we will present multiple figures of varying resolutions to help explain this coupled process.
Figure \(\PageIndex{25}\) shows an interactive iCn3D model of the 14-subunit human cytochrome c oxidase (5z62) with bound cofactors required for electron transfer. Note that it does not show cytochrome C.
.png?revision=1&size=bestfit&width=399&height=335)
Figure \(\PageIndex{25}\): 14-subunit human cytochrome c oxidase (5z62). (Copyright; author via source).
Click the image for a popup or use this external link:https://structure.ncbi.nlm.nih.gov/i...XoHRyCkpeRN917. (loads slowly, given the size of the structure).
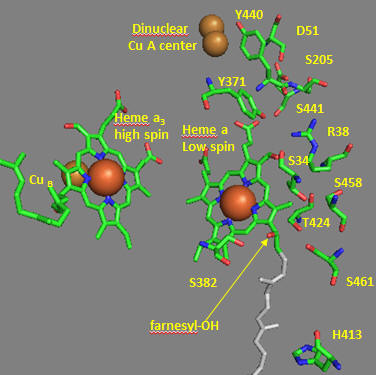
Reduced cytochrome C, a mobile electron carrier protein, binds to Complex IV in the intermembrane spaces and singly passes 4 electrons to a series of electron carriers (oxidizing agents) in the protein, eventually to dioxygen as the terminal electron acceptor. Figure \(\PageIndex{26}\) shows the arrangement of the electron acceptor cofactors in Complex IV. Electron transfer presumably occurs through quantum mechanical tunneling.

Cytochrome C, the initial “substrate” of this complex, delivers electrons from its heme cofactor to a dinuclear copper cluster, Cu A, where the copper ions are collectively coordinated to two histidines and two cysteines and a methionine. Figure \(\PageIndex{27}\) shows an interactive iCn3D model of the coordinating ligands for Cu A cluster in Complex IV (5z62)
.png?revision=1)
Figure \(\PageIndex{27}\): coordinating ligands for Cu A cluster in Complex IV (5z62). (Copyright; author via source).
Click the image for a popup or use this external link: https://structure.ncbi.nlm.nih.gov/i...7ARphDU4oyDS4A
From there, electrons flow to an adjacent heme a (low spin), with two coordinating histidine ligands. This heme hence does not bind dioxygen. From there, electrons move to another heme, heme a3 (high spin), and then finally to dioxygen, which is coordinated to the Fe in heme a3 and to an adjacent Cu B. Heme a3 has only one coordinating histidine ligand, which allows dioxygen binding to the unligated site. The heme a3 Fe:Cu dinuclear cluster is unique among all hemes. Figure \(\PageIndex{28}\) shows an interactive iCn3D model of the coordinating ligands for the hemes and Cu B in Complex IV (5z62)
.png?revision=1&size=bestfit&width=447&height=332)
Figure \(\PageIndex{28}\): coordinating ligands for CuB, heme a, and heme a3 in Complex IV (5z62). (Copyright; author via source).
Click the image for a popup or use this external link: https://structure.ncbi.nlm.nih.gov/i...4EUooXkwh13Fm8
First, let’s consider the transfer of electrons from heme a to heme a3 and then to dioxygen (we will consider the entry of electrons into the complex later). If dioxygen, a substrate for the reaction, dissociated from the heme a3 Fe before it was completely reduced, toxic ROS would result. This suggests a reason for the evolution of this key enzyme to have produced the unique heme a3 Fe:Cu dinuclear cluster.
Heme a and a3 vary from the heme in hemoglobin as they both have a formyl group replacing a methyl and a hydroxyethylfarnesyl group added to a vinyl substituent. Its structure is shown in Figure \(\PageIndex{29}\). What is the overall charge of the heme in its reduced state? In its oxidized state?
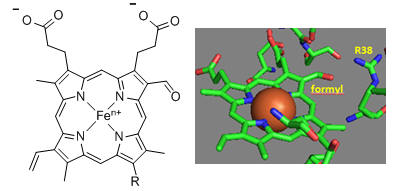
As hemes are prosthetic groups, they must bind to the apoprotein. The hydroxyethylfarnesyl group, with its nonpolar tail, facilitates the binding of the heme to both the Fe+2 and Fe+3 forms by about 6.3 kcal/mol (26 kJ/mol). The formyl group in heme a increases the E0 value (i.e., makes the heme a better oxidizing agent) by about 179 mV (4.1 kcal/mol, 17 kJ/mol). The effect appears to be mediated by the binding of the heme group to the protein again, but only in this case is there a differential effect. The formyl group preferentially stabilizes the binding of the Fe+2 heme compared to the Fe+3 heme, which, in a thermodynamic cycle, would promote the binding of an electron to Fe+3-heme (increasing its E0 value) to form the more stably bound Fe+2 heme.
The key challenge has been to understand the redox coupling to H+ transport. How is this done? The electrostatic environment of the hemes must be taken into account. In heme a, the two axial ligands are uncharged imidazole side chains of histidines. The overall charge on Fe2+-heme is zero, as the two propionates cancel the charges on Fe2+. However, there is a net +1 charge in the Fe3+-heme. This charge could be delocalized within the conjugated pi electrons of the planar heme, contributing to the deprotonation of a side chain near heme a in a process that would couple redox and H+ movement. The formyl group of heme a is coplanar with the heme ring in both Fe3+-heme and Fe2+-heme, allowing it to participate in the π-conjugated electron system of the ring. As the formyl group forms an H bond with Arg 38, changes in oxidation might affect Arg 38 as well.
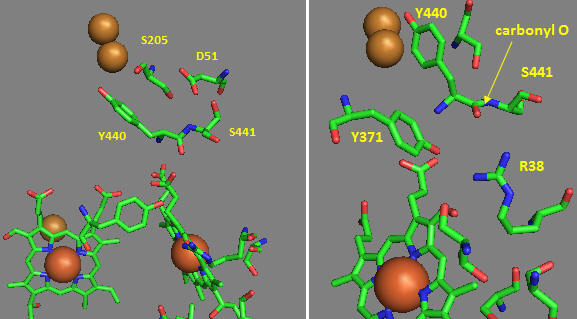
Many other amino acids are also involved. One is Asp-51 of subunit I, which contains heme a. This undergoes a conformational change, causing it to move to the surface of the inner membrane upon reduction. It is near the matrix in the oxidized state. Hence, it is likely involved in a proton transport pathway. Crystal structures of oxidized and reduced Complex IV show water channels and small “cavities,” which calculations show can hold 1-3 water molecules. Hence, groups around the heme, including R38, are accessible to water. Water is involved in H+ transport through the "handshaking" transfer of protons via a hydrogen-bonded network of waters and selective side chains. Some of the amino acid residues associated with the water channels are shown in Figure \(\PageIndex{30}\): and include R38 (the one hydrogen bonded to the formyl group of the heme), S34, T424, S461, S382, and H413.
Another consequence of electron transfer to heme a involves the interaction of S382 and the farnesyl OH group, which are close in space and proximal to a water cavity. On reduction of the heme, a conformation change occurs, which increases the standard reduction potential of the S382-farnesyl OH group. How would this affect the interaction of the two and the S382-L381-Val380 localized conformation? A new water cavity appears to emerge in this region upon reduction. How might this impact proton transfer from the matrix?
Now, let’s consider the entry site of electrons into the complex and how they might influence proton transport. As mentioned above, Asp 51 (D51) plays a key role. It is shown in Figure \(\PageIndex{29}\) above and also in Figure \(\PageIndex{30}\) below. In the oxidized state, D51 interacts with two OH side chains (S205 and S441) and amide NH backbone groups but is not exposed to water. On reduction, D51 lies on the surface in an aqueous environment. Near D51 is Y440-S441. The backbone carbonyl group between 440 and 441 forms an “indirect” interaction with R38 (right panel in Figure \(\PageIndex{31}\)), which we showed earlier is affected by the redox state of heme a. They are too far apart to form H bonds. Add two water molecules and envision a bridging interaction between the carbonyl O and the side chain R38 via Y371. Likewise, in your mind, add a water molecule to allow a bridged hydrogen bond interaction between Y371, which also forms a H bond, and the heme a propionate.
Figure: Role of Amino Acids near D51 in Cytochrome C Oxidase
A more nuanced understanding of the mechanism and linkage between H+ and e- movement derives from the high-resolution structures that were determined by Yano et al (2016). In their model (shown in the figures below based on the oxidized form of the protein, pdb 5b1a), protons from the negative (matrix) N side of the complex enter through a water channel and proceed to the positive (intermembrane side) through a H bond network (as described above and depicted below). These comprise the H-Pathway for H+ transfer across the membrane. Two other H+ transfer pathways, the D- and K-pathways, are used as a source of substrate H+ for the 4 H+s added to dioxygen to form 2H2Os.
Directional movement is mediated by proton-proton repulsion, aided by an increase in positive charge on heme a when it transfers an electron to heme a3. Of course, proton:proton repulsion would move protons in both directions. A conformational change on oxygen binding that closes the channel prevents reverse flow back through the water channel.
Ultimately, four electrons are transferred from cytochrome Cs (in single-electron steps) to the dicopper cluster, CuA, and then sequentially to heme a to heme a3 (near the copper B ion) to dioxygen to form water. The motion of electrons and protons is coupled through electrostatic interactions.
Figure \(\PageIndex{32}\) gives an overview of these movements. The small red dots are the oxygen atoms of internal water molecules (the rest have been removed using Pymol). Given the number and location of the internal water molecules, it should be apparent that many would be involved in the proton translocation pathways.

What's so interesting about this model is the detailed description of two types of protons: the ones that add to dioxygen and end up in water (substrate protons) and those that are vectorially (directionally) transported to the IMS. In their model, the H+s that end up being transported move through the water and H-bond network via a connecting H-bond link region to a Mg2+/water cluster. Since oxygen binding leads to structural changes that close off the water channel, all protons to be transported to the IMS must be bound in the cluster before dioxygen binding.
Figure \(\PageIndex{33}\) shows that, initially, 4 H+s move through the H system to the Mg2+/H2O cluster. Oxygen binding then closes the water channels. This buildup of positive charges would certainly lead to enhanced electrostatic attractions for the next phase of the reaction, the movement of electrons into the heme cofactors. Additionally, the 4 H+s in the cluster are likely prevented from leaking to the P side through proximal waters (see above figure) by a proline cluster, which presumably restricts the dynamic motion of the protein in that region necessary for proton movement. The figure does not show changes in the charge of the electron carriers.

The figure below breaks down the mechanism to show the addition of the first electron to the CuA (dicopper cluster), delivered from cytochrome C, and the subsequent transport of one proton from the fully proton-loaded Mg2+/water cluster after dioxygen binding. This figure does show the stepwise redox changes in the electron carriers.
After CuA receives an electron from cytochrome C, it donates it to heme a and not to heme a3, even though both are close. The extra negative charge on heme a facilitates proton pumping through the H pathways shown.
Figure \(\PageIndex{34}\)s shows a cartoon description of the movement of protons and electrons through Complex IV.

Figure \(\PageIndex{34}\): A schematic representation of the role of the Mg/H2O cluster in the proton-pumping mechanism of bovine heart CcO. Yano N et al. J Biol Chem. 2016 Nov 11;291(46):23882-23894. doi: 10.1074/jbc.M115.711770. Epub 2016 Sep 7. PMID: 27605664; PMCID: PMC5104913. Creative Commons Attribution (CC BY 4.0)
The Mg/H2O cluster and the H-pathway are connected with the short hydrogen bond network, as labeled in A (a). The location of heme a is shown by Fea3+ or Fea2+ attached to the hydrogen bond network of the H-pathway. The CuA site is on the water-accessible surface of the Mg/H2O cluster. The conformation of the CuA-Mg2+ complex is shown by the shape of a line connecting the two metal ions. The four hollows on the water-accessible surface of the Mg/H2O cluster show the proton-accepting sites. CuB1+ and Fea32+ indicate the O2 reduction site. The pumping and chemical (water-forming) protons are labeled in green and blue, respectively. Red curves show electron transfers. A, overall catalytic cycle of CcO. B, a typical single electron transfer from CuA to the O2 reduction site, coupled with the uptake and release of protons. For the sake of simplicity, the uptake of one chemical proton equivalent (the average number) is given in B. Various oxidation and ligand binding states in both CuB and Fea3 in the intermediate states shown by A (d) and B (d) are not included for the sake of simplicity.
Figure \(\PageIndex{35}\) converts the schematic representation into a "structural cartoon" representation showing one cycle of coupled electron and proton transfer into Complex IV.

The H- (for transport of 4H+s across the membrane) and the D- and K-pathways (sources of substrate 4H+s for water synthesis from O2 are shown in Figure \(\PageIndex{36}\).

Two black arrows show the D- and K- for substrate H+s that form water, while the blue arrow shows the H-pathway for the hydrogen bonding network of water in the water channel. The Mg/H2O cluster (blue area) is attached to the hydrogen-bond network of the H-pathway via a short hydrogen-bond network (gray area with water shown as a blue sphere). The formyl group and one of the propionate groups of heme a are hydrogen-bonded with Arg38 and a fixed water molecule in the hydrogen-bond network of the H-pathway. Compare this diagram to the ones presented in the figures above it. Again, we present multiple representations to give readers numerous opportunities to conceptualize this complex concept.
Complex II - succinate:ubiquinone oxidoreductase (SQR) - succinate dehydrogenase
You've seen complex II before, but it has another name: succinate dehydrogenase from step 6 of the citric acid cycle, which catalyzes the following reaction.
succinate + FAD ↔ fumarate + FADH2 ΔGo = 0 kcal/mol
The ΔGo for this reaction is about 0 kcal/mol, making it readily reversible.
However, something vital is left out of this description. The above reaction suggests that both FAD and FADH2 are readily diffusable and bind and unbind after catalysis. That's not true. Instead, FAD/FADH2 are covalently attached to the enzyme, so after one cycle of enzyme catalysis, the enzyme is dead. Another substrate/product pair must interact with enzymes to reconvert the covalently attached FADH2 to FAD so catalysis can continue. The other pair is ubiquinone (UQ/UQH2). Figure \(\PageIndex{37}\) gives a better description of the reaction equation. Complex II links the tricarboxylic acid cycle to electron transport!

Figure \(\PageIndex{37}\): Complex II - Succinate Dehydrogenase Reaction
Complex II is a multisubunit integral membrane protein, as with the other mitochondrial electron transport complexes. The hydrophilic section protruding into the matrix contains two proteins, a flavin-binding protein (Fp) and an iron/sulfur protein (Ip). The transmembrane domain has two "cytochrome binding proteins", a lighter one (CybL) and a heavier one (CybS). The complex has binding sites for dicarboxylic acids (succinate/fumarate) and two binding sites for ubiquinone, a proximal, higher-affinity site (Qp) on the matrix side, closer to the succinate binding site, and a distal, lower-affinity site (Qd). The ubiquinone sites bind 2-thenoyltrifluoroacetone (TTFA), which acts as an inhibitor of ubiquinone reduction. 3-nitropropionate - (NO2)(CH2)2CO2- is structural similar to succinate - (CO2-)(CH2)2CO2- and is an inhibitor of succinate oxidation.
Figure \(\PageIndex{38}\) shows an interactive iCn3D model of the Mitochondrial Respiratory Complex II from porcine (pig) heart (1ZOY). The chains are:
- hydrophilic FAD-binding protein (lavender)
- hydrophilic FeS protein (blue)
- integral membrane large cytochrome binding protein (brown)
- integral membrane small cytochrome binding protein (green)
.png?revision=1&size=bestfit&width=350&height=448)
Figure \(\PageIndex{38}\): Mitochondrial Respiratory Complex II from porcine heart (1ZOY) . (Copyright; author via source).
Click the image for a popup or use this external link: https://structure.ncbi.nlm.nih.gov/icn3d/share.html?KKPWG9dW1ARq3wQf9. (loads slowly given the size of the structure).
Given the role of the enzyme in both the mitochondrial citric acid and electron transfer pathways, you would expect high electron transfer rates between the dicarboxylic acid and the ubiquinone binding sites. Any disruptions in electron transfer (by inhibitors or mutations) could produce toxic reactive oxygen species (ROS). The binding of an inhibitor to the proximal Qp site would lead to a buildup of FADH2, which could transfer electrons in single-electron steps to dioxygen to produce ROS. This would occur if the dicarboxylic site were empty.
As there is no H+ transfer from the matrix to the intermembrane space for Complex II, we'll only focus on electron transfer from succinate to FAD and on to ubiquinone.
The transfer of electrons from succinate to ubiquinone takes two steps.
Step 1: Succinate + FAD ↔ Fumarate + FADH2. Figure \(\PageIndex{39}\) shows a plausible mechanism using a histidine in the active site as a general base. This is a simple hydride (2e-) transfer reaction to FAD. Note that no FeS cofactors are required.

Step 2: FADH2 + UQ ↔ FAD + UQH2. This does not proceed by transfer of 2 e- from FADH2 directly to UQ. Rather, it occurs through a series of the FeS cofactors (Fe2S2, Fe4S4, and Fe3S4 clusters) and heme. First, let's consider the path of electron transfer, which will occur in single-electron steps through the intermediary FeS clusters to ubiquinone, as shown in Figure \(\PageIndex{40}\). The standard reduction potential E0 is shown for each step. Note that FAD is shown instead of the actual electron donor, FADH2, to correspond to the standard reduction E0 values in tables.

Electrons flow from FADH2 (lowest, most negative E0 value, -79 mV) to UQ (highest, most positive value E0 value, +113 mV) or from weakest to strongest oxidizing agent. Electron transfer also depends on distance. The transfer of electrons to heme b is not likely, given the presence of the closer UQ with the most positive E0 value. Hence, the function of heme b is unclear. However, if electrons are transferred to it, it will quickly and favorably send them on to UQ. The FeS clusters have progressively more positive E0 values except for Fe4S4, whose E0 = -260 mV. Its E0 is depressed by the presence of charged/polar groups, which would make the transfer of a negative electron less likely. The net transfer standard potential is favored thermodynamically. As the E0 and corresponding G0 values are state functions, the final ΔG0 doesn't depend on the path. The high value of E0 for Fe4S4 presents an activation energy barrier for transfer in both directions and probably prevents reverse electron transport in this complex.
The membrane domains have two polar (Asn, Ser) and five polar-charged (Asp, Glu, and Lys) side chains.
Now, let's look at the terminal step in the transfer of electrons from Fe3S4 to ubiquinone. Figure \(\PageIndex{41}\) shows a plausible mechanism. Ubiquinone is shown in black. TTFA, which binds to the ubiquinone site and inhibits electron transfer, is shown in brackets. Tyrosine 91, Serine 41, and Histidine 216 are likely candidates for involvement in catalysis, as shown below. Arginine 46 and aspartate 90 might be involved in the protonation steps of UQH2.

Figure \(\PageIndex{42}\) shows an interactive iCn3D model of the iCn3D TTFA1 binding site (where ubiquinone binds).
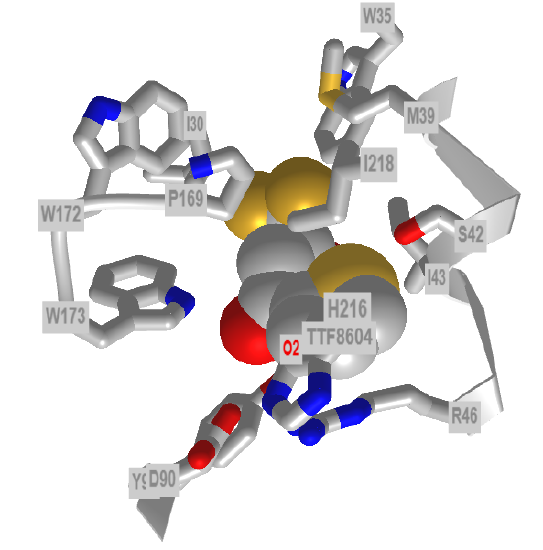
Figure \(\PageIndex{42}\): Mitochondrial Respiratory Complex II bound with 2-thenoyltrifluoroacetone (1zp0). (Copyright; author via source).
Click the image for a popup or use this external link: https://structure.ncbi.nlm.nih.gov/icn3d/share.html?dY3niSfLVa9WiNNe7
Recent Updates: 10/2/2025
Aging and Sleeping: Effects of Mitochondrial Damage from Reactive Oxygen Species
The ability to use O2 allowed eukaryotes to extract much more energy from sugars and fatty acids than from simple anaerobic metabolism. As described above, this came with the price of generating reactive oxygen species (such as superoxide, O2-), which can accelerate the aging process and tumor formation. Recently, mitochondrial damage has been suggested as the cause of sleep "pressure", which causes us to become sleepy and fall asleep. Mitochondrial changes in "sleep-control” neurons, specifically dorsal fan-shaped body neurons (dFBNs), have been studied in fruit flies, linking energy metabolism to the need for sleep.
In the sleep-deprived Drosophila brain, when there is pressure to fall asleep (sleep pressure), there is a significant increase in expression of genes for mitochondrial respiration and ATP production in the dFBNs. These include components of complexes I–V, ATP/ADP carriers, and enzymes of the TCA cycle (e.g., citrate synthase, succinate dehydrogenase, malate dehydrogenase). These findings link oxidative metabolism in the mitochondria with the regulation of sleep.
Other genes are affected. Sleep pressure is associated with a decrease in transcription of the gene responsible for neuronal communication, linking nerve activity to sleep regulation. Also, with increasing sleep pressure, mitochondria in the dFBNs fragment and undergo mitophagy, a process that removes and recycles damaged mitochondria. Increased contacts between mitochondria and the endoplasmic reticulum are also observed. These changes are reversible with sleep. What is happening at the molecular level? As you continue reading, you'll have to consider both the neural activity and the metabolic activities of the dFBNs. For the rest of the discussion, remember that in the wake state, the neural activity of the dFBNs is inhibited, but they are metabolically active.
To understand, we first need to discuss the effects of the neurotransmitter dopamine on the dFBNs, which lead to the inhibition of neural activity. Neurochemistry and nerve conduction are discussed in detail in Chapter 28.9. Neurotransmitters that act on a very short timescale bind to closed plasma membrane ion channels. Upon binding, the transmitters are "gated" open, allowing the rapid flow of ions within the cell and leading to a neural response. Other neurotransmitters, such as dopamine, act more slowly by inducing conformational changes in a neuroreceptor transmembrane protein. This leads to changes in other membrane and cytoplasmic neural proteins. This process of dopamine signaling of dFBNs involves the following steps:
1. Dopamine binds to its receptor on dFBNs. The receptor is not an ion channel, but a complex membrane protein, a G-protein coupled receptor (GPCR), with seven transmembrane helices. This GPCR then activates, through changes in the binding of an intracellular small G protein (with GTPase activity), an enzyme, adenylate cyclase, that converts ATP into cyclic AMP (cAMP).
2. Intracellular cAMP binds to and activates a protein called protein kinase A. The kinase phosphorylates two key membrane proteins that are active transporters, which require ATP to power the movement of ions across the membrane against a concentration gradient or membrane potential. These proteins are the plasma membrane protein Na+/K+ ATPase and the plasma membrane Ca2+-ATPase, as well as the endoplasmic reticulum membrane protein SERCA (Sarco/Endoplasmic Reticulum Calcium ATPase). The membrane ATPases are inhibited by phosphorylation. In addition, some voltage-gated Na⁺ and Ca²⁺channels are also inhibited. Most of the ATP used in neurons is used to maintain transmembrane ion concentration gradients, which are necessary for neural cells to function properly. Hence, ATP levels increase as its consumption to maintain and restore ion gradients is reduced.
3. ATP consumption decreases in the wake state, dopamine-inhibited dFBNs. However, its synthesis with high caloric intake increases during the wake state, leading to high ATP levels. Oxidative metabolism continues, however, as NADH builds up when the transport of electrons through the respiration chain stalls due to the high ATP levels. Both ATP and NADH become elevated during the wake state, and this imbalance begins to build up, causing sleep pressure. If the neurons were stimulated (active) to mimic sleep, ATP levels fall.
Now let's turn our attention to mitochondrial electron balance. Typically, electrons flowing from NADH at the start of electron transport in Complex I make it all the way to O2 in Complex IV, so few superoxide are produced from leakage at Complex I and ubiquinone pool (a one and two-electron mobile electron carrier). However, if there are both high levels of NADH (high levels of electrons) AND high levels of ATP (i.e., they are out of syn), the leakage becomes significant. This leakage is also reinforced by a large protonmotive force (∆p) and high ATP. Reactive oxygen species, like superoxide, damage membrane lipids. ATP levels in the dFBN neurons are about 20% higher than in adjacent neurons after one night of sleep deprivation.
This electron (redox) imbalance is sensed in a somewhat unclear way by the protein Hyperkinetic, which is the regulatory β subunit of the voltage-gated potassium channel Shaker in Drosophila. This protein is also a reductase for the reversible reaction of aldehydes/ketones ↔ alcohols (so it is an aldo-keto reductase). It is effectively a NADP+/NADPH sensor, whose ratio is affected by the redox state (or availability of electrons) in the electron transport chain. As an Aldo-Keto Reductase, it possesses an AKR domain, which binds to key molecules produced from the degradation of damaged peroxidized lipids formed by ROS (see Chapter 12.3.8 for a review of how peroxidized fatty acids are generated). Two of the degradation products are malondialdehyde (MDA) and 4-hydroxynonenal (4-HNE). Their structures are shown below in Figure \(\PageIndex{43}\).

Figure \(\PageIndex{43}\): Structures of MDA and 4-HNE
These reactive aldehyde-containing species, primarily produced from the peroxidation of omega-6 fatty acids, such as arachidonic and linoleic acids, can react with proteins (through Arg/Lys side chains) via Schiff base formation, as well as with Cys, His, and Lys through a Michael addition. Aldo-keto reductase can help detoxify them to alcohols. It's presumed but not completely confirmed that Hyperkinetic also reduces the bound aldehyde, as other aldo-keto reductases do. However, binding alone, accompanied by confirmations in the protein, is likely sufficient to regulate the Shaker K+ channel. Changes in the NADPH/NADP+ ratio (if hyerkinetic is catalytically active) may also regulate Shaker. However, mutations in Hyperkinetic appear to affect total sleep duration and have a lesser effect on sleep pressure.
In dFBNs, there was a 20% higher concentration of ATP compared to other neuron types after one night of sleep deprivation. ATP levels in dFBNs sharply increased when a heat stimulus led to increased dopamine levels that inhibited the dFBNs, mimicking the wake state. If the dFBNs were stimulated (not inhibited as by dopamine) directly to mimic sleep, ATP levels fell below baseline. Expressing an alternative oxidase (AOX) from Ciona intestinalis, which forms water by reducing O2, allows extra electrons to be used without ROS production, relieving sleep pressure. Providing further evidence to support this mismatch hypothesis, increasing ATP synthesis through a proton pump (mito-dR) driven by photons results in increased sleep pressure.
Figure \(\PageIndex{43}\) below shows another overview of electron transport oxidative phosphorylation, showing the key players.

Figure \(\PageIndex{43}\): Proton-pumping complexes I, III, and IV convert the energy of electron transfers from NADH to O2—through intermediates CoQ and cytochrome c (cyt c)—into a proton electrochemical gradient, ∆p, across the intermitochondrial membrane (IMM). Ucp4 discharges, whereas illumination (hν) of mito-dR charges the IMM. The return of extruded protons to the matrix spins the blades of the ATP synthase, producing ATP, which then leaves the matrix via the sesB channel in exchange for cytoplasmic ADP. Neuronal ATP consumption is activity-dependent, in part because the plasma membrane Na+–K+ ATPase must restore ion gradients dissipated by action and excitatory synaptic currents. An oversupply (relative to ATP demand) of electrons to CoQ increases the risk of single-electron reductions of O2 to O2− at complexes I and III. AOX mitigates this risk. Sarnataro, R., Velasco, C.D., Monaco, N. et al. Mitochondrial origins of the pressure to sleep. Nature 645, 722–728 (2025). https://doi.org/10.1038/s41586-025-09261-y. Creative Commons Attribution 4.0 International License. http://creativecommons.org/licenses/by/4.0/.
Now, let's return to the more macroscopic changes in mitochondria that occur with sleep deprivation. These changes are likely mediated by ROS damage to membrane lipids. A variety of proteins control mitochondrial dynamics and orchestrate the balance between fission and fusion. Dynamin-related protein 1 (Drp1) facilitates the fission of the membrane by forming oligomers that surround the mitochondria, and through constriction, severs the mitochondrial membrane. GTP hydrolysis is required for this process. Sleep loss causes the recruitment of Drp1 from the cytoplasm to the mitochondria to initiate fission. This protein belongs to the dynamin family, which comprises GTPase proteins used for membrane fission during endocytosis, where they form helical "collars" around budding vesicles.
This process is reversible since small mitochondria (or fragments) can fuse to form larger ones. Two mitochondrial integral membrane GTPases are involved in mitochondrial fusion: optic atrophy 1 (Opa1) and mitofusin, also known as mitochondrial assembly regulatory factor (Mfr). Oligomerization of these proteins promotes fusion. These proteins and their functions are illustrated in Figure \(\PageIndex{43}\) below.

Figure \(\PageIndex{44}\): The mitochondrial fission (green) and fusion machineries (blue) comprise Drp1, the outer and inner membrane proteins Marf and Opa1, and the mitoPLD zuc, which releases phosphatidic acid (PA) from cardiolipin (CL). Miga stimulates zuc activity and/or supplies phosphatidic acid from other membranes. Sarnataro et al., ibid.
It appears that the reversible fission ↔ fusion process in mitochondria occurs as a response to the imbalance in ATP demand and electrons supplied by NADH. Agents that decrease fragmentation and increase fusion in dFPNs increase sleep depth and duration.
- Overexpression of Drp1 or depletion of Opa led to increased mitochondrial fission, decreased sleep, and reduced ATP concentration.
- IF Drp1 is depleted or Opa1 is increased, fusion occurs, resulting in increased sleep .
These effects were specific to the dFBNs.
Fission followed by mitophagy, which occurs after sleep deprivation, likely facilitates the removal of damaged mitochondria. Increases mitochondrial contact with the ER likely help replace damaged peroxidized mitochondrial lipids with undamaged ER membrane lipids. The upregulation of gene transcripts for the citric acid cycle and electron transport gene is likely an additional attempt to repair and rejuvenate mitochondria in sleep-derived brains.
Summary
This chapter provides a comprehensive look at the mitochondrial electron transport chain (ETC), a critical component of aerobic metabolism that links the oxidation of reducing equivalents (NADH and FADH₂) to the production of ATP. It explains how electrons derived from the citric acid cycle are transferred through a series of membrane-bound protein complexes, ultimately reducing molecular oxygen to water, and how the energy released during these redox reactions is harnessed to pump protons across the mitochondrial inner membrane.
Key Components and Electron Carriers:
The ETC is composed of four major complexes (I, II, III, and IV) embedded in the inner mitochondrial membrane, along with mobile electron carriers such as ubiquinone (UQ) and cytochrome c. Complex I (NADH-quinone oxidoreductase) initiates electron transfer by oxidizing NADH through a series of cofactors including FMN and multiple iron–sulfur clusters. Complex II (succinate dehydrogenase) links the citric acid cycle to the ETC by oxidizing succinate to fumarate and transferring electrons from FADH₂ to ubiquinone. Complex III (cytochrome bc₁ complex) employs the Q cycle to bifurcate electrons from reduced ubiquinone, directing them to cytochrome c and simultaneously contributing to the proton gradient. Finally, Complex IV (cytochrome c oxidase) receives electrons from cytochrome c and catalyzes the four-electron reduction of oxygen to water while pumping additional protons, further establishing the proton motive force.
Coupling Electron Transport to ATP Synthesis:
Rather than relying on a high-energy phosphorylated intermediate, the ETC couples electron transfer to the active transport of protons from the mitochondrial matrix to the intermembrane space. This proton gradient (proton motive force) is then exploited by ATP synthase (Complex V) to drive the endergonic synthesis of ATP from ADP and inorganic phosphate.
Structural and Functional Integration:
The chapter emphasizes the intricate structural organization of the ETC complexes, including the formation of supercomplexes (respirasomes) that optimize electron transfer and reduce the risk of electron leakage, which can lead to the formation of reactive oxygen species (ROS). Detailed discussions on the electron carriers within Complex I, the Q cycle mechanism of Complex III, and the elaborate water channels and proton pathways in Complex IV illustrate the fine-tuned mechanisms by which the system minimizes side reactions and maximizes efficiency.
Regulation and Inhibition:
Understanding the ETC also involves appreciating its regulation and vulnerabilities. The text reviews how inhibitors, such as rotenone for Complex I and antimycin A for Complex III, can disrupt electron flow, leading to enhanced ROS production and potential cellular damage. These insights underscore the physiological importance of maintaining efficient and tightly controlled electron transport for cellular energy homeostasis.
In summary, this chapter integrates structural, mechanistic, and regulatory aspects of the mitochondrial electron transport chain, providing a detailed view of how electron flow is coupled to proton pumping and ATP synthesis. The material underscores the evolutionary sophistication of the ETC in harnessing energy while minimizing harmful side reactions, a concept central to understanding cellular respiration in aerobic organisms.