
20.1.1: Water Pollutants and Their Sources
- Page ID
- 32229

\( \newcommand{\vecs}[1]{\overset { \scriptstyle \rightharpoonup} {\mathbf{#1}} } \)
\( \newcommand{\vecd}[1]{\overset{-\!-\!\rightharpoonup}{\vphantom{a}\smash {#1}}} \)
\( \newcommand{\id}{\mathrm{id}}\) \( \newcommand{\Span}{\mathrm{span}}\)
( \newcommand{\kernel}{\mathrm{null}\,}\) \( \newcommand{\range}{\mathrm{range}\,}\)
\( \newcommand{\RealPart}{\mathrm{Re}}\) \( \newcommand{\ImaginaryPart}{\mathrm{Im}}\)
\( \newcommand{\Argument}{\mathrm{Arg}}\) \( \newcommand{\norm}[1]{\| #1 \|}\)
\( \newcommand{\inner}[2]{\langle #1, #2 \rangle}\)
\( \newcommand{\Span}{\mathrm{span}}\)
\( \newcommand{\id}{\mathrm{id}}\)
\( \newcommand{\Span}{\mathrm{span}}\)
\( \newcommand{\kernel}{\mathrm{null}\,}\)
\( \newcommand{\range}{\mathrm{range}\,}\)
\( \newcommand{\RealPart}{\mathrm{Re}}\)
\( \newcommand{\ImaginaryPart}{\mathrm{Im}}\)
\( \newcommand{\Argument}{\mathrm{Arg}}\)
\( \newcommand{\norm}[1]{\| #1 \|}\)
\( \newcommand{\inner}[2]{\langle #1, #2 \rangle}\)
\( \newcommand{\Span}{\mathrm{span}}\) \( \newcommand{\AA}{\unicode[.8,0]{x212B}}\)
\( \newcommand{\vectorA}[1]{\vec{#1}} % arrow\)
\( \newcommand{\vectorAt}[1]{\vec{\text{#1}}} % arrow\)
\( \newcommand{\vectorB}[1]{\overset { \scriptstyle \rightharpoonup} {\mathbf{#1}} } \)
\( \newcommand{\vectorC}[1]{\textbf{#1}} \)
\( \newcommand{\vectorD}[1]{\overrightarrow{#1}} \)
\( \newcommand{\vectorDt}[1]{\overrightarrow{\text{#1}}} \)
\( \newcommand{\vectE}[1]{\overset{-\!-\!\rightharpoonup}{\vphantom{a}\smash{\mathbf {#1}}}} \)
\( \newcommand{\vecs}[1]{\overset { \scriptstyle \rightharpoonup} {\mathbf{#1}} } \)
\( \newcommand{\vecd}[1]{\overset{-\!-\!\rightharpoonup}{\vphantom{a}\smash {#1}}} \)
\(\newcommand{\avec}{\mathbf a}\) \(\newcommand{\bvec}{\mathbf b}\) \(\newcommand{\cvec}{\mathbf c}\) \(\newcommand{\dvec}{\mathbf d}\) \(\newcommand{\dtil}{\widetilde{\mathbf d}}\) \(\newcommand{\evec}{\mathbf e}\) \(\newcommand{\fvec}{\mathbf f}\) \(\newcommand{\nvec}{\mathbf n}\) \(\newcommand{\pvec}{\mathbf p}\) \(\newcommand{\qvec}{\mathbf q}\) \(\newcommand{\svec}{\mathbf s}\) \(\newcommand{\tvec}{\mathbf t}\) \(\newcommand{\uvec}{\mathbf u}\) \(\newcommand{\vvec}{\mathbf v}\) \(\newcommand{\wvec}{\mathbf w}\) \(\newcommand{\xvec}{\mathbf x}\) \(\newcommand{\yvec}{\mathbf y}\) \(\newcommand{\zvec}{\mathbf z}\) \(\newcommand{\rvec}{\mathbf r}\) \(\newcommand{\mvec}{\mathbf m}\) \(\newcommand{\zerovec}{\mathbf 0}\) \(\newcommand{\onevec}{\mathbf 1}\) \(\newcommand{\real}{\mathbb R}\) \(\newcommand{\twovec}[2]{\left[\begin{array}{r}#1 \\ #2 \end{array}\right]}\) \(\newcommand{\ctwovec}[2]{\left[\begin{array}{c}#1 \\ #2 \end{array}\right]}\) \(\newcommand{\threevec}[3]{\left[\begin{array}{r}#1 \\ #2 \\ #3 \end{array}\right]}\) \(\newcommand{\cthreevec}[3]{\left[\begin{array}{c}#1 \\ #2 \\ #3 \end{array}\right]}\) \(\newcommand{\fourvec}[4]{\left[\begin{array}{r}#1 \\ #2 \\ #3 \\ #4 \end{array}\right]}\) \(\newcommand{\cfourvec}[4]{\left[\begin{array}{c}#1 \\ #2 \\ #3 \\ #4 \end{array}\right]}\) \(\newcommand{\fivevec}[5]{\left[\begin{array}{r}#1 \\ #2 \\ #3 \\ #4 \\ #5 \\ \end{array}\right]}\) \(\newcommand{\cfivevec}[5]{\left[\begin{array}{c}#1 \\ #2 \\ #3 \\ #4 \\ #5 \\ \end{array}\right]}\) \(\newcommand{\mattwo}[4]{\left[\begin{array}{rr}#1 \amp #2 \\ #3 \amp #4 \\ \end{array}\right]}\) \(\newcommand{\laspan}[1]{\text{Span}\{#1\}}\) \(\newcommand{\bcal}{\cal B}\) \(\newcommand{\ccal}{\cal C}\) \(\newcommand{\scal}{\cal S}\) \(\newcommand{\wcal}{\cal W}\) \(\newcommand{\ecal}{\cal E}\) \(\newcommand{\coords}[2]{\left\{#1\right\}_{#2}}\) \(\newcommand{\gray}[1]{\color{gray}{#1}}\) \(\newcommand{\lgray}[1]{\color{lightgray}{#1}}\) \(\newcommand{\rank}{\operatorname{rank}}\) \(\newcommand{\row}{\text{Row}}\) \(\newcommand{\col}{\text{Col}}\) \(\renewcommand{\row}{\text{Row}}\) \(\newcommand{\nul}{\text{Nul}}\) \(\newcommand{\var}{\text{Var}}\) \(\newcommand{\corr}{\text{corr}}\) \(\newcommand{\len}[1]{\left|#1\right|}\) \(\newcommand{\bbar}{\overline{\bvec}}\) \(\newcommand{\bhat}{\widehat{\bvec}}\) \(\newcommand{\bperp}{\bvec^\perp}\) \(\newcommand{\xhat}{\widehat{\xvec}}\) \(\newcommand{\vhat}{\widehat{\vvec}}\) \(\newcommand{\uhat}{\widehat{\uvec}}\) \(\newcommand{\what}{\widehat{\wvec}}\) \(\newcommand{\Sighat}{\widehat{\Sigma}}\) \(\newcommand{\lt}{<}\) \(\newcommand{\gt}{>}\) \(\newcommand{\amp}{&}\) \(\definecolor{fillinmathshade}{gray}{0.9}\)Although natural processes such as volcanic eruptions or evaporation sometimes can cause water pollution, most pollution is derived from human, land-based activities. Pollutants can spread through different water reservoirs, as the water carrying them progresses through stages of the water cycle (figure \(\PageIndex{a}\)). Residence time (the average time that a water molecule spends in a reservoir) is key to pollution problems because it affects pollution potential. Water in rivers has a relatively short residence time, so pollution usually is there only briefly. Of course, pollution in rivers may simply move to another reservoir, such as the ocean, where it can cause further problems. Groundwater is typically characterized by slow flow and longer residence time, which can make groundwater pollution particularly problematic. Finally, pollution residence time can be much greater than the water residence time because a pollutant may be taken up for a long time within the ecosystem or absorbed onto sediment.
Water can be contaminated by various human activities or by existing natural features, like mineral-rich geologic formations. Agricultural activities, industrial operations, landfills, animal operations, and small and large scale sewage treatment processes, among many other things, all can potentially contribute to contamination. As water runs over the land or infiltrates into the ground, it dissolves material left behind by these potential contaminant sources. The risks and type of remediation for a contaminant depend on the type of chemicals present.
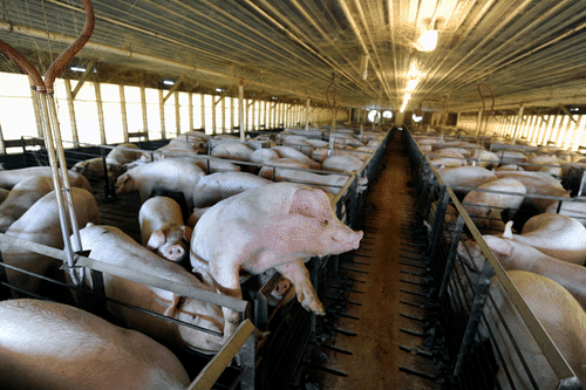
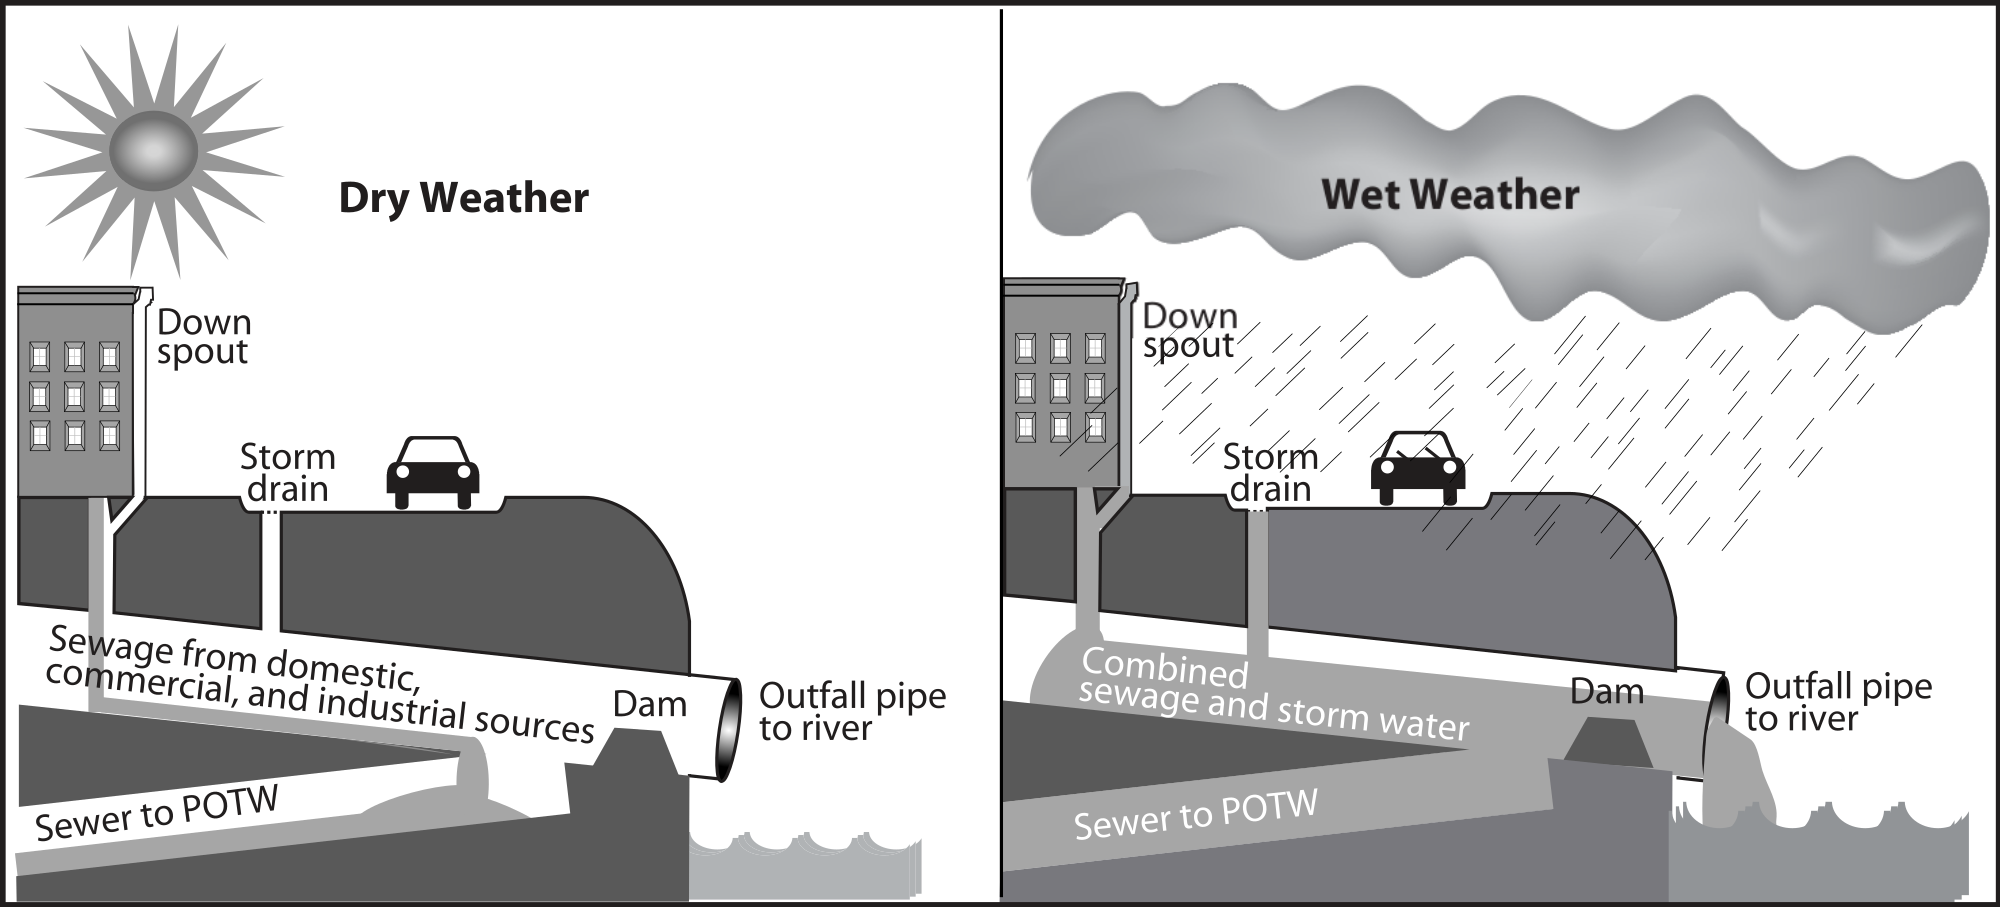
Point source pollution can be attributed to a single, definable origin. For example, animal factory farms (figure \(\PageIndex{b}\)) raise a large number and high density of livestock such as cows, pigs, and chickens. Combined sewer systems that have a single set of underground pipes to collect both sewage and storm water runoff from streets for wastewater treatment can also be major point sources of pollutants. During heavy rain, storm water runoff may exceed sewer capacity, causing it to back up. This spills untreated sewage directly into surface waters (figure \(\PageIndex{c}\)). Other examples include pipes from factories, waste disposal sites, storage tanks, and chemical spills.
Nonpoint source pollution is from multiple dispersed sources. The whole of the contribution of pollutants is harmful, but the individual components may not reach harmful concentrations. Nonpoint sources of pollution include agricultural fields, cities, and abandoned mines. Rainfall runs over the land and through the ground, picking up pollutants from throughout the watershed (including areas of land and smaller streams that drain into a particular body of water). These pollutants might include herbicides, pesticides, and fertilizer from agricultural fields and lawns; oil, antifreeze, animal waste, and road salt from urban areas; and acid and toxic elements from abandoned mines. Then, this pollution is carried by runoff into surface water bodies and groundwater. Nonpoint source pollution, which is the leading cause of water pollution in the U.S., is usually much more difficult and expensive to control than point source pollution because of its low concentration, multiple sources, and much greater volume of water.
According to a 2016 report, there were 20,912 cases of impaired water bodies in the United States, which means they could neither support a healthy ecosystem nor meet water quality standards (table \(\PageIndex{a}\)). Selected causes of impairment (water pollutants) are discussed below, categorized according to whether they arise from chemical, biological, or physical processes.
| Cause of Impairment | Number of Impaired Bodies of Water |
|---|---|
| Polychlorinated biphenyls (PCBs) | 3,712 |
| Pathogens | 2,248 |
| Nutrients | 2,228 |
| Mercury | 2,138 |
| Metals (other than mercury) | 2,075 |
| Cause unknown- impaired biota | 1,852 |
| Organic enrichment/oxygen depletion | 1,281 |
| Turbidity | 1,175 |
| Pesticides | 795 |
| Salinity/total dissolved solids/chlorides/sulfates | 576 |
| pH/acidity/caustic conditions | 489 |
| Sediment | 453 |
| Temperature | 358 |
| Total toxics | 282 |
| Algal growth | 174 |
| Cause unknown | 159 |
| Dioxins | 136 |
| Toxic organics | 127 |
| Toxic inorganics | 99 |
Chemical Pollutants
Chemical pollution from agriculture, industry, cities, and mining threatens global water quality. Air pollutants from these activities can also enter bodies of water (and become water pollutants) through dry deposition, precipitation, and runoff. Some chemical pollutants have serious and well-known health effects, whereas many others have poorly known long-term health effects.
Any natural water contains dissolved chemicals, some of which are important human nutrients while others can be harmful to human health. The concentration of a water pollutant is commonly given in very small units such as parts per million (ppm) or even parts per billion (ppb). An arsenic concentration of 1 ppm means 1 part of arsenic per million parts of water. This is equivalent to one drop of arsenic in 50 liters of water. To give you a different perspective on appreciating small concentration units, converting 1 ppm to length units is 1 cm (0.4 in) in 10 km (6 miles) and converting 1 ppm to time units is 30 seconds in a year. Total dissolved solids (TDS) represent the total amount of dissolved material in water. Average TDS values for rainwater, river water, and seawater are about 4 ppm, 120 ppm, and 35,000 ppm, respectively.
Organic Pollutants
Organic pollutants include herbicides and pesticides, pharmaceuticals, fuel (such as oil spills), industrial solvents and cleansers, and synthetic hormones associated with pharmaceuticals. These synthetic hormones can act as endocrine disruptors. Many are persistent organic pollutants (POPs), which are long-lived in the environment, biomagnify through the food chain, and can be toxic. As previously mentioned, DDT (pesticide), dioxin (herbicide by-product), and PCBs (polychlorinated biphenyls, which were used as a liquid insulator in electric transformers), are all POPs.
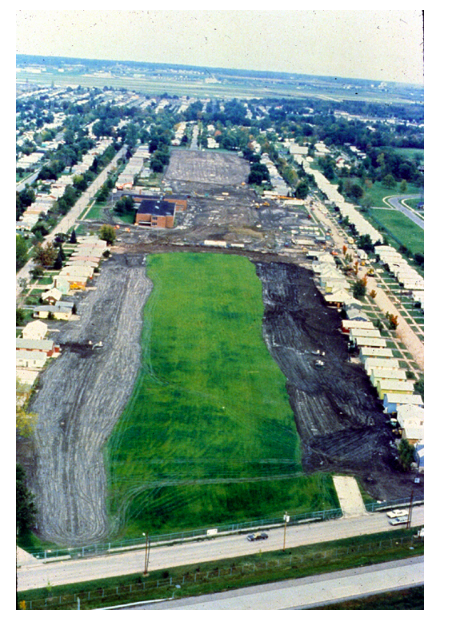
An example of organic chemical contamination is the Love Canal, in Niagara Falls, New York (Figure \(\PageIndex{d}\)). From 1942 to 1952, the Hooker Chemical Company disposed of over 21,000 tons of chemical waste, including chlorinated hydrocarbons, into a canal and covered it with a thin layer of clay. Chlorinated hydrocarbons are a large group of organic chemicals that have chlorine functional groups, most of which are toxic and carcinogenic to humans (DDT and PCBs are an examples.) The company sold the land to the New York School Board, who developed it into a neighborhood. After residents began to suffer from serious health ailments and pools of oily fluid started rising into residents’ basements, the neighborhood had to be evacuated. This site became a U.S. Environmental Protection Agency Superfund Site, a site with federal funding and oversight to ensure its cleanup.
Inorganic Pollutants
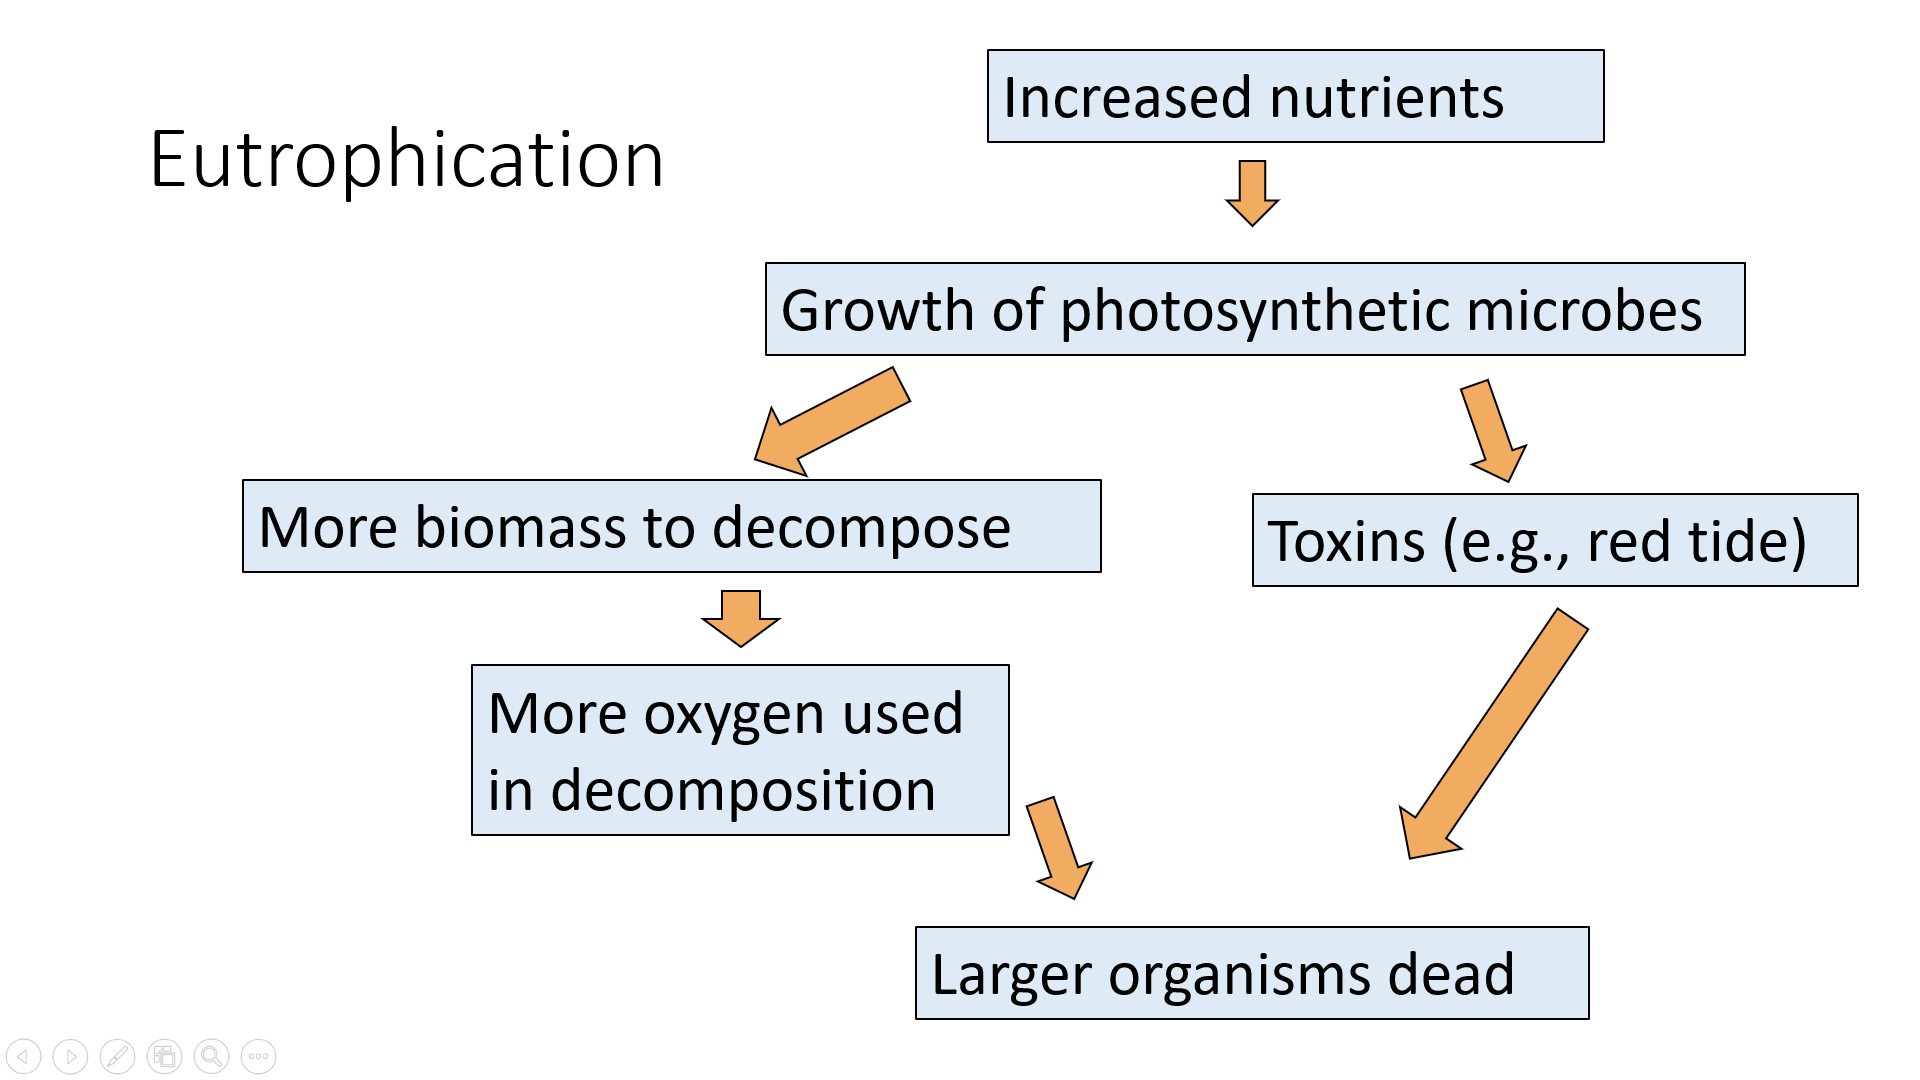
Inorganic pollutants (figure \(\PageIndex{e}\)) include nutrients like nitrate (NO3-) and phosphate (PO43-), heavy metals, chloride (Cl-), and radioactive isotopes released from mining or nuclear accidents (such as cesium, iodine, uranium, and radon gas). Nutrients can be from geologic material, like phosphorus-rich rock, but are most often sourced from fertilizer and animal and human waste. Untreated sewage and agricultural runoff concentrate nitrogen and phosphorus which are essential for the growth of microorganisms. Nutrients like nitrate and phosphate in surface water can promote the growth of microbes, like blue-green algae (cyanobacteria), which in turn deplete dissolved oxygen (O2) and produce toxins. This process is known as eutrophication (discussed below as well as previously in Biogeochemical Cycles, Threats to Biodiversity, and Industrial Agriculture).
.jpg?revision=1&size=bestfit&width=582&height=388)
Examples of heavy metals include arsenic, mercury, lead, cadmium, and chromium, and they can bioaccumulate and biomagnify through the food chain. Arsenic (As) enters the water supply naturally from weathering of arsenic-rich minerals and from human activities such as coal burning and smelting of metallic ores. The worst case of arsenic poisoning occurred in the densely populated impoverished country of Bangladesh, which had experienced 100,000s of deaths from diarrhea and cholera each year from drinking surface water contaminated with pathogens due to improper sewage treatment. In the 1970s the United Nations provided aid for millions of shallow water wells, which resulted in a dramatic drop in pathogenic diseases. Unfortunately, many of the wells produced water naturally rich in arsenic. Tragically, there are an estimated 77 million people (about half of the population) who inadvertently may have been exposed to toxic levels of arsenic in Bangladesh as a result. The World Health Organization has called it the largest mass poisoning of a population in history.
Mercury enters the water supply naturally from weathering of mercury-rich minerals and, like mercury, from human activities such as coal burning and metal processing. A famous mercury poisoning case in Minamata, Japan involved methylmercury-rich industrial discharge that caused high mercury levels in fish. People in the local fishing villages ate fish up to three times per day for over 30 years, which resulted in over 2,000 deaths. During that time the responsible company and national government did little to mitigate, help alleviate, or even acknowledge the problem.
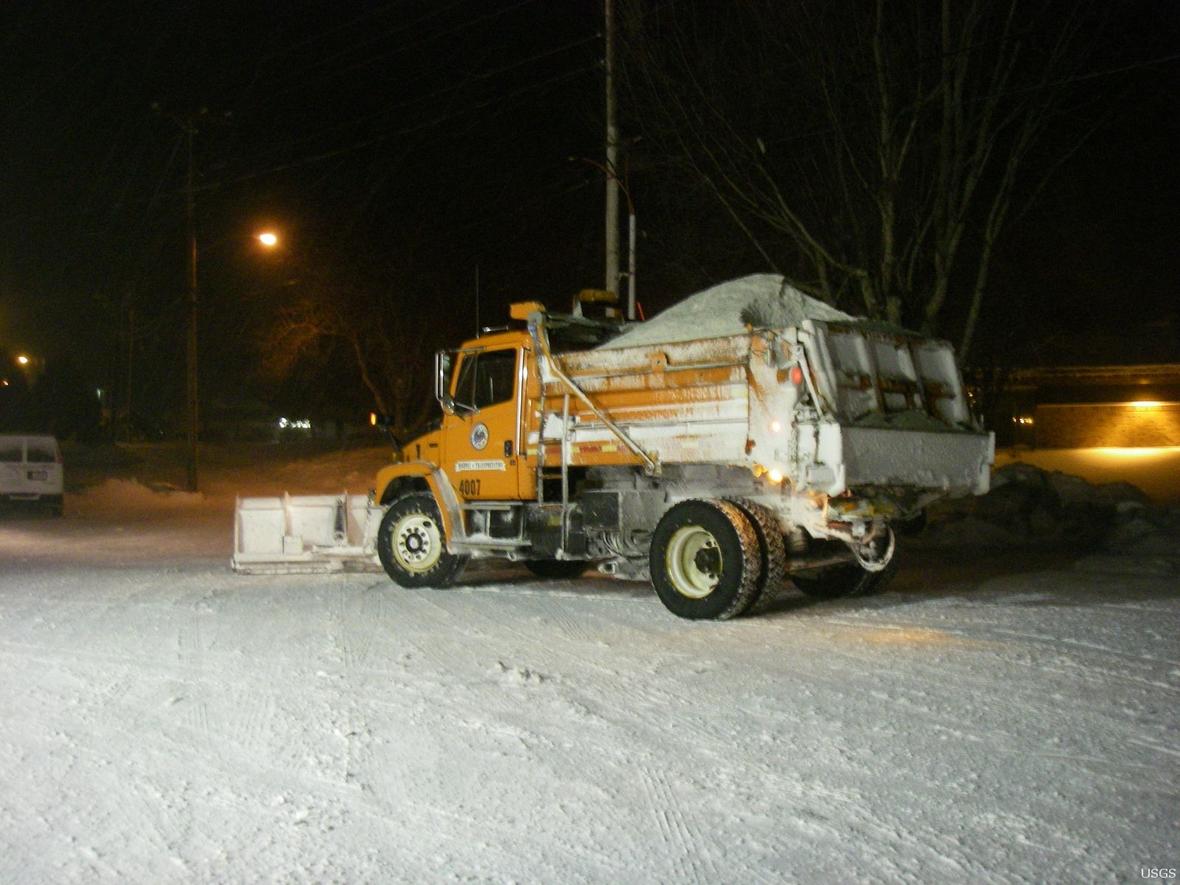
Salt, typically sodium chloride, is a common inorganic contaminant. It can be introduced into groundwater from natural deposits or from anthropogenic sources like the salts applied to roads in the winter to keep ice from forming (figure \(\PageIndex{f}\)). Salt contamination can also occur from saltwater intrusion, where cones of depression around fresh groundwater pumping near ocean coasts induce the encroachment of saltwater into the freshwater body.
The acidity or alkalinity of a body of water can also impact its quality. pH is a measure of the concentration of hydrogen ions (protons) in a solution, which determines how acidic or basic (alkaline) a solution is. Acidic solutions have a high hydrogen ion concentration and a pH less than 7, and basic solutions have a pH of greater than 7. The pH of freshwater usually ranges from 5 to 9, and saltwater is slightly basic (pH = 8.2) in a healthy ecosystem. When conditions are too acidic, some aquatic animals cannot reproduce, and calcium carbonate structures (clams, snails, corals, etc.) dissolve. Acid deposition is further discussed later in this chapter, and ocean acidification is discussed in the next chapter.
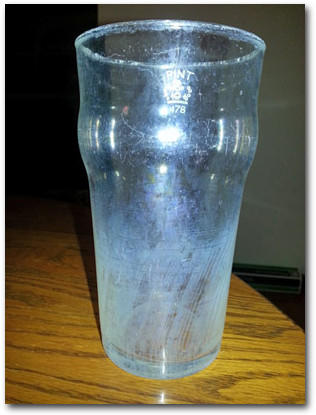
Hard water contains abundant calcium and magnesium, which reduces its ability to develop soapsuds and enhances scale (calcium and magnesium carbonate minerals) formation on hot water equipment. Water softeners remove calcium and magnesium, which allows the water to lather easily and prevent the minerals from precipitating on surfaces (figure \(\PageIndex{g}\)). Hard water develops naturally from the dissolution of calcium and magnesium carbonate minerals in soil; it does not have negative health effects in people.
Biological Pollutants
Pathogens (infectious microorganisms or viruses) enter water primarily from human and animal fecal waste due to inadequate sewage treatment. In many underdeveloped countries, sewage is discharged into local waters either untreated or after only rudimentary treatment. In developed countries untreated sewage discharge can occur from overflows of combined sewer systems, poorly managed livestock factory farms, and leaky or broken sewage collection systems. Water with pathogens can be remediated by adding chlorine or ozone (O3), by boiling, or by treating the sewage in the first place.
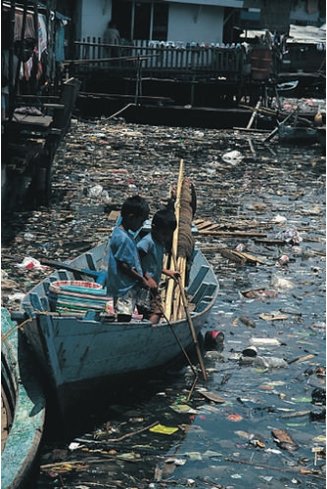
Physical Sources of Pollution
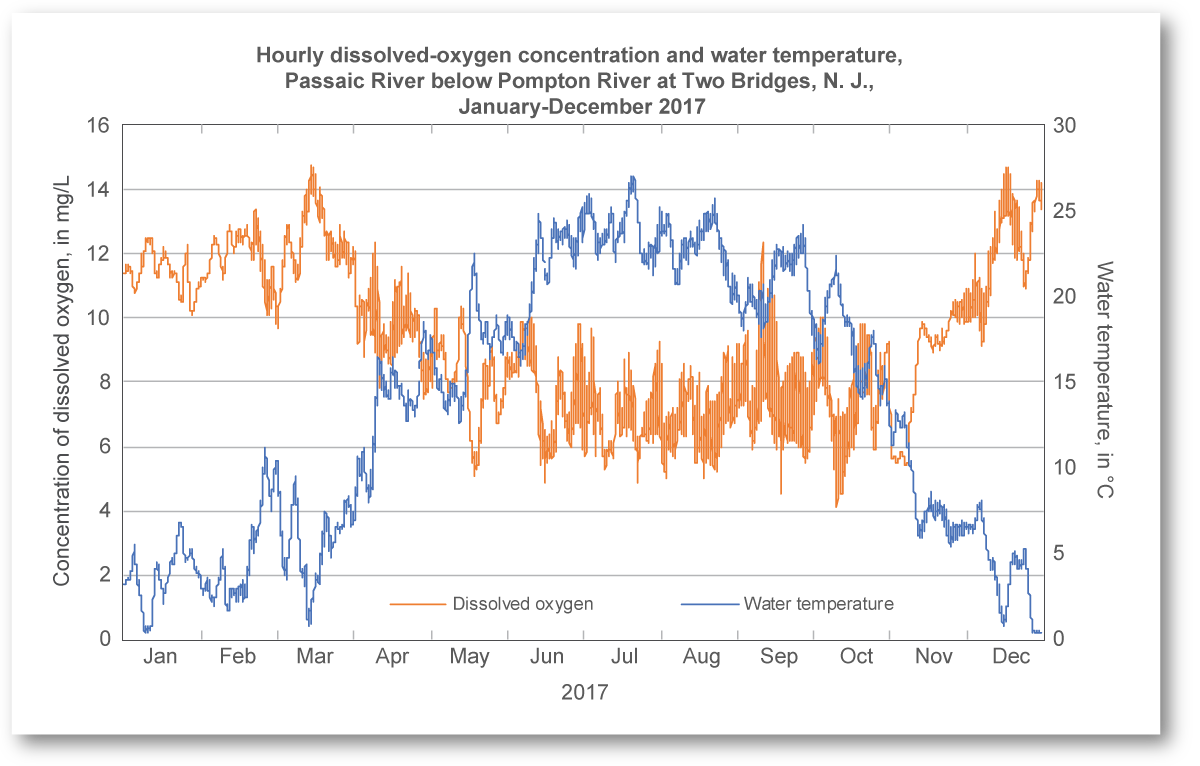
Trash, sediments, and thermal pollution arise from physical sources of pollution (figure \(\PageIndex{h}\)). Trash was discussed extensively in Solid Waste Management. Excess sediments enter bodies of water when various land uses, such as mining, deforestation, and agriculture increases erosion. Sediments can carry toxins or excess nutrients with them, and they cloud the water (resulting in turbidity). Turbidity obstructs aquatic plants from accessing sufficient sunlight. Thermal pollution occurs when water temperature exceeds its natural range. Many power plants (such as coal, natural gas, nuclear, etc.) rely on water from the environment for cooling. This water is released back into bodies of water at a higher temperature than usual. High temperature disrupt aquatic organisms for several reasons; one is that warmer waters cannot hold as much dissolved oxygen (see below; figure \(\PageIndex{i}\)). Dams can also raise water temperature to the detriment or the organisms that live there.
Biochemical Oxygen Demand, Hypoxia, and Eutrophication
Oxygen-demanding waste is an extremely important pollutant to ecosystems. Most surface water in contact with the atmosphere has a small amount of dissolved oxygen, which is needed by aquatic organisms for cellular respiration. Decomposers, such as bacteria and fungi, also conduct cellular respiration and consume oxygen as they break down dead organic matter.
Too much decaying organic matter in water is a pollutant because it removes oxygen from water, which can kill fish, shellfish, and aquatic insects. The amount of oxygen used by aerobic (in the presence of oxygen) decomposition of organic matter is called biochemical oxygen demand (BOD). The major source of dead organic matter in many natural waters is sewage; grass and leaves are smaller sources.
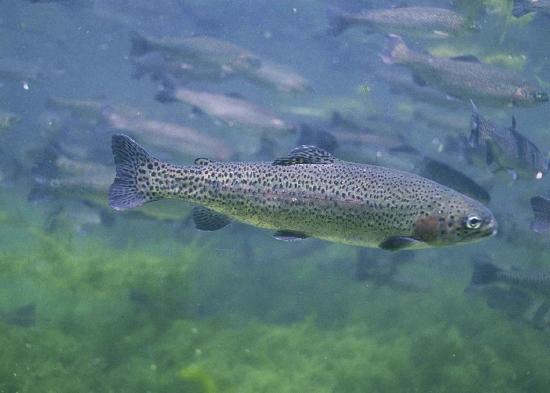
An unpolluted water body with respect to BOD is a turbulent river that flows through a natural forest. Turbulence continually brings water in contact with the atmosphere where the dissolved oxygen content is restored. The dissolved oxygen content in such a river ranges from 10 to 14 ppm. When biological oxygen demand is low, clean-water fish such as trout thrive (figure \(\PageIndex{j}\)).
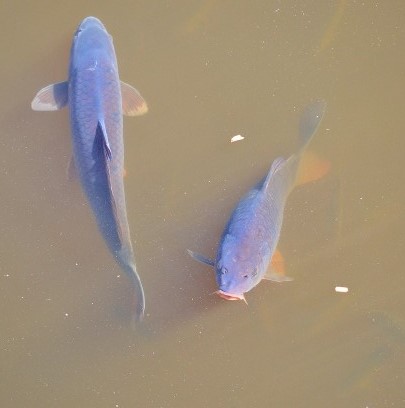
A polluted water body with respect to BOD is a stagnant, deep lake in an urban setting with a combined sewer system. This system favors a high input of dead organic carbon from sewage overflows and limited chance for water circulation and contact with the atmosphere. In such a lake, the dissolved oxygen content is ≤ 5 ppm. Biological oxygen demand is high, and fish tolerant to low oxygen levels, such as carp and catfish dominate (figure \(\PageIndex{k}\)).
Excessive nutrients, particularly nitrogen (N) and phosphorous (P), are pollutants closely related to oxygen-demanding waste. Plants and algae require 15-20 nutrients for growth, most of which are plentiful in water. Nitrogen and phosphorus are called limiting nutrients, however, because they usually are present in water at low concentrations and therefore restrict the total amount of plant growth. This explains why nitrogen and phosphorus are major ingredients in most fertilizer.
High concentrations of limiting nutrients, particularly nitrogen (N) and phosphorous (P), from human sources (mostly agricultural and urban runoff including fertilizer, sewage, and phosphorus-based detergent) can cause cultural eutrophication, which leads to the rapid growth of aquatic producers, particularly algae. Thick mats of floating algae or rooted plants lead to a form of water pollution that damages the ecosystem by clogging fish gills and blocking sunlight (figure \(\PageIndex{k}\)). A small percentage of algal species produce toxins that can kill animals, including humans. Exponential growths of these algae are called toxic algal blooms.
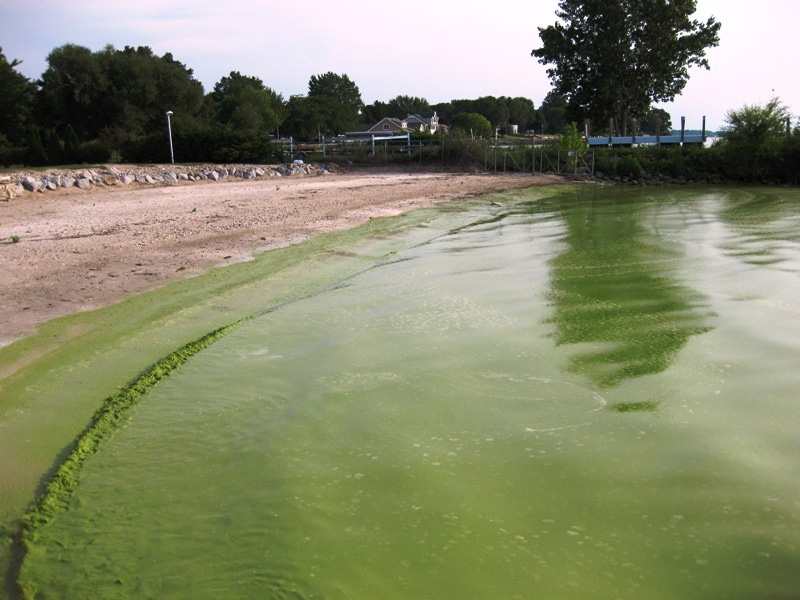
When the prolific algal layer dies, it becomes oxygen-demanding waste, which can create very low oxygen concentrations in the water (< 2 ppm), a condition called hypoxia. This results in a dead zone because it causes death from asphyxiation to organisms that are unable to leave that environment (figure \(\PageIndex{l}\)). Approximately 50% of lakes in North America, Europe, and Asia are negatively impacted by eutrophication. Eutrophication and hypoxia are difficult to combat because they are caused primarily by nonpoint source pollution, which is difficult to regulate, and nitrogen and phosphorus are difficult to remove from wastewater.
Attributions
Modified by Melissa Ha from the following sources:
- Water Contamination from An Introduction to Geology by Johnson et al. (licensed under CC-BY-NC-SA)
- Water Pollution from Environmental Biology by Matthew R. Fisher (licensed under CC-BY)
- The Industrialization of Nature: A Modern History (1500 to the present) from Sustainability: A Comprehensive Foundation by Tom Theis and Jonathan Tomkin, Editors. Download for free at CNX. (licensed under CC-BY)