
10.3: Membrane Bilayer and Monolayer Assemblies - Structures and Dynamics
- Page ID
- 21019


\( \newcommand{\vecs}[1]{\overset { \scriptstyle \rightharpoonup} {\mathbf{#1}} } \)
\( \newcommand{\vecd}[1]{\overset{-\!-\!\rightharpoonup}{\vphantom{a}\smash {#1}}} \)
\( \newcommand{\dsum}{\displaystyle\sum\limits} \)
\( \newcommand{\dint}{\displaystyle\int\limits} \)
\( \newcommand{\dlim}{\displaystyle\lim\limits} \)
\( \newcommand{\id}{\mathrm{id}}\) \( \newcommand{\Span}{\mathrm{span}}\)
( \newcommand{\kernel}{\mathrm{null}\,}\) \( \newcommand{\range}{\mathrm{range}\,}\)
\( \newcommand{\RealPart}{\mathrm{Re}}\) \( \newcommand{\ImaginaryPart}{\mathrm{Im}}\)
\( \newcommand{\Argument}{\mathrm{Arg}}\) \( \newcommand{\norm}[1]{\| #1 \|}\)
\( \newcommand{\inner}[2]{\langle #1, #2 \rangle}\)
\( \newcommand{\Span}{\mathrm{span}}\)
\( \newcommand{\id}{\mathrm{id}}\)
\( \newcommand{\Span}{\mathrm{span}}\)
\( \newcommand{\kernel}{\mathrm{null}\,}\)
\( \newcommand{\range}{\mathrm{range}\,}\)
\( \newcommand{\RealPart}{\mathrm{Re}}\)
\( \newcommand{\ImaginaryPart}{\mathrm{Im}}\)
\( \newcommand{\Argument}{\mathrm{Arg}}\)
\( \newcommand{\norm}[1]{\| #1 \|}\)
\( \newcommand{\inner}[2]{\langle #1, #2 \rangle}\)
\( \newcommand{\Span}{\mathrm{span}}\) \( \newcommand{\AA}{\unicode[.8,0]{x212B}}\)
\( \newcommand{\vectorA}[1]{\vec{#1}} % arrow\)
\( \newcommand{\vectorAt}[1]{\vec{\text{#1}}} % arrow\)
\( \newcommand{\vectorB}[1]{\overset { \scriptstyle \rightharpoonup} {\mathbf{#1}} } \)
\( \newcommand{\vectorC}[1]{\textbf{#1}} \)
\( \newcommand{\vectorD}[1]{\overrightarrow{#1}} \)
\( \newcommand{\vectorDt}[1]{\overrightarrow{\text{#1}}} \)
\( \newcommand{\vectE}[1]{\overset{-\!-\!\rightharpoonup}{\vphantom{a}\smash{\mathbf {#1}}}} \)
\( \newcommand{\vecs}[1]{\overset { \scriptstyle \rightharpoonup} {\mathbf{#1}} } \)
\(\newcommand{\longvect}{\overrightarrow}\)
\( \newcommand{\vecd}[1]{\overset{-\!-\!\rightharpoonup}{\vphantom{a}\smash {#1}}} \)
\(\newcommand{\avec}{\mathbf a}\) \(\newcommand{\bvec}{\mathbf b}\) \(\newcommand{\cvec}{\mathbf c}\) \(\newcommand{\dvec}{\mathbf d}\) \(\newcommand{\dtil}{\widetilde{\mathbf d}}\) \(\newcommand{\evec}{\mathbf e}\) \(\newcommand{\fvec}{\mathbf f}\) \(\newcommand{\nvec}{\mathbf n}\) \(\newcommand{\pvec}{\mathbf p}\) \(\newcommand{\qvec}{\mathbf q}\) \(\newcommand{\svec}{\mathbf s}\) \(\newcommand{\tvec}{\mathbf t}\) \(\newcommand{\uvec}{\mathbf u}\) \(\newcommand{\vvec}{\mathbf v}\) \(\newcommand{\wvec}{\mathbf w}\) \(\newcommand{\xvec}{\mathbf x}\) \(\newcommand{\yvec}{\mathbf y}\) \(\newcommand{\zvec}{\mathbf z}\) \(\newcommand{\rvec}{\mathbf r}\) \(\newcommand{\mvec}{\mathbf m}\) \(\newcommand{\zerovec}{\mathbf 0}\) \(\newcommand{\onevec}{\mathbf 1}\) \(\newcommand{\real}{\mathbb R}\) \(\newcommand{\twovec}[2]{\left[\begin{array}{r}#1 \\ #2 \end{array}\right]}\) \(\newcommand{\ctwovec}[2]{\left[\begin{array}{c}#1 \\ #2 \end{array}\right]}\) \(\newcommand{\threevec}[3]{\left[\begin{array}{r}#1 \\ #2 \\ #3 \end{array}\right]}\) \(\newcommand{\cthreevec}[3]{\left[\begin{array}{c}#1 \\ #2 \\ #3 \end{array}\right]}\) \(\newcommand{\fourvec}[4]{\left[\begin{array}{r}#1 \\ #2 \\ #3 \\ #4 \end{array}\right]}\) \(\newcommand{\cfourvec}[4]{\left[\begin{array}{c}#1 \\ #2 \\ #3 \\ #4 \end{array}\right]}\) \(\newcommand{\fivevec}[5]{\left[\begin{array}{r}#1 \\ #2 \\ #3 \\ #4 \\ #5 \\ \end{array}\right]}\) \(\newcommand{\cfivevec}[5]{\left[\begin{array}{c}#1 \\ #2 \\ #3 \\ #4 \\ #5 \\ \end{array}\right]}\) \(\newcommand{\mattwo}[4]{\left[\begin{array}{rr}#1 \amp #2 \\ #3 \amp #4 \\ \end{array}\right]}\) \(\newcommand{\laspan}[1]{\text{Span}\{#1\}}\) \(\newcommand{\bcal}{\cal B}\) \(\newcommand{\ccal}{\cal C}\) \(\newcommand{\scal}{\cal S}\) \(\newcommand{\wcal}{\cal W}\) \(\newcommand{\ecal}{\cal E}\) \(\newcommand{\coords}[2]{\left\{#1\right\}_{#2}}\) \(\newcommand{\gray}[1]{\color{gray}{#1}}\) \(\newcommand{\lgray}[1]{\color{lightgray}{#1}}\) \(\newcommand{\rank}{\operatorname{rank}}\) \(\newcommand{\row}{\text{Row}}\) \(\newcommand{\col}{\text{Col}}\) \(\renewcommand{\row}{\text{Row}}\) \(\newcommand{\nul}{\text{Nul}}\) \(\newcommand{\var}{\text{Var}}\) \(\newcommand{\corr}{\text{corr}}\) \(\newcommand{\len}[1]{\left|#1\right|}\) \(\newcommand{\bbar}{\overline{\bvec}}\) \(\newcommand{\bhat}{\widehat{\bvec}}\) \(\newcommand{\bperp}{\bvec^\perp}\) \(\newcommand{\xhat}{\widehat{\xvec}}\) \(\newcommand{\vhat}{\widehat{\vvec}}\) \(\newcommand{\uhat}{\widehat{\uvec}}\) \(\newcommand{\what}{\widehat{\wvec}}\) \(\newcommand{\Sighat}{\widehat{\Sigma}}\) \(\newcommand{\lt}{<}\) \(\newcommand{\gt}{>}\) \(\newcommand{\amp}{&}\) \(\definecolor{fillinmathshade}{gray}{0.9}\)-
Describe Membrane Bilayer Composition and Organization:
• Explain the structural organization of a membrane bilayer, including the roles of amphiphilic lipids, peripheral and integral membrane proteins, and carbohydrate attachments. -
Understand Lipid Distribution in Cells:
• Interpret data on lipid composition across various cellular compartments (e.g., nucleus, mitochondria, ER, plasma membrane) and explain the significance of asymmetry between the inner and outer leaflets of membranes. -
Explain Lipid Synthesis and Trafficking:
• Describe the biosynthetic pathways and cellular locations (primarily the ER) for lipid production and how these pathways contribute to the proper distribution and asymmetric arrangement of lipids in membranes. -
Analyze Membrane Dynamics:
• Discuss the dynamic nature of membranes by explaining lateral diffusion, flip-flop (transverse) diffusion, and the roles of specific enzymes (flippases, floppases, and scramblases) in maintaining lipid asymmetry. -
Interpret Thermodynamic Principles in Membrane Assembly:
• Apply the concepts of Gibbs free energy (ΔG), enthalpy, and entropy to explain the spontaneous formation of micelles, bilayers, and other lipid aggregates, including the role of the critical micelle concentration (CMC). -
Differentiate Lipid Phases and Phase Transitions:
• Compare different phases of lipid bilayers (gel, liquid crystalline, liquid-ordered, and liquid-disordered) and describe how factors such as temperature, lipid saturation, and cholesterol content affect membrane fluidity and permeability. -
Evaluate the Role of Cholesterol in Membrane Structure:
• Explain how cholesterol modulates membrane fluidity and stability, influences phase behavior, and contributes to the formation of lipid rafts and nanodomains. -
Understand Lipid Rafts and Nanodomains:
• Describe the concept of lipid rafts, their composition (enriched in sphingolipids, cholesterol, and specific proteins), and their role in organizing membrane domains and facilitating signal transduction. -
Interpret Lipid Phase Diagrams:
• Analyze phase diagrams for lipid mixtures (e.g., DPPC with cholesterol) to understand how temperature and lipid composition dictate membrane phase behavior and coexistence of different phases. -
Explore Membrane Curvature and Nonplanar Structures:
• Explain how lipids contribute to nonplanar membrane geometries, such as vesicles, tubular structures, and hexagonal phases, and discuss their biological relevance in processes like fusion, fission, and organelle biogenesis. -
Examine Dynamic Membrane Events:
• Discuss dynamic events such as membrane trafficking, vesicle fusion/fission, and the insertion of membrane proteins, and explain how these processes are driven by both physical forces and protein-mediated mechanisms. -
Introduce Lipid Signaling Pathways:
• Describe how enzymatic cleavage of specific membrane lipids produces secondary messengers that participate in intracellular signaling, linking membrane composition to cellular responses. -
Differentiate Lipid Droplets and Lipoproteins:
• Compare the structures and functions of lipid droplets and lipoproteins, including their formation (e.g., budding from the ER), composition (monolayer vs. bilayer), and roles in energy storage and lipid transport.
These learning goals provide a roadmap for understanding how lipid structure and dynamics underpin membrane function and cellular processes, preparing you for more detailed studies of membrane biochemistry and lipid signaling in advanced topics.
An overview of lipid bilayers
A membrane bilayer consists of more than just two leaflets of amphiphilic molecules. It also contains membrane proteins (which we will discuss in the next chapter), which can also be attached to carbohydrates. Most assuredly, you have seen various representations of a bilayer before. Before we proceed with a more detailed description of the lipids in the bilayer and their associated properties, we present Figure \(\PageIndex{1}\) to focus our discussion.

To understand the movement of lipids in an actual cell, a better understanding of lipid synthesis and trafficking in cells is important. Table \(\PageIndex{1}\) below shows the distribution of four classes of lipids in a macrophage, a type of immune cell (Andreyev, A.Y. et al), while the following figure shows the lipid composition of membrane organelles.
| Lipid Categories | Nucleus | Mitochondria | ER | Plasma Memb | microsome | cytosol | Whole cell |
|---|---|---|---|---|---|---|---|
| Glycero-phospholipids | 149 | 152 | 150 | 151 | 142 | 109 | 155 |
| Prenol lipids | 5 | 5 | 5 | 5 | 5 | 5 | 5 |
| Sphingolipids | 48 | 47 | 48 | 48 | 48 | 47 | 48 |
| Sterol lipids | 13 | 12 | 12 | 13 | 11 | 5 | 12 |
| Total | 215 | 216 | 215 | 217 | 206 | 166 | 220 |
Lipids in membranes are often distributed asymmetrically. A biological membrane's inner and outer leaflets usually have different PL compositions. For example, the outer leaflet in red blood cell membranes is composed mostly of sphingomyelin (SM) and PC. In contrast, the inner leaflet is composed mostly of PE and phosphatidyl serine (PS). This phospholipid contains the amino acid serine linked through its side chain (-CH2OH) to phosphate in position 3 of diacylglycerol. With a negative charge on the phosphate and carboxylate and a positive charge on the amine of PS, this phospholipid is acidic with a net negative charge. All the PS is located in the inner leaflet! This observation will become important later on when we discuss programmed cell death. A dying cell will expose PS in the outer leaflet. This is one of the markers of a dying cell. Table \(\PageIndex{2}\) below shows the membrane lipid composition in an average mammalian cell.
| Lipid | % |
|---|---|
| PC | 45-55 |
| PE | 15-25 |
| PI | 10-15 |
| PS | 5-10 |
| PA | 1-2 |
| SM | 5-10 |
| cardiolipin (bis-PG) | 2-5 |
| cholesterol | 10-20 |
Lipid membranes also surround a variety of intracellular organelles found in eukaryotic cells. As a refresher, Figure \(\PageIndex{2}\) shows the anatomy of a typical eukaryotic cell with its variety of intracellular organelles.

Figure \(\PageIndex{3}\) shows the average distribution of membrane lipids in different eukaryotic organelles.

Figure \(\PageIndex{4}\), our last overview, shows the location of lipid synthesis and the resulting distribution of lipids in each leaflet. Note that most lipids are synthesized in the endoplasmic reticulum (ER).

Dynamics of Membrane Bilayers
Molecules are not static but rather are dynamic. This also applies to molecular aggregates. In the first part of the section, we will discuss the rigid movement of whole lipid molecules in a bilayer, within a leaflet, and between leaflets. In the second part and the following supplement, we will consider the movement of atoms within a molecule. The movements include motions like bond bending, bond stretching, and torsion angle changes, as we saw in the previous chapter on the conformations of n-butane. The position of all atoms within a molecule can be simulated as a function of time - a molecular dynamics simulation. Such motions affect the molecule's energy, which can be calculated using classical molecular mechanics and electrostatics for given atom positions.
Liposomes and bilayers in general must be somewhat dynamic; otherwise, they would be impenetrable barriers across which nothing could pass. Cell membranes must separate the outside of a cell from the inside, but they must also allow the passage of molecules and ions across the membrane. What is the evidence that membranes are dynamic?
First, lipids can diffuse laterally in the membrane. This can be shown as follows. Make a liposome from phosphatidylethanolamine, PE, which has been labeled with TNBS (trinitrobenzene sulfonate). The NH2 on the head group of PE can attach the TNBS, which undergoes nucleophilic aromatic substitution with the expulsion of the SO32-. The TNB group attached to the PE head group absorbs UV light and emits light of a higher wavelength in a process called fluorescence. Next, the fluorescence intensity of a surface region can be recorded using a fluorescent microscope. Then, a laser shines on a small area of the surface, which can photobleach the fluorescence in the area. Over time, fluorescence can be detected from the region again. The rate at which it returns measures the lateral diffusion of the labeled lipids into the region. Lipids can undergo lateral diffusion at a rate of about 2 mm/s. This implies that the lipids can transit the surface of a bacterium in 1 sec.
Transverse or flip-flop diffusion (movement of a phospholipid from one leaflet to the other, not within a given leaflet) should be more difficult. Experimentally, this is investigated as shown in the diagrams below.
Flip-Flop Diffusion in Liposomes: To test flip-flop diffusion in an artificial membrane, liposomes are made with a mixture of PC and a PC derivative with a nitroxide spin label (has a single unpaired electron) as shown in Figure \(\PageIndex{5}\).

Both the inner and outer leaflets of the membrane have the labeled PC. Like a proton in NMR spectroscopy, a single electron has a spin that can give rise to an electron-spin resonance (ESR) signal (as a proton gives rise to a nuclear magnetic resonance signal) when irradiated with the appropriate frequency electromagnetic radiation (microwave frequency for ESR, radio frequency for NMR) in the presence of a magnetic field. The ESR signal is determined. Ascorbic acid, a water-soluble vitamin and antioxidant/ reducing agent, is added to the liposomes. This reduces the spin-labeled PC in the outer leaflet but not the inner leaflet of the bilayer since ascorbic acid can not enter the liposome or otherwise interact with it. This reduces the ESR signal to a lower, constant value.
The sample is divided into two. One sample is left at 0 oC, while the other is raised to 30 oC. The ESR signal is recorded as a function of time. The 0 oC prep shows no change in ESR with time, while the 30 oC prep ESR signal decreases with time. This decrease results from flip-flop diffusion of labeled PC from the inner leaflet to the outer and subsequent reduction by ascorbic acid. These experiments in experimental bilayer systems like liposomes show that flip-flop diffusion is orders of magnitude slower than lateral diffusion.
Flip-Flop Diffusion in Bacterial Cells
An analogous experiment can be done with bacteria. Radiolabeled 32PO4- is added to cells for one minute, which leads to the labeling of newly synthesized phospholipid (PL) located in the inner leaflet. The cells are then split into two samples. One sample is reacted immediately with TNBS, which will label only PE in the outer leaflet. The other sample is incubated for 3 minutes (to allow PL synthesis) and then reacted with TNBS. This is shown in Figure \(\PageIndex{6}\).

After a short labeling period, the cells are destroyed by adding organic solvents, which prevents the biosynthesis of new lipids. The lipids are extracted into the solvent and then subjected to TLC.
The lipids can be labeled in three ways. Some will be labeled with 32P alone, some with TNBS alone, and some with both 32P and TNBS. TLC (or other techniques such as HPLC or GC) can easily separate PC and TNBS-labeled PC since they have different structures and will migrate to different places on a TLC plate. No chromatographic technique could separate PC and 32P-PC since their molecular structure is the same, the only difference being in the P nuclei (different number of neutrons).
Those lipids with double labels (TNB and 32P) must have flipped from the inner leaflet to the outer leaflet, where they could be labeled with TNBS. The cells incubated for 3 minutes before the addition of TNBS have a much higher level of doubly labeled PLs. Quantifying these data as a function of differing times of incubation at elevated temperatures shows that the rate of flip-flop diffusion is much higher in cells than in liposomes, which suggests that the process is catalyzed, presumably by a protein transporter (flippase or Transbilayer amphipath transporter - TAT) in cells.
Different enzymes catalyze the movement of lipids in bilayers, including flippases, floppases, and scramblases, as illustrated in Figure \(\PageIndex{7}\). Most require ATP hydrolysis for the physical movement of the lipid across leaflets.

Figure \(\PageIndex{8}\) shows an interactive iCn3D model of a human plasma membrane phospholipid flippase with bound phosphatidylserine (PS) shown in spacefill.
.png?revision=1&size=bestfit&width=290)
 Figure \(\PageIndex{8}\): Human plasma membrane phospholipid flippase with bound phosphatidylserine (6lkn) (Copyright; author via source).
Click the image for a popup or use this external link:https://structure.ncbi.nlm.nih.gov/i...kcJeKtZGDa53W6
The iCn3D model below shows the structure of a human plasma membrane phospholipid flippase with bound phosphatidylserine (PS) shown in spacefill. This protein moves PS from the outer to the inner plasma membrane leaflet, maintaining its asymmetric distribution. The other common aminophospholipid, PE, is predominantly found in the inner leaflet. In contrast, PC and SM are found predominantly in the outer leaflet. The movement of PS is from a low to a high concentration and requires ATP. A build-up of PS in the outer leaflet is one signal that initiates programmed cell death (apoptosis) in the cell. Clotting is also initiated when cellular damage leads to exposed PS.
Flippases are proteins that move lipids from the outer to the inner leaflet, while floppases move them from the inner to the outer leaflet. Most are also ATPases. Both promote lipid asymmetry in the membrane, and floppases also help move lipids out of the cell. Scramblases move lipids in either direction and break the asymmetry of the lipid distribution. They are important in signaling. For example, they are used to expose phosphatidylserine to the outer leaflet, which promotes programmed cell death.
Here are links to iCn3D models of
- a floppase MsbA (6BPP)
- scramblase (6P49 AND 7JLP)
Conformational Transitions in Bilayers
Suppose a vesicle preparation is placed in a sensitive calorimeter and the temperature is increased. The vesicle preparation absorbs a significant amount of heat at a temperature characteristic of the phospholipids that compose the vesicle. This is analogous to what would happen if solid water were heated. At the melting point of water, an increment of heat is required, the heat of fusion, to break H-bonds and cause melting. Likewise, the heat of vaporization is measured when H-bonds are broken on the liquid-gas transition. These transitions are associated with non-covalent processes, namely, breaking H-bonds. Graphs of heat absorbed (Q) as a function of temperature, or heat absorbed/T (i.e., the heat capacity) vs temperature for the melting and evaporation of water, are shown in Figure \(\PageIndex{9}\). These transitions occur at the melting point (TM) and the boiling point.

The bottom heat capacity graph is nothing more than the derivative curve (or slope at each point) of the Qabs curve!
Likewise, lipid vesicles undergo phase transitions comparable to the melting of water. One significant phase transition at a "melting point" (TM) = 42 0C can be seen in the graph of heat capacity vs temperature for vesicles made of DPPC, shown in Figure \(\PageIndex{10}\).
This transition is caused by conformational chains in the packing of the acyl chains of the phospholipids as the acyl chains change from trans to gauche conformations. These changes involve not the simple translation of lipid molecules within and between bilayers but rather the movement of atoms within the molecules. These kinds of motions can be modeled using molecular dynamics simulations. Before the transition, the acyl chains are more tightly packed in the gel phase, and after the transition, they are less tightly packed in the liquid crystalline phase since many chains are in the gauche conformation. A minor transition is also noted at around 36 0C. This is associated with changes in the orientation of head groups.
As with water going from ice to liquid, the vesicles remain intact after the phase transition. It's not like the transition of liquid water to the gas phase. Vesicles in the liquid crystalline phase are more fluid, dynamic, and permeable. Note that the liposomes have not been destroyed but have undergone a phase change, similar to ice melting into liquid water.
The lipid vesicle phases are named gel and liquid crystalline to reflect the rigidity of the bilayer.
- Gel phase (Lβ): In the gel phase, which is found at temperatures < TM, the lipids are ordered with maximal packing. The acyl chains in both leaflets can be tilted so that they align in a parallel fashion (as shown in the figure below) or in a cross-tilted fashion in which they tilt toward each other. In the gel phase, the lipids diffuse slowly. This phase is sometimes called the solid phase. The gel phase is favored by low temperature and high saturation of esterified fatty acids. Saturated PC bilayers give a gel phase in the lab,
- Liquid crystalline phase (Lα): In this liquid crystalline phase, which is found at temperatures> TM, some saturated acyl chains have undergone all-trans to gauche conformational changes. These introduce kinks into the chains, which reduce packing. The notation Lα is used for bilayers of pure lipids.
- Liquid crystalline ordered (L0 ) and Liquid crystalline disordered (Ld): These phases typically occur with the addition of relatively high amounts of cholesterol. Cholesterol modulates the fluidity of membranes, as we will see in a bit, and affects bilayer properties at temperatures both < and > TM. The L0 phase is often enriched in saturated (sphingo)lipids and cholesterol, while the Ld phase is often enriched in unsaturated glycerophospholipids. The liquid crystalline disordered (Ld ) has fast translational diffusion and lower order, while the Liquid crystalline ordered (L0) has fast diffusion with higher order.
Most membrane lipids in vivo contain unsaturated fatty acids, and specific lipids are used in given environments to avoid the gel phase. Figure \(\PageIndex{11}\) shows some of these phases

Figure \(\PageIndex{12}\) shows a snapshot of a molecular dynamics simulation of a bilayer in a gel (A) and liquid crystalline (B) phase. Note that the width of the liquid crystalline phase is smaller.

Vesicles of different PL have different TM as shown in Table \(\PageIndex{3}\) below.
| Lipid | TM | Lipid | TM |
|---|---|---|---|
| 12:0 PC | -1 | 12:0 PA | 31 |
| 14:0 PC | 23 | 14:0 PA | 50 |
| 16:0 PC | 41 | 16:0 PA | 67 |
| 18:0 PC | 55 | 18:0 PA | 76 |
| 18:1 PC | -20 | 18:1 PA | -8 |
| 18:2 PC | -53 | - | - |
| 18:3 PC | -60 | - | - |
Vesicles made from phospholipids with bigger head groups have a lower TM since they are less "stable". For example, the Tm for vesicles of di-16:0 versions of PA, PE, and PC have TMs of 67, 63, and 41 degrees C, respectively, as shown in Figure \(\PageIndex{13}\).

Cholesterol and Membrane Fluidity
Cholesterol is also a ubiquitous component of animal cell membranes. Its size will allow it to fit into either leaflet with its polar OH pointed to the outside. One function of cholesterol in membranes is to keep the membrane fluid at any reasonable temperature. When a membrane is at a temperature less than the TM, it is ordinarily in a gel, not a liquid crystalline phase. The cholesterol helps prevent the ordered packing of the acyl chains of the PLs, which increases their freedom of motion. Hence, the fluidity and permeability of the membrane are increased. At temperatures greater than the TM, the rigid ring of cholesterol reduces the freedom of the acyl chains to rotate. Hence, it decreases the number of chains in the gauche conformation. This decreases fluidity and permeability. Cholesterol affects membrane structure at temperatures both below and above the TM as
Figure \(\PageIndex{14}\) shows the results of a molecular dynamics simulation depicting the relative order in a DMPC membrane with and without cholesterol

Lipid Rafts and Nanodomains
Not only are lipids asymmetrically distributed between leaflets of a bilayer, but they are also distributed asymmetrically within a single leaflet. Certain lipids often cluster within a leaflet to form lipid "rafts," which can be considered to result from lateral phase separation of the lipids within one leaflet of the bilayer. Divalent cations like calcium, which can bind to negatively charged PLs like PS, can cause "rafts" of PS to form, giving rise to lateral asymmetry within a bilayer leaflet. Rafts also appear to be enriched in cholesterol and lipids with saturated fatty acids, especially sphingolipids, leading to regions of enhanced packing and reduced fluidity. Cholesterol would stabilize packing in spaces created with lipids with large head groups. You can think of these rafts as nanodomains, analogous to the domains we observed in protein structure.
Cholesterol appears to be a key player in the formation of lipid rafts. It is planar and inflexible and would pack better with saturated fatty acid chains. It could also induce them to elongate to form lower energy zig-zag structures in which all the methylene groups are anti. Lipid rafts represent a more ordered lipid phase (Lo) than the more disordered surrounding phase (Ld). Also, compared to the structure of glycerophospholipids, the atoms in the region linking the head group and the nonpolar fatty acid chains in sphingolipids have greater potential for H-bond interactions with cholesterol and other sphingolipids, as shown in Figure \(\PageIndex{15}\).

Rafts probably bind or exclude the binding of other biological molecules, like proteins. Some proteins are chemically modified with a glycosylphosphoinositol (GPI) group at the carboxy terminus. The PI group can insert into the membrane, anchoring the protein to the bilayer. Proteins also appear to induce raft formation. Lipid rafts appear to be enriched in glycosylphosphoinositol (GPI)-anchored proteins, as seen in Chapter 11.1. Recent studies have shown that the Ebola virus interacts with lipid rafts while entering and exiting the infected cell. Rafts are also involved in how cells sense and respond to their environment. Signaling molecules outside the cell can bind receptor proteins in the membrane. As we will see later, conformational changes in the receptor protein signal the inside of the cells that the receptor is bound with a ligand. Once bound, the receptor can move in the membrane and often cluster in outer leaflet rafts that contain cholesterol and sphingolipids. Inner leaflet rafts have also been observed. Figure \(\PageIndex{16}\) shows two versions of an animated lipid raft. The large shapes represent membrane proteins selectively found in the rafts. The most modern definition of a lipid raft is a nanoscale assembly of sphingolipids, cholesterol, and proteins that can be stabilized into platforms.
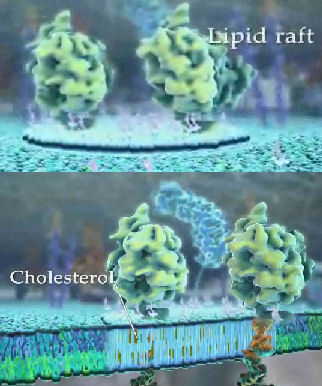
Figure \(\PageIndex{17}\) shows a simplified lipid raft model.
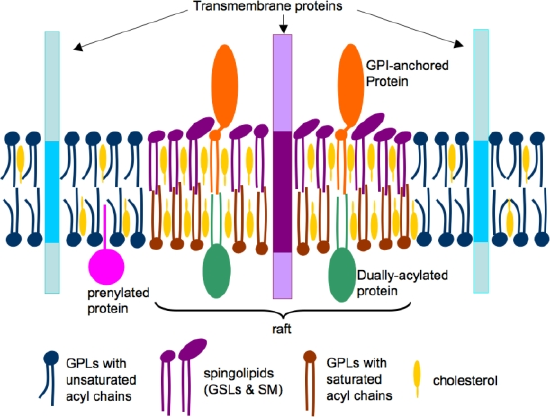
"The phospholipids (blue and brown) and cholesterol (yellow) are distributed in both the leaflets, whereas sphingolipids (violet) are enriched in the outer leaflet of the bilayer. The acyl chains of raft lipids are generally long and saturated (violet and brown). In contrast, those in non-raft domains are shorter and contain singly or multiply unsaturated acyl chains (blue). Raft domains contain concentrations of dually-acylated (green) and GPI-anchored (brown) proteins, whereas transmembrane (blue) and prenylated (green) proteins are usually non-raft associated."
In contrast to single proteins, for example, lipid bilayers are physical mixtures. In a thermodynamic sense, entropy would disfavor raft formation as random mixing is favored. Hence enthalpy must drive the interaction between neighboring molecules to produce nanodomains and rafts.
Lipid Phase Diagrams
You are familiar with the phase diagrams of water from introductory chemistry classes. Phase diagrams show the phases accessible under different conditions, such as temperature and pressure. Figure \(\PageIndex{18}\) shows a traditional phase diagram for water.
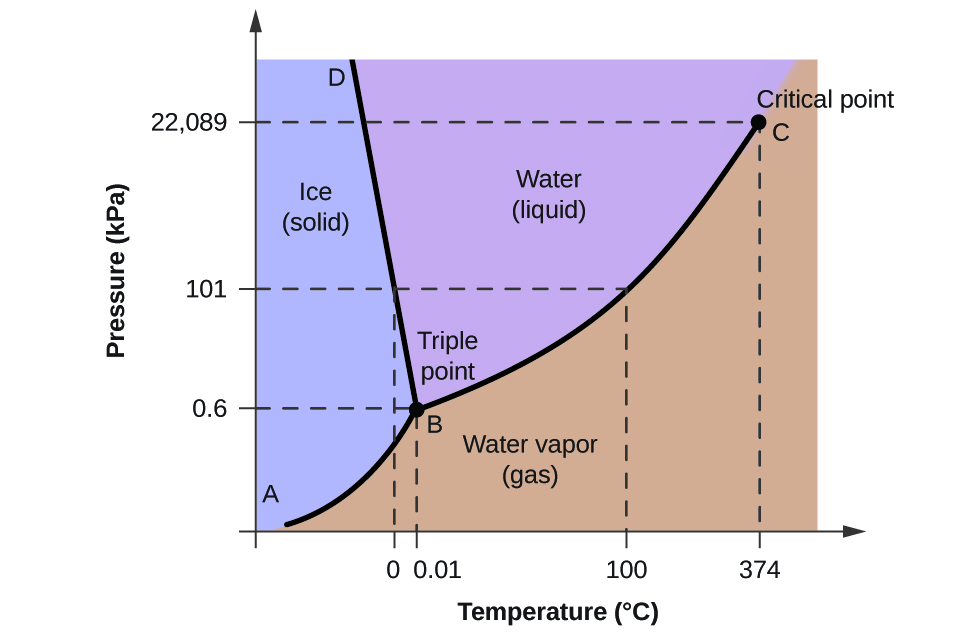
The horizontal dotted line at 101 kPa shows the states of water as a function of temperature at 101 kPa = 1 atm pressure. The phase transition of solid to liquid water occurs at 0 0C (freezing/melting point of water), while the liquid to gas transition occurs at 100 0C (boiling point of water). At a reduced pressure (0.6 atm), all three water phases can exist at 0.01 0C, the triple point of water.
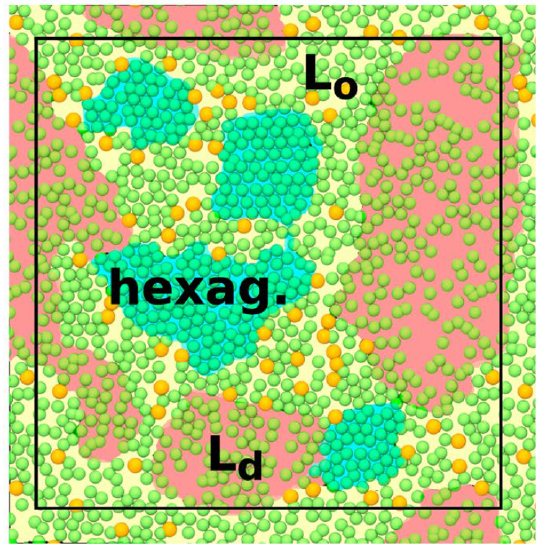
Analogously, lipid bilayers have phase transition diagrams as well. Instead of showing phases as a function of temperature and pressure, they are usually shown as a function of temperature and concentration of a specific lipid component such as cholesterol, which, as described above, affects TM, fluidity, and raft formation. An example of a theoretical phase diagram for membranes composed of saturated dipalmitoylphosphatidylcholine (16:0), the most common saturated fatty acid in animals, plants, and microorganisms, vs. cholesterol content is shown in Figure \(\PageIndex{19}\). This is a binary DPPC–cholesterol bilayer system.

Left Panel: Liquid–liquid coexistence is expected in the Ld + Lo regime (green). The Lo, Ld, gel, and gel + Lo regions are colored in yellow, blue, red, and orange, respectively. The locations of the simulated systems are shown by numbers (DPPC–cholesterol) and letters (pure DPPC). Their colors indicate their phases. Systems 3, 6, and 7 show heterogeneous behavior.
Right Panel: Snapshots of selected systems labeled by the points in the phase diagram: (8) Chol20 316 (Lo phase), Chol10 326 (Ld phase), Chol10 316 (ordered/disordered/hexagonal), DPPC is shown in cyan and lime (chains and other parts), and cholesterol in white. Water, ions, and lipid chain hydrogens are omitted for clarity. Red and blue boxes highlight disordered and ordered regions, respectively.
DPPC vesicles have a TM = 41 0C or 314 K. The phase diagrams show that when cholesterol is added to DPPC bilayers at temperatures above TM, the bilayers change from the liquid-disordered (Ld) phase to the uniform liquid-ordered (Lo) phase at around 20 mol% cholesterol. At cholesterol concentrations between around 10-20 mol% and temperatures just above the TM, the L0 and Ld phases coexist. The coexistence of two phases mimics a raft. At low cholesterol levels, the bilayer changes from the gel (or Lβ) to the Ld phase. At really high cholesterol, only the L0 phase exists. This makes sense as the fatty acids are all saturated. Cholesterol's rigid rings reduce the freedom of the acyl chains to rotation and hence decrease the number of chains in the gauche conformation. Yet, as an "impurity" (cholesterol) has been added to the system, the system is less rigid and more fluid-like. From 0-7 mol% cholesterol, two phases exist: the gel (or Lβ) and the Ld phase. Between 7-23 mol% cholesterol, a combination of phases is seen.
As mentioned above, the outer leaflet of mammalian plasma membranes is composed mostly of sphingomyelin (SM) and PC. In contrast, the inner leaflet is composed mostly of phosphatidyl ethanolamine (PE), phosphatidyl serine (PS), and cholesterol. These don't appear to separate into Ld and L0 phases and appear not to form nanodomains or rafts. In the lab, outer membrane lipids easily form vesicles, but the inner leaflet polyunsaturated PEs form other phases (hexagonal or cubic). It appears that asymmetric lipid distribution is critical for biological bilayer formation.
Since nanodomains are challenging to observe and study experimentally, molecular dynamics simulations provide insight into their structure and properties. The right-hand images show snapshots of the membrane from molecular dynamics simulations. Cholesterol is shown in white in Figure \(\PageIndex{19}\). 8 shows the membrane in the Lo phase, 5 shows it in the Ld phase (note the reduced membrane width), and 3 in an ordered (blue box) and disordered (red box) phase. The simulations support the theoretical phase diagram showing the coexistence of the Ld and L0 phases.
Also, a hexagonal-closest packed (also cholesterol-poor) region occurs in phase diagram regions showing the coexistence of both Ld and L0 phases. Cholesterol is excluded from most ordered regions. This is shown in Figure \(\PageIndex{20}\), showing a top-down view of the membrane. The dark blue lipid headgroups are hexagonally closest packed, an ideal you will remember from introductory chemistry courses. Cholesterol (yellow spheres) seems to be most prevalent in boundary regions.
Imagine a phase diagram for a three-component system (DOPC, sphingomyelin, and cholesterol) or even higher component systems! We won't show any, but from the "simple" two-component system described above, it should be evident that we have a long way to go before understanding the complexity of membrane bilayers.
The actual biological membrane must be able to adopt very nonplanar shapes with positive and negative curvature. Membranes must also be able to fuse (for example, the egg and sperm). Another lipid phase, which we have not yet discussed, may be involved. New lipid phases of a single membrane lipid can form based on the relative percentages of lipid and water. These include hexagonal phases. Figure \(\PageIndex{21}\) shows an image of a hexagonal phase of phosphatidylethanolamine with 16:0 fatty acids. Note the water inside the middle ring of PE molecules.

Figure \(\PageIndex{22}\) shows an interactive iCn3D model of the inner ring outlined in the red circle. Note that water surrounds each of the closest-packed lipid tubules, which extend back into the figure in 3D. This phase creates an aqueous channel through the interior of each tubule.
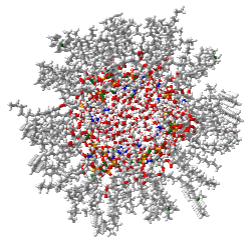
Figure \(\PageIndex{22}\): Hexagonal phase of phosphatidylethanolamine with 16:0 fatty acids (Copyright; author via source).
Click the image for a popup or use this external link: not available
Figure \(\PageIndex{23}\) shows variants of the hexagonal phase and a cubic phase of lipids.

Double-chain amphiphiles with a small polar head (like PE and PA) are more likely to form a hexagonal II phase with elongated tubules than are more cylindrical lipids like PC. Note that if a single fatty acid is removed from a double-chain amphiphile like PE, a narrow conical shape single-chain amphiphile arises, forming either a micelle (not shown) or a hexagonal I phase. In vitro, equimolar amounts of PC (which forms the lamellar phase) and PE (which can form an HII phase) can either form the HII phase (at low aqueous pressure) or a lamellar phase (at high aqueous pressure).
Are hexagonal lipid phases found in biological membranes? The answer is likely yes in the formation of unusual cellular structures. The plant plasmodesmata, shown in Figure \(\PageIndex{24}\), are one such structure. Just focus on the two bilayers connected by the membrane-lined membranes of the channel.

Figure \(\PageIndex{24}\): Plant plasmademata. Yanbiao Sun et al. https://www.nature.com/articles/s41438-019-0129-3. Creative Commons license. http://creativecommons.org/licenses/by/4.0/.
Plasmodesmata are membrane-lined channels that cut across the plant cell wall and directly connect cells, allowing the flow of water and nutrients between the cells. HII phases have been seen in the endoplasmic reticulum membrane. These membranes, along with the mitochondrial inner membrane and the inner membrane of chloroplasts, are highly curved and contain higher concentrations of lipids that allow for curvature and the formation of H II phases. The function of some membrane enzymes and processes, such as membrane fusion and fission, is enhanced by HII-forming lipids.
Piecing it all together
Our emerging understanding of lipid structure has taken us from micelles and vesicles to the complexity of actual biological membranes with different phases and nanodomain structures. This complexity is needed as membranes must be dynamic in ways that the proteins, for example, aren't. They must be able to pinch off either as extracellular or intracellular vesicles, for example, in exocytosis and endocytosis. Both positive and negative curvatures of the membrane must be enabled. The incredible complexity of the "Lego-like" lipid monomers that assemble and rearrange into every fluctuating membrane is yet another exquisite illustration of our repeated mantra that structures and shapes mediate all functions. The "Lego-like" membrane monomers in various phases and regions of membrane curvature are illustrated in Figure \(\PageIndex{25}\).

Given their shape, some glycerolipids don't even appear to form bilayers by themselves spontaneously. The shape and type of fatty acids found in the membrane lipids will determine the local properties of the membrane, its phases, and the presence of nanodomains. The activity of membrane enzymes and membrane fission and fusion events will also depend on the local properties of membranes. The figure above doesn't even account for the presence of peripheral and integral membrane proteins, which we will discuss in the next section.
As we learned with proteins, we can be misled by looking at beautiful but static images of proteins. Their dynamic motion is critical to their function. In addition to the dynamic membrane events discussed above, many other events take place at and in membranes. Here are a few.
Other dynamic events in bilayers
Membranes are not static. They are synthesized, their contents shuffled, fuse with other membranes, and large proteins are inserted into them. Let's explore some of these.
Membrane Trafficking
Movement of key "cargo" molecules into (endocytosis) and out of (exocytosis) the cells occurs mostly through membrane-encapsulated vesicles. Vesicles contain all types of biological molecules, including synthetic and absorbed lipids. Part of the differences in lipid composition between membrane layers and different organelles are derived from this highly orchestrated and controlled movement of vesicles. Details are shown in Figure \(\PageIndex{26}\)below.
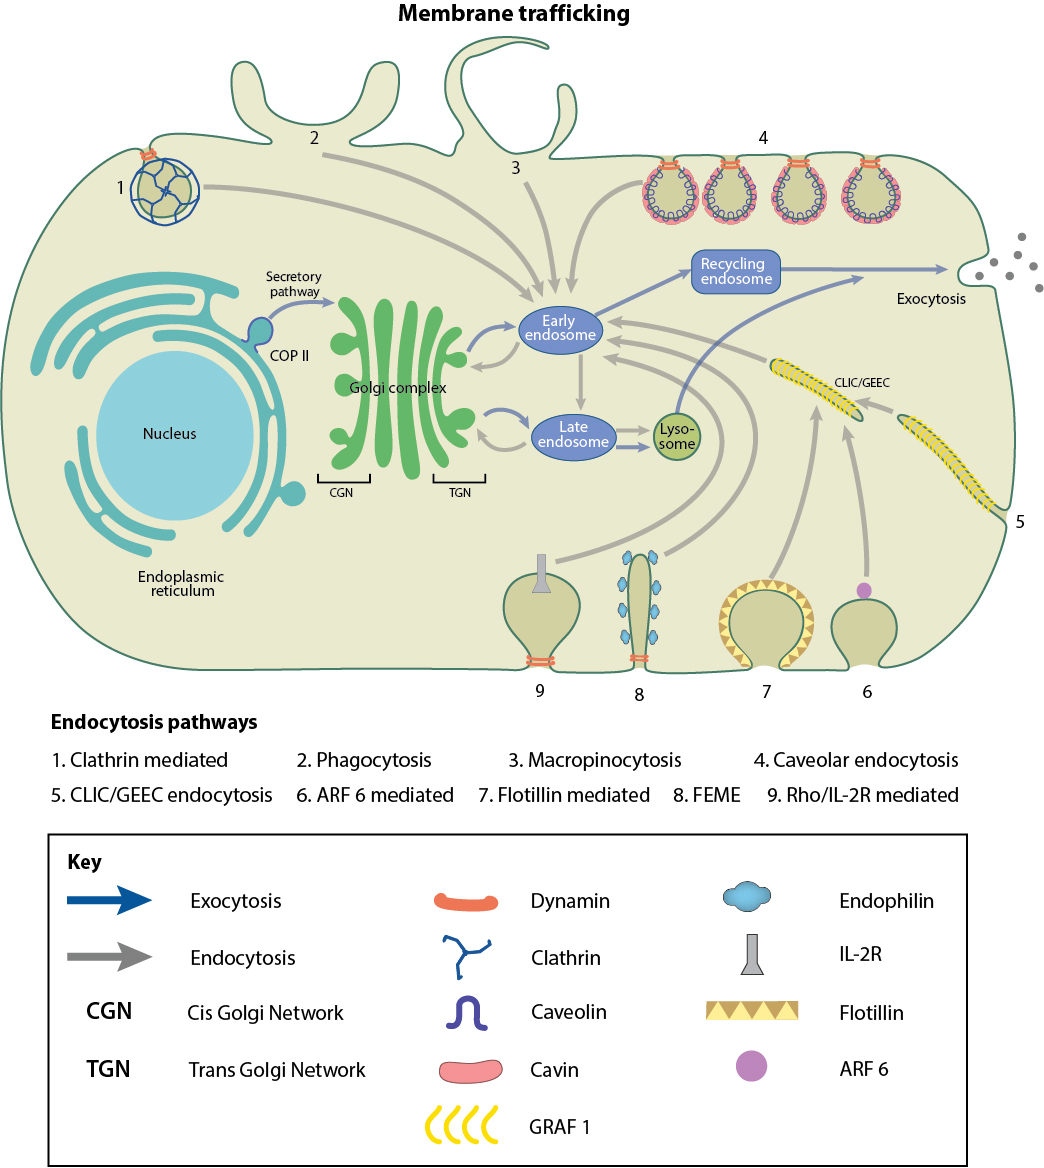
In eukaryotes, the biosynthetic secretory pathways move molecules from the endoplasmic reticulum to the cis Golgi (CGN) to the trans-Golgi (TGN) and the plasma membrane (for integral membrane proteins) or for secretion. Since most lipids are synthesized in the endoplasmic reticulum (ER), their distribution to different cell locations is critical in maintaining the asymmetric distribution of lipids found in cells.
Fusion of membranes: Fusion Peptides
Another dynamic event in membranes is the fusion of two bilayers from two different cell vesicles or of a vesicle and a cell membrane. Fusion peptides facilitate these events. Figure (\PageIndex{27}\) below shows a molecular dynamics simulation snapshot showing how a fusion peptide in a single DMPC bilayer causes a constriction of the bilayer with the two leaflets approaching each other.

Figure (\PageIndex{28}\) below shows the area per lipid (APL).

Insertion of Membrane Proteins
Another dynamic event is the insertion of a membrane protein. Now let's look at changes in the bilayer on insertion of the voltage-dependent anion channel (VDAC) membrane protein, as shown in Figure (\PageIndex{29}\) below.

Panel a shows the voltage-dependent anion channel (VDAC) in a cartoon β-barrel representation. Residue E73 and the water molecules nearby are represented as spheres. The ball and stick representation shows that serine and threonine residues constitute hydrophilic areas close to E73. The snapshot shows a DMPC lipid flipping close to the E73 and K110 residues.
Panel b shows top-view perspectives of the circular representation of the local thickness, calculated considering phosphorus atoms and area per lipid.
Introduction to Lipid Signaling - Chemical Cleavage of Membrane Lipids
Everything in this chapter so far describes the structure and dynamics of the lipid components of a bilayer. The dynamic changes described involve the physical movement of lipid molecules in the membrane. Let's briefly introduce another type of movement involving physical and chemical changes in the cell. What happens when specific lipids in membranes are chemically cleaved by lipases, enzymes that are analogous to proteases? It turns out these changes lead to signaling within the cell. We will only briefly introduce lipid signaling in this chapter, but explore it in more detail in Chapter 12.
Lipids are not just used as a passive component of membranes or as a source of stored energy. They are involved in signal transduction at the cell membrane, a process by which the interior components of the cell respond to a signal external to the cell, allowing the cell to respond to its local environment. Usually, a chemical signal on the outside of the cell is the "primary messenger" that causes the cell to respond. Usually, the chemical transmitter of information does not get into the cell. Rather, it binds to surface receptors on the cell membrane. Somehow, the cells sense that a ligand is bound to the outside. Enzymes, usually in the membrane or at the intracellular surface of the lipid bilayer, are activated. Many of these enzymes cleave lipids in the membrane. The cleaved fragments of the lipid molecules serve as intracellular signals or "secondary messengers," which can bind to intracellular enzymes to activate intracellular processes. Figure (\PageIndex{30}\) below shows some lipid mediators generated by the process and signal the cell to respond.

Figure (\PageIndex{30}\): Membrane lipids involved in signaling
Fatty acid amides are potent mediators of neurological processes. In one interesting experiment, sheep were sleep-deprived. Reasoning that the brain might release a biochemical signal into cerebrospinal fluid to induce sleep, scientists at Scripps removed some of this fluid. They isolated a substance that was not found in rested sheep. The structure was shown to be an amide of oleic acid on analysis. Oleylethanolamide has been shown to bind to the Peroxisome-Proliferator-Activated Receptor-a (PPAR-a) in the nucleus. By affecting gene transcription, this ligand appears to regulate body weight and the feeling of fullness after eating (satiety) as it leads to reduced eating.
People have sought the natural neurotransmitter, which binds to the same receptor in the brain as THC, the active ingredient of marijuana. The endogenous cannabinoid is an amide of arachidonic acid, anandamide. Figure (\PageIndex{31}\) below shows the structures of key fatty acid amides and THC.

Figure (\PageIndex{31}\): Fatty Acid Amides: Neurochemical Mediators
This fatty acid amide is an example of a class of lipid derivatives called N-acylethanolamines (NAEs). These molecules, with acyl groups that vary in the number of carbons and double bonds, are found widely in nature. Naturally occurring anandamide leads to increased food intake after a short period of reduced food intake. One of the known physiological effects of THC is increased food consumption (the munchies).
Lucanic et al (2011) have shown that decreases in NAEs extend the life span of the small roundworm C. elegans, which has become a model organism to study genes in eukaryotes. Caloric restriction has been shown to increase the life span in various organisms. In invertebrates, anandamide seems to inhibit food intake, even in organisms that lack a receptor similar to the one in which cannabinoids bind. This might seem paradoxical in that anandamide (and THC) in humans seems to induce eating. However, under long periods of caloric restriction (low-level starvation) in rats, anandamide levels are suppressed, leading to a state of low energy consumption.
In general, it appears that reductions in NAEs occur during periods of caloric restriction. Mutant worms that have reduced levels of NAEs through targeted enzyme disruptions that affected either NAE synthesis or degradation have longer life spans. If normal (wild-type) worms were placed under caloric restriction, but given EPA-ethanolamine (the most abundant NAE in these worms), they did not have an extended lifespan.
Membrane Monolayers - Lipid droplets and lipoproteins
We explored membrane bilayers that contain two leaflets above. These bilayers separate the outside and inside of cells and the outside and inside of internal organelles. It turns out that there are two main types of lipid-encapsulated structures in which only one phospholipid leaflet separates the interior contents from the outside. These are lipid droplets and lipoproteins. In both cases, the monolayers encapsulate TAGs and cholesterol esters - hydrophobic molecules, so there is no need for another inner leaflet to stabilize an encapsulated aqueous environment.
Lipid Droplet formation
So, how are triacylglycerols stored in cells? In lipid droplets! In contrast to the common single and double-chain amphiphiles, which have charged atoms in their head groups and which form micelles and bilayers, respectively, triacylglycerols (TAGs) and cholesterol esters (CEs), which are almost completely nonpolar, coalesce into lipid droplets in cells. These droplets can range from very big, which are found in adipocytes (fat cells), where they take up almost all of the available space and where they are used for energy storage, to small, which are found in all cells, where they are used mostly for membrane biogenesis and energy mobilization. When esterified into esters, fatty acids and steroids also exhibit reduced toxicity to cells. Lipid droplets are often found in close approximation or attachment to mitochondria, endoplasmic reticulum (ER), and peroxisomes (where plasmalogens with ether-linked fatty acid instead of ester-linked are synthesized), all organelles intimately involved in membrane and energy biochemistry. Many enzymes (acyltransferase, for example) required for TAG metabolism are found in the mitochondria and the ER.
Since lipid droplets are specialized for cells and don't form if TAGs are just added to water, we'll discuss their structures and their dynamic assembly in this section.
The droplets are now considered actual cellular organelles. In contrast to other organelles, which a bilayer member surrounds, lipid droplets are surrounded by a monolayer of phospholipids, which prevents exposure of the nonpolar contents to the aqueous cytoplasm. PC and PE appear to be the major phospholipids in the monolayer, and both are synthesized mostly in the ER. Many different proteins are involved in the formation and interaction with lipid drops, including
- perilipins: There are multiple types of perilipins. Perilipin 1 is found in adipocytes and cells synthesizing steroids (adrenals, ovaries, and testes). Perilipin 2 and 3 are found in most cells
- Acyl-CoA synthetases and acyltransferases: These enzymes activate free fatty acids for metabolic processes.
- seipins: These are involved in lipid droplet shape, number, and size. It appears to be involved in forming lipid drops and moving them from the ER to the cytoplasm. It facilitates the initiation of LD formation and ensures that vectorial budding of LDs from the ER is directed toward the cytoplasm.
It appears that lipid droplets arise from the ER, which is involved in membrane biogenesis and "trafficking" of membranes to different locations in the cell. A general structure of a lipid droplet is shown in Figure \(\PageIndex{32}\). The left figure shows just internal triacylglycerols (TAGs). The inside would also contain cholesterol ester (fatty acid esterified to the cholesterol OH), and the monolayer would contain unesterified cholesterol.

(\PageIndex{32}\): Cartoon view of a lipid droplet.
How might these complex lipid droplets form in a cell without phase separation? With the help of proteins, of course! Figure \(\PageIndex{31}\) shows how newly synthesized TAGs (made in the ER membrane) could self-aggregate in the bilayer to form a "lens" which, on further growth and addition of lipid binding proteins, could bud off into the cytoplasm to form the droplets.

Figure \(\PageIndex{33}\) shows an incredible image, produced by a molecular dynamics simulation, of diacylglycerols (DAG) accumulating in a bilayer to form a clear lens in the membrane.

Figure (\PageIndex{34}\) below shows a cartoon illustrating the synthesis of a lipid droplet from the ER membrane.

A membrane protein not displayed in the above figure, seipin, denotes the location for lipid droplet formation in the ER membrane. Mutants of the protein are associated with lipodystrophy. In yeast, seipin and another membrane protein, Ldb16, associate and facilitate lipid droplet formation. Seipin aggregates to form a homo 10-mer in the membrane, but in contrast to human cells, it alone can not concentrate triacylglycerol in the membrane. It requires the binding of Ldb16 for that to happen.
Figure (\PageIndex{35}\) below shows yeast, human, and fly seipin and their properties.

Figure (\PageIndex{35}\): Yeast, human, and fly seipin and their properties. Nat Commun 12, 5892 (2021). https://doi.org/10.1038/s41467-021-26162-6. Klug, Y.A., Deme, J.C., Corey, R.A. et al. Mechanism of lipid droplet formation by the yeast Sei1/Ldb16 Seipin complex. Creative Commons Attribution 4.0 International License. http://creativecommons.org/licenses/by/4.0/.
Panel A shows a lipophilicity potential on the surface of yeast (left), human (middle), and fly (right) as viewed as (i) homodecamer assembly from the cytosol, (ii) individual protomers, or (iii) transparent overlay over zoomed-in cartoon representation of the central α1-α2 helices. Surfaces are colored from hydrophilic (dark cyan) to hydrophobic (gold).
Panel B shows a side view of the luminal domains of yeast, human (PDB 6DS5), and fly (PDB 6MLU) Seipin in relation to the plane of the ER membrane (indicated by a dotted line).
Panel C shows the charge distribution of the yeast Sei1 central helices (α1, α2), depicted as a transparent Coulombic electrostatic potential surface representation (Red, negative charge; blue, positive charge; white, no charge) overlayed over a cartoon representation (light blue) to show acidic side chains.
Panel D shows a top view of molecular dynamics simulations of Sei1 in a POPC membrane with 3% trioleylglycerol. Images depict the average lipid number density of trioleylglycerol. Inset – zoom of the corresponding box showing positions of TM1 and TM2.
The lumenal domains form the ring with a floor, as shown in Panel A above. In addition, the transmembrane segments for the cage top and sides. A switch area between the lumenal and transmembrane segments occupying two different conformations appears important for function. The closed cage allows accumulation and hence phase-separation of triacylglycerols, while the open form allows the nascent droplet to grow and then bud.
The Ldb16 has helical regions enriched in serine and threonine, as is required for TAG loading. These -OH-containing amino acids are present in seipins in humans and flies. Site-specific mutations of the serine and threonines in the region of Ldb16 lead to problems with lipid droplet formation.
Figure (\PageIndex{36}\) below shows a cartoon of the serine- and threonine-enriched helix in Ldb16.

Figure (\PageIndex{36}\): Cartoon of Ldb16 predicted helix enriched in serine and threonine. Klug et al., ibid.
Another model for the assembly of lipid droplets by the Sei1-Ldb16 yeast complex is shown in Figure (\PageIndex{37}\) below.

Figure (\PageIndex{37}\): Sequential TAG interactions mediate LD assembly by the Sei1-Ldb16 complex. In the ER bilayer, TAG molecules (blue) concentrate near Seipin oligomers (orange) via weak interaction with Sei1 TMs. TAG molecules within the ring interact strongly with Ldb16 (green) hydroxyl-containing residues, facilitating TAG coalescence and lens formation. Klug et al., ibid.
Figure \(\PageIndex{38}\) shows an interactive iCn3D model of the homo 10-mer yeast seipin membrane complex (7OXP).
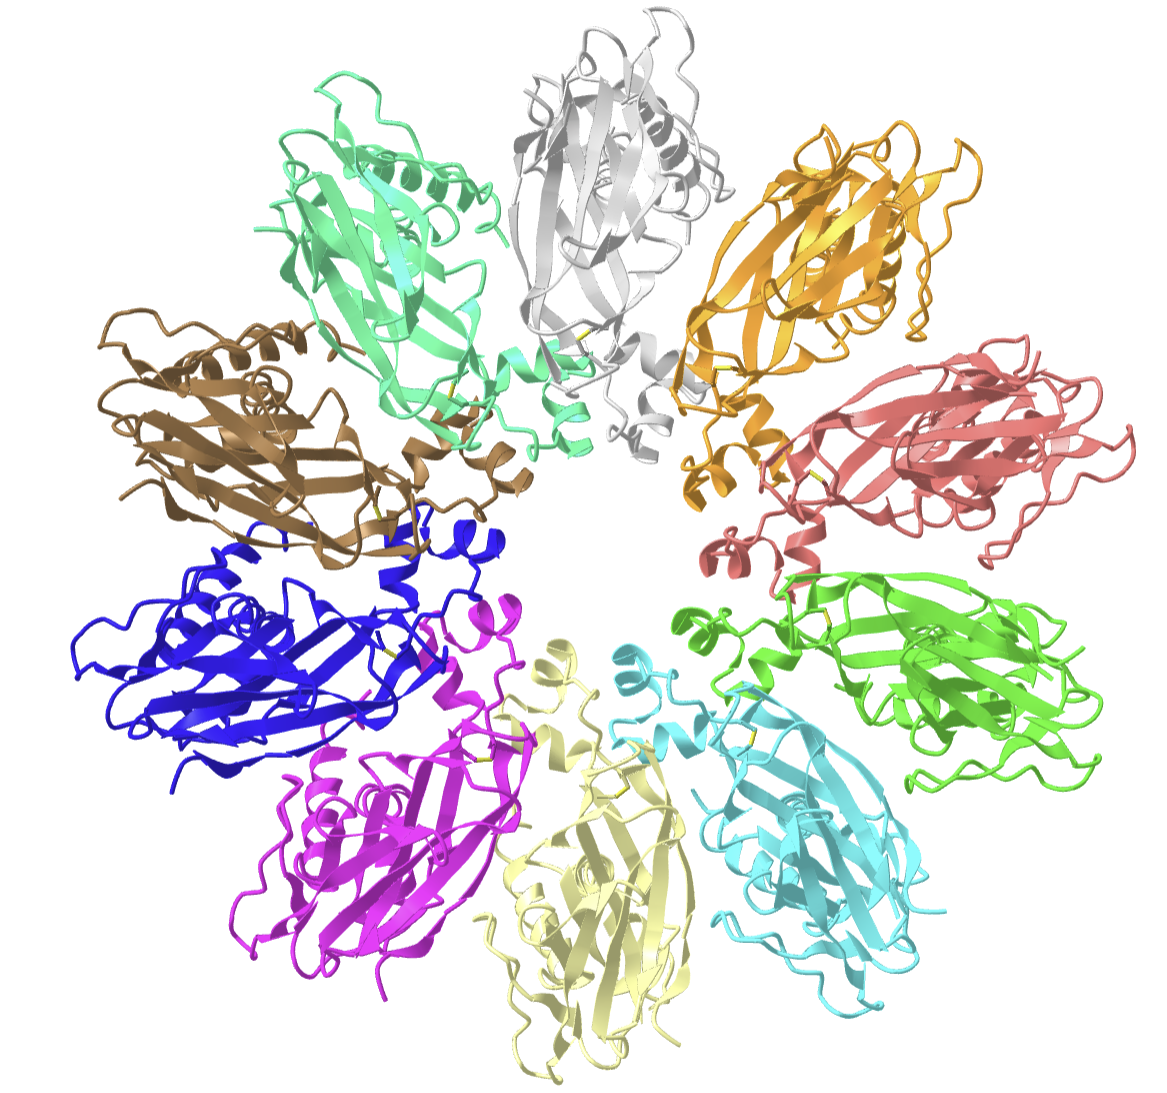
Figure \(\PageIndex{38}\): Yeast seipinhomo 10-mer yeast seipin membrane complex (7OXP). (Copyright; author via source).
Click the image for a popup or use this external link: https://structure.ncbi.nlm.nih.gov/i...wMLHBncjFZMbFA
The two transmembrane segments (helices) from each of the monomers are evident by rotating the structure so the homo 10-mer ring is viewed from the side.
Lipoproteins
We eat, digest, and transport dietary fat. We also make fat and transport it through the blood. We saw that free fatty acids are carried in the blood by the most abundant protein in the blood, albumin. What about the very insoluble triacylglycerols and cholesterol esters? They are also transported in the blood by nanoparticles similar to lipid droplets. They are called lipoproteins since, like lipid droplets, proteins are associated with them.
Lipoproteins vary in density and size. The densest is called high-density lipoproteins (HDL). As they get larger and more filled, they form less dense lipoproteins (low-density LDL, intermediate-density IDL, and very-low-density VLDL). These contain nondietary lipids made by organs like the liver. Dietary fats are processed in the intestine into very large particles called chylomicrons. Figure \(\PageIndex{39}\) shows their relative size and density.

Introduction to Lipids and Lipoproteins. Kenneth R. Feingold, MD. Creative Commons (CC-BY-NC-ND) license. A copy of the license can be viewed at http://creativecommons.org/licenses/by-nc-nd/2.0/. With permission.
As with lipid droplets, lipoproteins have a single outer monolayer leaflet containing double-chain membrane lipids like phosphatidylcholine and free cholesterol. Inside are the triacylglycerols and cholesterol esters. Proteins are bound to the outer monolayer. Figure \(\PageIndex{40}\) shows two renderings of discoidal HDL particles containing a single type of protein, Apo-A1. The TAGs are shown in cyan line rendering on the inside, along with cholesterol esters (in spacefill). The bottom part of the figure shows the polar Ns and Os decorating the outer part of the monolayer of phosphatidylcholine surrounding the TAGs and cholesterol esters.

Figure \(\PageIndex{41}\) shows an interactive iCn3D model of discoidal HDL (3k2s)
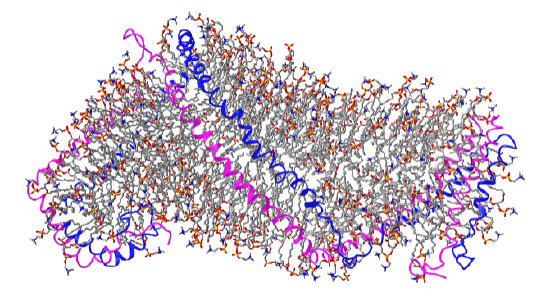
Figure \(\PageIndex{41}\): discoidal HDL (3k2s) (Copyright; author via source).
Click the image for a popup or use this external link: https://structure.ncbi.nlm.nih.gov/i...BE5XYUopbjGALA
Table \(\PageIndex{1}\) below shows the proteins associated with the different types of lipoproteins.
| Lipoprotein | Density (g/ml) | Size (nm) | Major Lipids | Major Apoproteins |
|---|---|---|---|---|
| Chylomicrons | <0.930 | 75-1200 | Triglycerides | Apo B-48, Apo C, Apo E, Apo A-I, A-II, A-IV |
| Chylomicron Remnants | 0.930- 1.006 | 30-80 | Triglycerides Cholesterol | Apo B-48, Apo E |
| VLDL | 0.930- 1.006 | 30-80 | Triglycerides | Apo B-100, Apo E, Apo C |
| IDL | 1.006- 1.019 | 25-35 | Triglycerides Cholesterol | Apo B-100, Apo E, Apo C |
| LDL | 1.019- 1.063 | 18- 25 | Cholesterol | Apo B-100 |
| HDL | 1.063- 1.210 | 5- 12 | Cholesterol Phospholipids | Apo A-I, Apo A-II, Apo C, Apo E |
| Lp (a) | 1.055- 1.085 | ~30 | Cholesterol | Apo B-100, Apo (a) |
Table \(\PageIndex{1}\): Proteins associated with the different types of lipoproteins.Introduction to Lipids and Lipoproteins. Kenneth R. Feingold, MD. Creative Commons (CC-BY-NC-ND) license. A copy of the license can be viewed at http://creativecommons.org/licenses/by-nc-nd/2.0/.
Summary
Chapter Summary: Overview of Lipid Bilayers
This chapter presents a comprehensive look at the structure, composition, dynamics, and functional complexity of lipid bilayers—the fundamental barriers that define cellular boundaries and compartmentalize intracellular processes.
It begins by describing the basic architecture of the membrane bilayer as an assembly of amphiphilic lipids arranged into two distinct leaflets. These lipids are not distributed randomly; they exhibit significant asymmetry, with different classes (e.g., phosphatidylcholine, sphingomyelin in the outer leaflet versus phosphatidylethanolamine and phosphatidylserine in the inner leaflet) contributing to unique physical and functional properties in various cellular compartments. The chapter highlights how lipid composition varies among organelles and cell types, emphasizing the central role of the endoplasmic reticulum in lipid synthesis and distribution.
The dynamic nature of membranes is a key theme. Lipids can laterally diffuse within a leaflet at high rates, while transverse (flip-flop) movement between leaflets is more restricted and often catalyzed by specialized enzymes such as flippases, floppases, and scramblases. These dynamics are crucial for maintaining membrane asymmetry and for processes like vesicle formation and membrane fusion.
Thermodynamic principles are used to explain how noncovalent interactions drive the self-assembly of lipids into organized structures. The chapter discusses phase transitions in membranes—such as the shift from a rigid gel phase to a more fluid liquid crystalline phase—as a function of temperature and lipid composition. Cholesterol plays a pivotal role here, modulating membrane fluidity by inhibiting both excessive ordering at low temperatures and over-flexibility at high temperatures.
Lipid rafts, which are dynamic, nanoscale domains enriched in cholesterol, sphingolipids, and specific proteins, are introduced as platforms for signaling and protein sorting. These rafts arise from lateral phase separation within the membrane and are essential for many cell signaling pathways and membrane trafficking events.
The chapter also extends its discussion to more complex lipid assemblies beyond bilayers. Lipid droplets, which store triacylglycerols and cholesterol esters, are described as organelles encapsulated by a phospholipid monolayer. Lipoproteins, the vehicles for lipid transport in blood, are similarly detailed—highlighting their structural variability and biological importance.
Overall, the chapter ties together how the unique chemical properties of lipid molecules—determined by their fatty acid composition, head group characteristics, and interactions with cholesterol—dictate the physical state, dynamics, and biological functions of membranes. This “structure determines function” paradigm is central to understanding the behavior of membranes in both in vitro experiments and in the complex environment of living cells.