
6.4.1: Earthquakes
- Page ID
- 69402

\( \newcommand{\vecs}[1]{\overset { \scriptstyle \rightharpoonup} {\mathbf{#1}} } \)
\( \newcommand{\vecd}[1]{\overset{-\!-\!\rightharpoonup}{\vphantom{a}\smash {#1}}} \)
\( \newcommand{\dsum}{\displaystyle\sum\limits} \)
\( \newcommand{\dint}{\displaystyle\int\limits} \)
\( \newcommand{\dlim}{\displaystyle\lim\limits} \)
\( \newcommand{\id}{\mathrm{id}}\) \( \newcommand{\Span}{\mathrm{span}}\)
( \newcommand{\kernel}{\mathrm{null}\,}\) \( \newcommand{\range}{\mathrm{range}\,}\)
\( \newcommand{\RealPart}{\mathrm{Re}}\) \( \newcommand{\ImaginaryPart}{\mathrm{Im}}\)
\( \newcommand{\Argument}{\mathrm{Arg}}\) \( \newcommand{\norm}[1]{\| #1 \|}\)
\( \newcommand{\inner}[2]{\langle #1, #2 \rangle}\)
\( \newcommand{\Span}{\mathrm{span}}\)
\( \newcommand{\id}{\mathrm{id}}\)
\( \newcommand{\Span}{\mathrm{span}}\)
\( \newcommand{\kernel}{\mathrm{null}\,}\)
\( \newcommand{\range}{\mathrm{range}\,}\)
\( \newcommand{\RealPart}{\mathrm{Re}}\)
\( \newcommand{\ImaginaryPart}{\mathrm{Im}}\)
\( \newcommand{\Argument}{\mathrm{Arg}}\)
\( \newcommand{\norm}[1]{\| #1 \|}\)
\( \newcommand{\inner}[2]{\langle #1, #2 \rangle}\)
\( \newcommand{\Span}{\mathrm{span}}\) \( \newcommand{\AA}{\unicode[.8,0]{x212B}}\)
\( \newcommand{\vectorA}[1]{\vec{#1}} % arrow\)
\( \newcommand{\vectorAt}[1]{\vec{\text{#1}}} % arrow\)
\( \newcommand{\vectorB}[1]{\overset { \scriptstyle \rightharpoonup} {\mathbf{#1}} } \)
\( \newcommand{\vectorC}[1]{\textbf{#1}} \)
\( \newcommand{\vectorD}[1]{\overrightarrow{#1}} \)
\( \newcommand{\vectorDt}[1]{\overrightarrow{\text{#1}}} \)
\( \newcommand{\vectE}[1]{\overset{-\!-\!\rightharpoonup}{\vphantom{a}\smash{\mathbf {#1}}}} \)
\( \newcommand{\vecs}[1]{\overset { \scriptstyle \rightharpoonup} {\mathbf{#1}} } \)
\(\newcommand{\longvect}{\overrightarrow}\)
\( \newcommand{\vecd}[1]{\overset{-\!-\!\rightharpoonup}{\vphantom{a}\smash {#1}}} \)
\(\newcommand{\avec}{\mathbf a}\) \(\newcommand{\bvec}{\mathbf b}\) \(\newcommand{\cvec}{\mathbf c}\) \(\newcommand{\dvec}{\mathbf d}\) \(\newcommand{\dtil}{\widetilde{\mathbf d}}\) \(\newcommand{\evec}{\mathbf e}\) \(\newcommand{\fvec}{\mathbf f}\) \(\newcommand{\nvec}{\mathbf n}\) \(\newcommand{\pvec}{\mathbf p}\) \(\newcommand{\qvec}{\mathbf q}\) \(\newcommand{\svec}{\mathbf s}\) \(\newcommand{\tvec}{\mathbf t}\) \(\newcommand{\uvec}{\mathbf u}\) \(\newcommand{\vvec}{\mathbf v}\) \(\newcommand{\wvec}{\mathbf w}\) \(\newcommand{\xvec}{\mathbf x}\) \(\newcommand{\yvec}{\mathbf y}\) \(\newcommand{\zvec}{\mathbf z}\) \(\newcommand{\rvec}{\mathbf r}\) \(\newcommand{\mvec}{\mathbf m}\) \(\newcommand{\zerovec}{\mathbf 0}\) \(\newcommand{\onevec}{\mathbf 1}\) \(\newcommand{\real}{\mathbb R}\) \(\newcommand{\twovec}[2]{\left[\begin{array}{r}#1 \\ #2 \end{array}\right]}\) \(\newcommand{\ctwovec}[2]{\left[\begin{array}{c}#1 \\ #2 \end{array}\right]}\) \(\newcommand{\threevec}[3]{\left[\begin{array}{r}#1 \\ #2 \\ #3 \end{array}\right]}\) \(\newcommand{\cthreevec}[3]{\left[\begin{array}{c}#1 \\ #2 \\ #3 \end{array}\right]}\) \(\newcommand{\fourvec}[4]{\left[\begin{array}{r}#1 \\ #2 \\ #3 \\ #4 \end{array}\right]}\) \(\newcommand{\cfourvec}[4]{\left[\begin{array}{c}#1 \\ #2 \\ #3 \\ #4 \end{array}\right]}\) \(\newcommand{\fivevec}[5]{\left[\begin{array}{r}#1 \\ #2 \\ #3 \\ #4 \\ #5 \\ \end{array}\right]}\) \(\newcommand{\cfivevec}[5]{\left[\begin{array}{c}#1 \\ #2 \\ #3 \\ #4 \\ #5 \\ \end{array}\right]}\) \(\newcommand{\mattwo}[4]{\left[\begin{array}{rr}#1 \amp #2 \\ #3 \amp #4 \\ \end{array}\right]}\) \(\newcommand{\laspan}[1]{\text{Span}\{#1\}}\) \(\newcommand{\bcal}{\cal B}\) \(\newcommand{\ccal}{\cal C}\) \(\newcommand{\scal}{\cal S}\) \(\newcommand{\wcal}{\cal W}\) \(\newcommand{\ecal}{\cal E}\) \(\newcommand{\coords}[2]{\left\{#1\right\}_{#2}}\) \(\newcommand{\gray}[1]{\color{gray}{#1}}\) \(\newcommand{\lgray}[1]{\color{lightgray}{#1}}\) \(\newcommand{\rank}{\operatorname{rank}}\) \(\newcommand{\row}{\text{Row}}\) \(\newcommand{\col}{\text{Col}}\) \(\renewcommand{\row}{\text{Row}}\) \(\newcommand{\nul}{\text{Nul}}\) \(\newcommand{\var}{\text{Var}}\) \(\newcommand{\corr}{\text{corr}}\) \(\newcommand{\len}[1]{\left|#1\right|}\) \(\newcommand{\bbar}{\overline{\bvec}}\) \(\newcommand{\bhat}{\widehat{\bvec}}\) \(\newcommand{\bperp}{\bvec^\perp}\) \(\newcommand{\xhat}{\widehat{\xvec}}\) \(\newcommand{\vhat}{\widehat{\vvec}}\) \(\newcommand{\uhat}{\widehat{\uvec}}\) \(\newcommand{\what}{\widehat{\wvec}}\) \(\newcommand{\Sighat}{\widehat{\Sigma}}\) \(\newcommand{\lt}{<}\) \(\newcommand{\gt}{>}\) \(\newcommand{\amp}{&}\) \(\definecolor{fillinmathshade}{gray}{0.9}\)An earthquake is the shaking caused by the rupture (breaking) and subsequent displacement of rocks (one body of rock moving with respect to another) beneath Earth’s surface. A body of rock that is under stress becomes deformed. When the rock can no longer withstand the deformation, it breaks and the two sides slide past each other. The region where the rupture occurs is called the focus. This is often deep below the surface of the crust. The point on the surface directly above the focus is called the epicenter. Destructive waves propagate outward from the region of the quake, traveling throughout the earth. The magnitude of an earthquake is a measure of the total amount of energy released. The first step in determining the magnitude is to measure the propagated waves using a device called a seismograph. Based on this information, the earthquake is given a number classification on a modified Richter scale. The scale is logarithmic, so a difference of one unit means a difference of ten-fold in wave intensity, which corresponds to an energy difference of 32-fold. The intensity of an earthquake is an indicator of the effect of an earthquake at a particular locale. The effect depends not only on the magnitude of the earthquake, but also the types of subsurface materials and the structure and design of surface structures.
Earthquakes generally occur along breaks in the rock mass known as faults, and most occur in regions near plate boundaries, although not all earthquakes happen on pre-existing faults. Some 80 percent of all earthquakes occur near convergent plate boundaries, triggered by the interaction of the plates. Earthquakes are also often associated with volcanic activity due to the movement of sub-surface magma.
An intense earthquake can cause great damage to buildings, and the collapsing structures, fires, and other destruction can take a great toll on people. In 1556 an earthquake struck Shanxi Province in China and caused about 830,000 deaths, making it the most deadly earthquake in recorded history. The most famous catastrophic earthquake in North America was the San Francisco event in 1906, caused by slippage along the San Andreas Fault, which killed 503 people and resulted in tremendous physical damage. However, other earthquakes during the twentieth century resulted in much greater losses of human lives, including one in 1976 that killed 242,000 people in Tangshan, China; another in 1927 that killed 200,000 in Nan-Shan, China; and one in Tokyo–Yokohama, Japan, that killed 200,000 in 1926. Notable recent earthquakes include one in Kobe, Japan (1995) that killed 5,500 people, another in Kashmir (2005) that killed 79,000 people, one in Sichuan, China (2008) that killed 70,000 people, and one in the Tohuku region of Japan (2011) that generated a tsunami (seismic sea wave) that killed 16,000 people. The events in San Francisco (1906) and Tokyo (1926) affected large cities. The powerful tremors caused great damage, partly because of weak architectural designs that were unable to withstand the strong forces. In both cases, however, about 90% of the actual destruction resulted from fires. Earthquakes can also cause soil to lose some of its mechanical stability, resulting in destructive landslides and subsidence (sinking) of land and buildings.
When an earthquake occurs under the ocean, it can trigger a destructive tidal wave known as a tsunami. A tsunami may be almost indiscernible in deep water of the open ocean, but it can become gigantic when the wave reaches shallow water and piles up to heights that can swamp coastal villages and towns. In 1946, a large earthquake centered on Umiak Island in the Aleutian Islands (Alaska) caused a tsunami to strike Hawaii, 4,500 km away, with an 18 m crest. The greatest tsunami of recent times was triggered by an undersea, so-called “megathrust” earthquake on December 26, 2004. Its epicenter was located about 40 km off the coast of Aceh in northern Sumatra, an Indonesian island, and it registered a massive 9.2 on the Richter scale (making it the largest earthquake in 40 years) (Figure \(\PageIndex{1}\)). The tremor generated an immense tsunami (actually, a close series of individual waves) that gathered to a height up to 30 m when it impacted shallow-sloping coasts of countries fringing the Indian Ocean. The colossal tsunami waves were moving at speeds of about 60 kmhr when they impacted the shore. They caused widespread devastation and more than 225,000 deaths by drowning and injuries caused by floating debris and collapsing buildings. The hardest-hit places were Sumatra (which suffered at least 168,000 dead and missing), Sri Lanka (35,000), the eastern coast and islands of India (18,000), and Thailand (8,000). At least 7,000 of the deaths were tourists from developed countries who were visiting coastal resorts during their holiday break. In addition to the mortality, tens of millions of people were displaced from their homes and livelihoods by the flooding. In many of the worst-hit places, the damage was made much more severe because of increased coastal vulnerability caused by the removal of previously abundant mangrove forest, mostly to develop tourist resorts and brackish ponds for shrimp aquaculture. Where mangroves remained intact, the coastal forest provided a sea-wall that helped to absorb much of the force of the tsunami, providing a measure of protection to areas further inland.
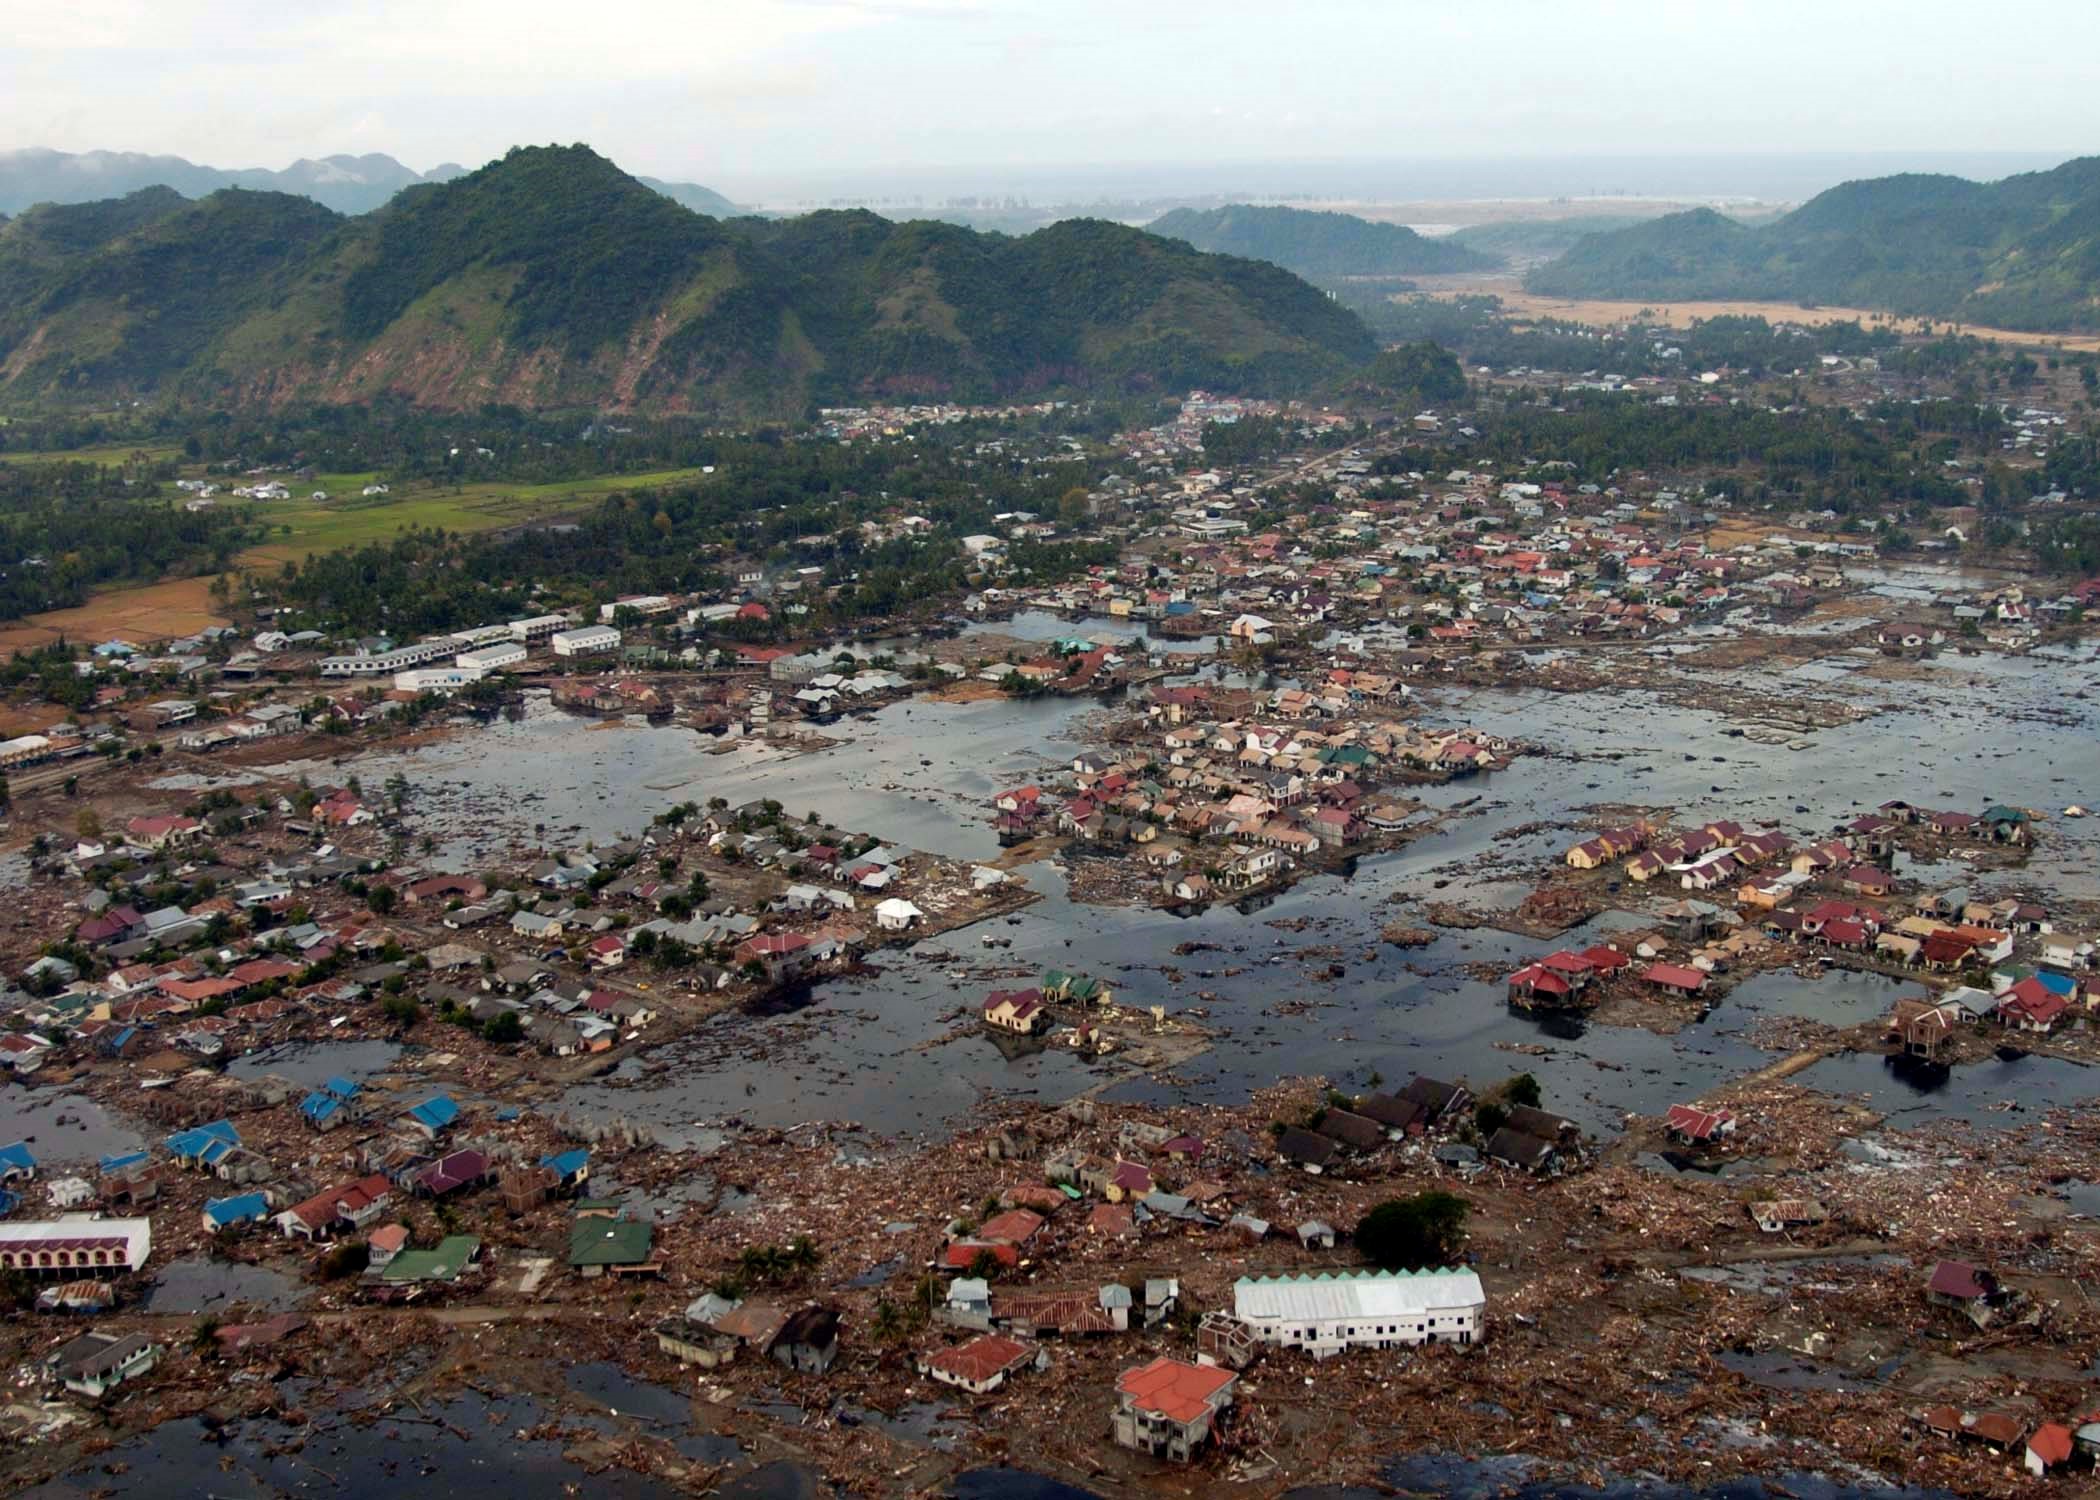
Figure \(\PageIndex{1}\): A devastated village on the coast of Aceh, Sumatra, after the killer tsunami of December 26, 2004. Source: image by P.A. McDaniel, United States Navy, ID 050102-N-9593M-040; https://commons.wikimedia.org/wiki/File%3AUS_Navy_050102-N-9593M-040_A_village_near_the_coast_of_Sumatra_lays_in_ruin_after_the_Tsunami_that_struck_South_East_Asia.jpg
Earthquake Processes
The engineering principle of elastic deformation, which can be used to understand earthquakes, is illustrated in Figure \(\PageIndex{2}\). The stress applied to a rock—typically because of ongoing plate movement—results in strain or deformation of the rock (Figure \(\PageIndex{2}\)b). Because most rock is strong (unlike loose sand, for example), it can withstand a significant amount of deformation without breaking. But every rock has a deformation limit and will rupture (break) once that limit is reached. At that point, in the case of rocks within the crust, the rock breaks and there is displacement along the rupture surface (Figure \(\PageIndex{2}\)c). The magnitude of the earthquake depends on the extent of the area that breaks (the area of the rupture surface) and the average amount of displacement (sliding).

The concept of a rupture surface, which is critical to understanding earthquakes, is illustrated in Figure \(\PageIndex{3}\). An earthquake does not happen at a point, it happens over an area within a plane, although not necessarily a flat plane. Within the area of the rupture surface, the amount of displacement is variable (Figure \(\PageIndex{3}\)), and, by definition, it decreases to zero at the edges of the rupture surface because the rock beyond that point isn’t displaced at all. The extent of a rupture surface and the amount of displacement will depend on a number of factors, including the type and strength of the rock, and the degree to which it was stressed beforehand.

Earthquake rupture doesn’t happen all at once; it starts at a single point and spreads rapidly from there. Depending on the extent of the rupture surface, the propagation of failures out from the point of initiation is typically completed within seconds to several tens of seconds (Figure \(\PageIndex{4}\)). The initiation point isn’t necessarily in the centre of the rupture surface; it may be close to one end, near the top, or near the bottom.
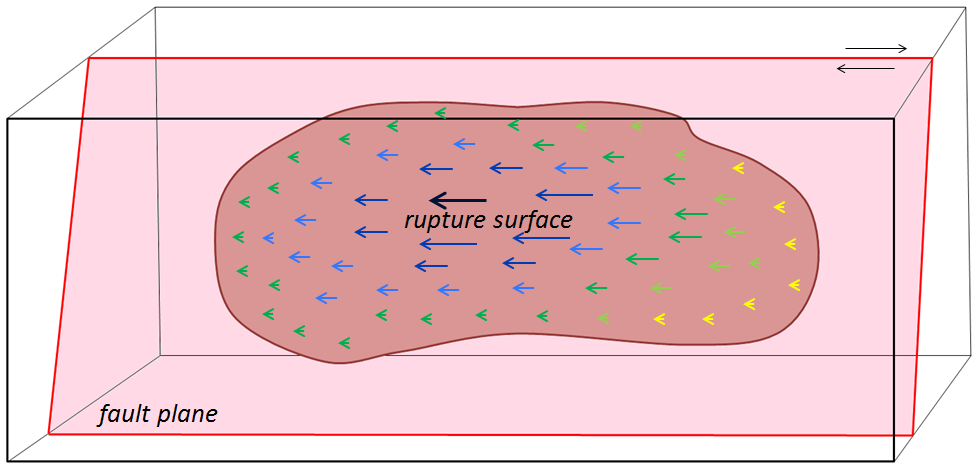
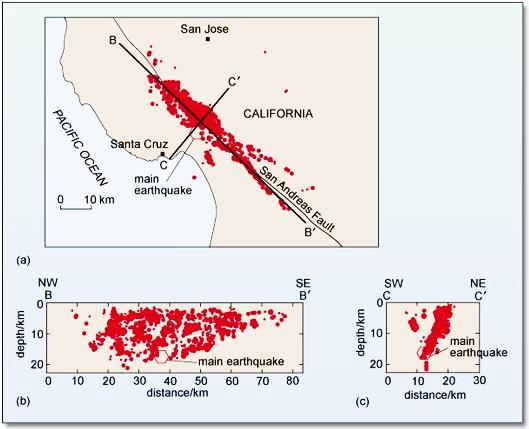
Figure \(\PageIndex{5}\) shows the distribution of immediate aftershocks associated with the 1989 Loma Prieta earthquake. Panel (b) is a section along the San Andreas Fault; this view is equivalent to what is shown in Figures \(\PageIndex{3}\) and \(\PageIndex{4}\). The area of red dots is the rupture surface; each red dot is a specific aftershock that was recorded on a seismometer. The hexagon labelled “main earthquake” represents the first or main shock. When that happened, the rock at that location broke and was displaced. That released the stress on that particular part of the fault, but it resulted in an increase of the stress on other nearby parts of the fault, and contributed to a cascade of smaller ruptures (aftershocks), in this case, over an area about 60 kilometers long and 15 kilometers wide.
So, what exactly is an aftershock then? An aftershock is an earthquake just like any other, but it is one that can be shown to have been triggered by stress transfer from a preceding earthquake. Within a few tens of seconds of the main Loma Prieta earthquake, there were hundreds of smaller aftershocks; their distribution defines the area of the rupture surface.
Aftershocks can be of any magnitude. Most are smaller than the earthquake that triggered them, but they can be bigger. The aftershocks shown in Figure \(\PageIndex{4}\) all happened within seconds or minutes of the main shock, but aftershocks can be delayed for hours, days, weeks, or even years. As already noted, aftershocks are related to stress transfer. For example, the main shock of the Loma Prieta earthquake triggered aftershocks in the immediate area, which triggered more in the surrounding area, eventually extending for 30 kilometers along the fault in each direction and for 15 kilometers toward the surface. But the earthquake as a whole also changed the stress on adjacent parts of the San Andreas Fault. This effect, which has been modelled for numerous earthquakes and active faults around the world, is depicted in Figure \(\PageIndex{6}\). Stress was reduced in the area of the rupture (blue), but was increased at either end of the rupture surface (red and yellow).

Stress transfer isn’t necessarily restricted to the fault along which an earthquake happened. It will affect the rocks in general around the site of the earthquake and may lead to increased stress on other faults in the region. The effects of stress transfer don’t necessarily show up right away. Segments of faults are typically in some state of stress, and the transfer of stress from another area is only rarely enough to push a fault segment beyond its limits to the point of rupture. The stress that is added by stress transfer accumulates along with the ongoing buildup of stress from plate motion and eventually leads to another earthquake.
Episodic Tremor and Slip
Episodic tremor and slip (ETS) is periodic slow sliding along part of a subduction boundary. It does not produce recognizable earthquakes, but does produce seismic tremor (rapid seismic vibrations on a seismometer). It was first discovered on the Vancouver Island part of the Cascadia subduction zone by Geological Survey of Canada geologists Herb Dragert and Garry Rogers.[1]
The boundary between the subducting Juan de Fuca Plate and the North America Plate can be divided into three segments (Figure \(\PageIndex{7}\)). The cold upper part of the Juan de Fuca Plate boundary is locked. The plates are stuck and don’t move, except with very large earthquakes that happen approximately every 500 years (the last one was approximately M9 on January 26, 1700). The warm lower part of the boundary is sliding continuously because the warm rock is weaker. The central part of the boundary isn’t cold enough to be stuck, but isn’t warm enough to slide continuously. Instead it slips episodically, approximately every 14 months for about 2 weeks, moving a few centimeters each time.

You might be inclined to think that it’s a good thing that there is periodic slip on this part of the plate because it releases some of the tension and reduces the risk of a large earthquake. In fact, the opposite is likely the case. The movement along the ETS part of the plate boundary acts like a medium-sized earthquake and leads to stress transfer to the adjacent locked part of the plate. Approximately every 14 months, during the two-week ETS period, there is a transfer of stress to the shallow locked part of the Cascadia subduction zone, and therefore an increased chance of a large earthquake.
Since 2003, ETS processes have also been observed on subduction zones in Mexico, New Zealand and Japan.
References
- Rogers, G. and Dragert, H., 2003, Episodic tremor and slip on the Cascadia subduction zone: the chatter of silent slip, Science, V. 300, p. 1942-1943. ↵
Contributors and Attributions
Modified by Kyle Whittinghill from the following sources
- What is an Earthquake from Physical Geology by Steven Earle (licensed under a Creative Commons Attribution 4.0 International License)
- The Physical World from Environmental Science: A Canadian Perspective by Bill Freedman (Creative Commons Attribution NonCommercial)