
6.4.4: Floods
- Page ID
- 69411
\( \newcommand{\vecs}[1]{\overset { \scriptstyle \rightharpoonup} {\mathbf{#1}} } \)
\( \newcommand{\vecd}[1]{\overset{-\!-\!\rightharpoonup}{\vphantom{a}\smash {#1}}} \)
\( \newcommand{\dsum}{\displaystyle\sum\limits} \)
\( \newcommand{\dint}{\displaystyle\int\limits} \)
\( \newcommand{\dlim}{\displaystyle\lim\limits} \)
\( \newcommand{\id}{\mathrm{id}}\) \( \newcommand{\Span}{\mathrm{span}}\)
( \newcommand{\kernel}{\mathrm{null}\,}\) \( \newcommand{\range}{\mathrm{range}\,}\)
\( \newcommand{\RealPart}{\mathrm{Re}}\) \( \newcommand{\ImaginaryPart}{\mathrm{Im}}\)
\( \newcommand{\Argument}{\mathrm{Arg}}\) \( \newcommand{\norm}[1]{\| #1 \|}\)
\( \newcommand{\inner}[2]{\langle #1, #2 \rangle}\)
\( \newcommand{\Span}{\mathrm{span}}\)
\( \newcommand{\id}{\mathrm{id}}\)
\( \newcommand{\Span}{\mathrm{span}}\)
\( \newcommand{\kernel}{\mathrm{null}\,}\)
\( \newcommand{\range}{\mathrm{range}\,}\)
\( \newcommand{\RealPart}{\mathrm{Re}}\)
\( \newcommand{\ImaginaryPart}{\mathrm{Im}}\)
\( \newcommand{\Argument}{\mathrm{Arg}}\)
\( \newcommand{\norm}[1]{\| #1 \|}\)
\( \newcommand{\inner}[2]{\langle #1, #2 \rangle}\)
\( \newcommand{\Span}{\mathrm{span}}\) \( \newcommand{\AA}{\unicode[.8,0]{x212B}}\)
\( \newcommand{\vectorA}[1]{\vec{#1}} % arrow\)
\( \newcommand{\vectorAt}[1]{\vec{\text{#1}}} % arrow\)
\( \newcommand{\vectorB}[1]{\overset { \scriptstyle \rightharpoonup} {\mathbf{#1}} } \)
\( \newcommand{\vectorC}[1]{\textbf{#1}} \)
\( \newcommand{\vectorD}[1]{\overrightarrow{#1}} \)
\( \newcommand{\vectorDt}[1]{\overrightarrow{\text{#1}}} \)
\( \newcommand{\vectE}[1]{\overset{-\!-\!\rightharpoonup}{\vphantom{a}\smash{\mathbf {#1}}}} \)
\( \newcommand{\vecs}[1]{\overset { \scriptstyle \rightharpoonup} {\mathbf{#1}} } \)
\(\newcommand{\longvect}{\overrightarrow}\)
\( \newcommand{\vecd}[1]{\overset{-\!-\!\rightharpoonup}{\vphantom{a}\smash {#1}}} \)
\(\newcommand{\avec}{\mathbf a}\) \(\newcommand{\bvec}{\mathbf b}\) \(\newcommand{\cvec}{\mathbf c}\) \(\newcommand{\dvec}{\mathbf d}\) \(\newcommand{\dtil}{\widetilde{\mathbf d}}\) \(\newcommand{\evec}{\mathbf e}\) \(\newcommand{\fvec}{\mathbf f}\) \(\newcommand{\nvec}{\mathbf n}\) \(\newcommand{\pvec}{\mathbf p}\) \(\newcommand{\qvec}{\mathbf q}\) \(\newcommand{\svec}{\mathbf s}\) \(\newcommand{\tvec}{\mathbf t}\) \(\newcommand{\uvec}{\mathbf u}\) \(\newcommand{\vvec}{\mathbf v}\) \(\newcommand{\wvec}{\mathbf w}\) \(\newcommand{\xvec}{\mathbf x}\) \(\newcommand{\yvec}{\mathbf y}\) \(\newcommand{\zvec}{\mathbf z}\) \(\newcommand{\rvec}{\mathbf r}\) \(\newcommand{\mvec}{\mathbf m}\) \(\newcommand{\zerovec}{\mathbf 0}\) \(\newcommand{\onevec}{\mathbf 1}\) \(\newcommand{\real}{\mathbb R}\) \(\newcommand{\twovec}[2]{\left[\begin{array}{r}#1 \\ #2 \end{array}\right]}\) \(\newcommand{\ctwovec}[2]{\left[\begin{array}{c}#1 \\ #2 \end{array}\right]}\) \(\newcommand{\threevec}[3]{\left[\begin{array}{r}#1 \\ #2 \\ #3 \end{array}\right]}\) \(\newcommand{\cthreevec}[3]{\left[\begin{array}{c}#1 \\ #2 \\ #3 \end{array}\right]}\) \(\newcommand{\fourvec}[4]{\left[\begin{array}{r}#1 \\ #2 \\ #3 \\ #4 \end{array}\right]}\) \(\newcommand{\cfourvec}[4]{\left[\begin{array}{c}#1 \\ #2 \\ #3 \\ #4 \end{array}\right]}\) \(\newcommand{\fivevec}[5]{\left[\begin{array}{r}#1 \\ #2 \\ #3 \\ #4 \\ #5 \\ \end{array}\right]}\) \(\newcommand{\cfivevec}[5]{\left[\begin{array}{c}#1 \\ #2 \\ #3 \\ #4 \\ #5 \\ \end{array}\right]}\) \(\newcommand{\mattwo}[4]{\left[\begin{array}{rr}#1 \amp #2 \\ #3 \amp #4 \\ \end{array}\right]}\) \(\newcommand{\laspan}[1]{\text{Span}\{#1\}}\) \(\newcommand{\bcal}{\cal B}\) \(\newcommand{\ccal}{\cal C}\) \(\newcommand{\scal}{\cal S}\) \(\newcommand{\wcal}{\cal W}\) \(\newcommand{\ecal}{\cal E}\) \(\newcommand{\coords}[2]{\left\{#1\right\}_{#2}}\) \(\newcommand{\gray}[1]{\color{gray}{#1}}\) \(\newcommand{\lgray}[1]{\color{lightgray}{#1}}\) \(\newcommand{\rank}{\operatorname{rank}}\) \(\newcommand{\row}{\text{Row}}\) \(\newcommand{\col}{\text{Col}}\) \(\renewcommand{\row}{\text{Row}}\) \(\newcommand{\nul}{\text{Nul}}\) \(\newcommand{\var}{\text{Var}}\) \(\newcommand{\corr}{\text{corr}}\) \(\newcommand{\len}[1]{\left|#1\right|}\) \(\newcommand{\bbar}{\overline{\bvec}}\) \(\newcommand{\bhat}{\widehat{\bvec}}\) \(\newcommand{\bperp}{\bvec^\perp}\) \(\newcommand{\xhat}{\widehat{\xvec}}\) \(\newcommand{\vhat}{\widehat{\vvec}}\) \(\newcommand{\uhat}{\widehat{\uvec}}\) \(\newcommand{\what}{\widehat{\wvec}}\) \(\newcommand{\Sighat}{\widehat{\Sigma}}\) \(\newcommand{\lt}{<}\) \(\newcommand{\gt}{>}\) \(\newcommand{\amp}{&}\) \(\definecolor{fillinmathshade}{gray}{0.9}\)The Definition of a Flood
Here’s a simple definition of a river flood: the occurrence of a flow of such magnitude that it overtops the natural or artificial banks in a reach of river channel. If a floodplain exists, here’s another way of defining a flood: any flow that spreads out over the floodplain.
The relative volume of flood water is not large: on average, water discharged in excess of channel capacity constitutes about 5% of the total annual discharge of the given drainage basin. But the absolute volume of flood water is staggering. Hypothetical example: a two-inch rainstorm over a one-square-mile catchment the soils of which can absorb 0.5 inches would supply almost 3.5 million cubic feet of water is a couple of hours! (That’s a cube 150 feet on a side.)
A flood is a wave: it has a wavelike shape (although very subdued, with low amplitude relative to wavelength), and it propagates downriver at some speed, typically less than the mean velocity of flow of water in the river.
Floodplains
Here are two similar but not quite identical definitions of a floodplain, taken from the literature:
- the flat area adjacent to the river channel, constructed by the present river in the present climate and frequently subjected to overflow (Leopold, 1994)
- the flat area adjoining a river channel constructed by the river in the present climate and overflowed at times of high discharge (Dunne and Leopold, 1978)
The existence of a floodplain is testimony to the lateral migration of the river channel. With time, the shifting channel sweeps the entire width of the floodplain, eroding the “front” bank and depositing the “rear” bank as it goes (Figure \(\PageIndex{1-2}\)). If the climate, or the base level, changes in such a way that the river degrades (i.e., lowers its bed), the old floodplain is incised, forming a set of terraces, and a new, narrower floodplain develops. If the climate, or the base level, changes in such a way that the river aggrades, the floodplain typically (except in extreme cases) aggrades along with it.
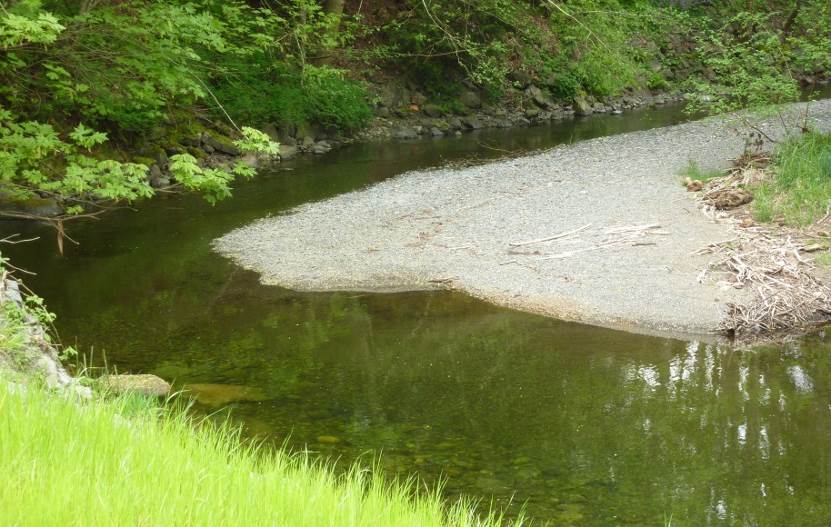
Figure \(\PageIndex{1}\): Top: The meandering channel of the Bonnell Creek, Nanoose, B.C. The stream is flowing toward the viewer. The sand and gravel point bar must have formed when the creek was higher and the flow faster than it was when the photo was taken. © Steven Earle. CC BY.
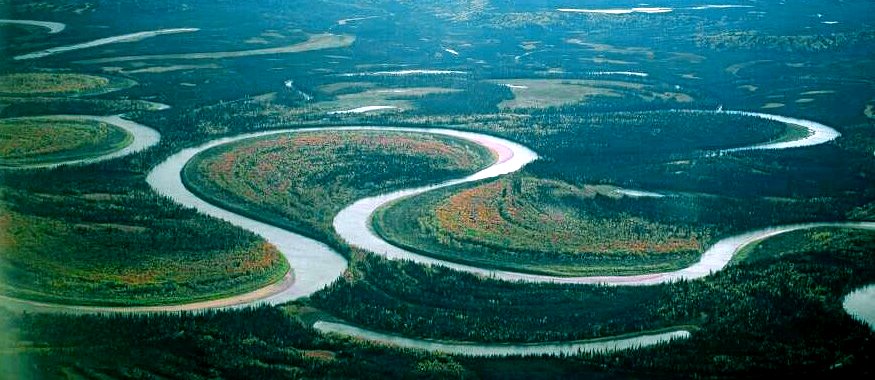
Figure \(\PageIndex{2}\): The meandering channel of the Nowitna River, Alaska. Numerous oxbow lakes are present and another meander cutoff will soon take place. [Oliver Kumis, http://commons.wikimedia.org/wiki/Fi...tna_river.jpg]
What determines the height of the floodplain above the channel bed? That has to do with the relationship between effectiveness and frequency. Low discharges are common but not effective in sediment transport and channel shaping, whereas very high discharges are very effective at transporting sediment but very uncommon. The discharges with greatest effectiveness in maintaining channel and floodplain geometry are at some intermediate value: high but not extremely high, and common but not extremely common. For most rivers, bank-full discharges (those that spill over onto the floodplain) occur once or twice a year, on average. (It turns out that the discharge that is responsible for the maximum sediment discharge, in a given time period like a year, called the effective discharge, is very close to being equal to the bank-full discharge.)
What are floodplains like?
- They range in width from several meters, on the smallest streams, to many tens of kilometers, on the largest rivers.
- They are not flat as a board: they have minor relief, in the form of sloughs and depressions left behind by the irregular shifting of the river channel.
- They are developed in their classic sense in connection with meandering rivers. Braided rivers work irregularly across the entire valley, such that in a sense the entire valley is “river bed” (Figure \(\PageIndex{3}\)).
- They are typically heavily vegetated in their natural state; in fact, the bank-stabilization effect of vegetation is one of the most important, if not the most important, factors in the existence of the floodplain in the first place.
- They vary in their “wetness”: usually they are dry and well above the local water table for most of the year, and are thus conducive to human use, but in areas with consistently high rainfall and/or strongly aggradational river regime ,there can be extensive swampy areas on the floodplain.
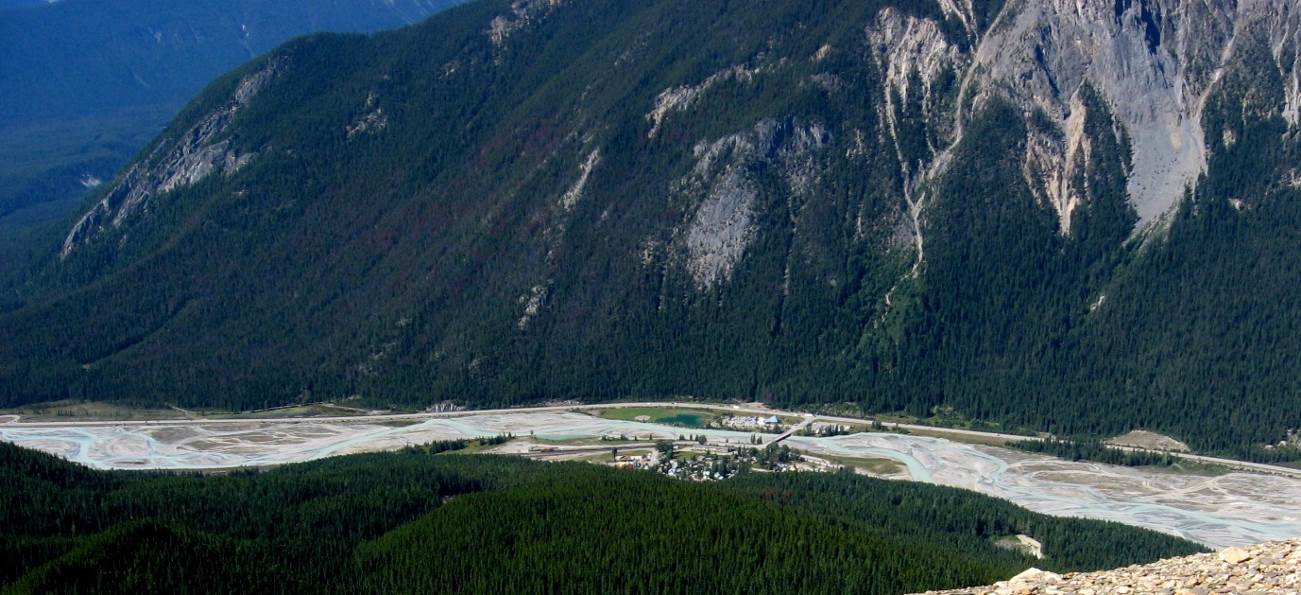
Figure \(\PageIndex{3}\): Figure 13.19 The braided channel of the Kicking Horse River at Field, B.C. © Steven Earle. CC BY.
Stream Erosion and Deposition
Flowing water is a very important mechanism for both erosion and deposition. Water flow in a stream is primarily related to the stream’s gradient (slope or "steepness"), but it is also controlled by the geometry of the stream channel. As shown in Figure \(\PageIndex{4}\), water flow velocity is decreased by friction along the stream bed, so it is slowest at the bottom and edges and fastest near the surface and in the middle. In fact, the velocity just below the surface is typically a little higher than right at the surface because of friction between the water and the air. On a curved section of a stream, flow is fastest on the outside and slowest on the inside (Figure \(\PageIndex{1}\ and \(\PageIndex{4}\)).
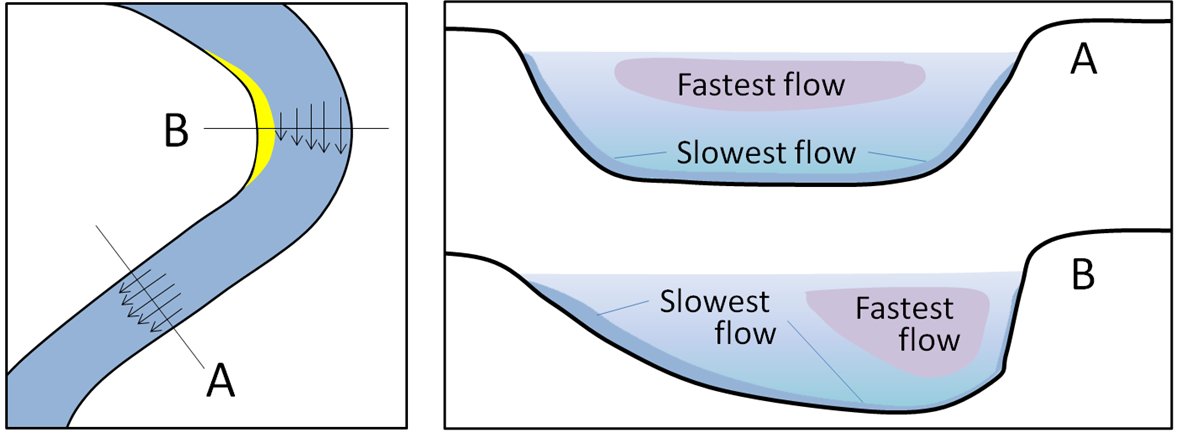
Figure \(\PageIndex{4}\): The relative velocity of stream flow depending on whether the stream channel is straight or curved (left), and with respect to the water depth (right). © Steven Earle. CC BY.
Other factors that affect stream-water velocity are the size of sediments on the stream bed — because large particles tend to slow the flow more than small ones — and the discharge, or volume of water passing a point in a unit of time (e.g., m3/second). During a flood, the water level always rises, so there is more cross-sectional area for the water to flow in; however, as long as a river remains confined to its channel, the velocity of the water flow also increases.
Figure \(\PageIndex{5}\) shows the nature of sediment transportation in a stream. Large particles rest on the bottom — bedload — and may only be moved during rapid flows under flood conditions. They can be moved by saltation (bouncing) and by traction (being pushed along by the force of the flow). Smaller particles may rest on the bottom some of the time, where they can be moved by saltation and traction, but they can also be held in suspension in the flowing water, especially at higher velocities. The faster the water is flowing, the larger the particles that can be kept in suspension and transported within the flowing water. It is important to be aware that a stream can both erode and deposit sediments of different sizes at the same time.
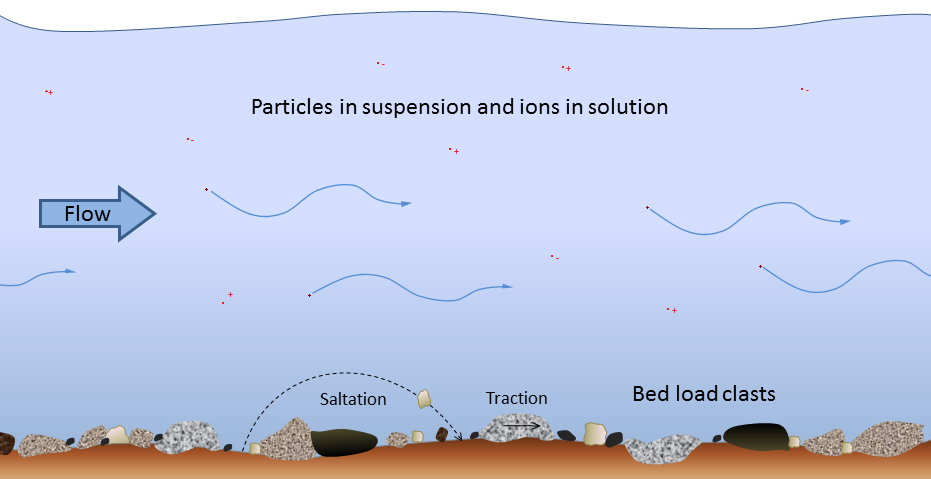
Figure \(\PageIndex{5}\: Modes of transportation of sediments and dissolved ions (represented by red dots with + and – signs) in a stream. © Steven Earle. CC BY.
As you know from intuition and from experience, streams that flow fast tend to be turbulent (flow paths are chaotic and the water surface appears rough) and the water may be muddy, while those that flow more slowly tend to have laminar flow (straight-line flow and a smooth water surface) and clear water. Turbulent flow is more effective than laminar flow at keeping sediments in suspension.
Stream water also has a dissolved load, which represents (on average) about 15% of the mass of material transported, and includes ions such as calcium (Ca+2) and chloride (Cl-) in solution. The solubility of these ions is not affected by flow velocity.
A stream typically reaches its greatest velocity when it is close to flooding over its banks. This is known as the bank-full stage, as shown in Figure \(\PageIndex{6}). As soon as the flooding stream overtops its banks and occupies the wide area of its flood plain, the water has a much larger area to flow through and the velocity drops significantly. At this point, sediment that was being carried by the high-velocity water is deposited near the edge of the channel, forming a natural bank or levée.
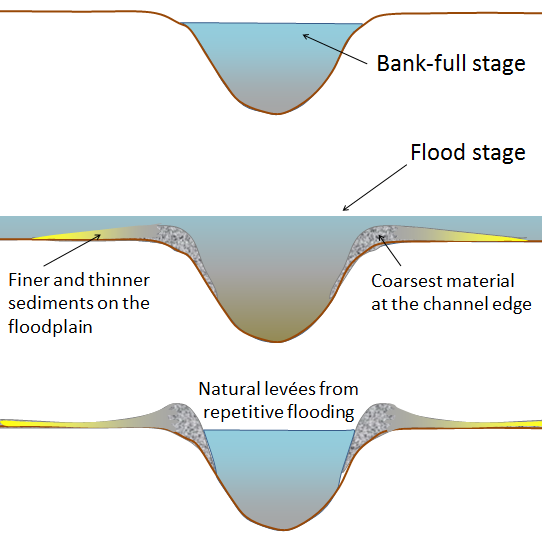
Figure \(\PageIndex{6}): The development of natural levées during flooding of a stream. The sediments of the levée become increasingly fine away from the stream channel, and even finer sediments — clay, silt, and fine sand — are deposited across most of the flood plain. © Steven Earle. CC BY.
Important Aspects of Floods
There are several important aspects of floods:
- discharge: discharge is important because of its close relation to flow velocity: how erosive is the flood flow in terms of banks, levees, and river structures?
- stage: the height of the water determines flood damage on the floodplain (This is what the public thinks about most in connection with floods.) Also, it relates to the water-passing capacity of bridges, culverts, dam spillways, etc.
- volume: this relates to how much water is available to be caught and impounded in reservoirs for water supply and flood control.
- area inundated: this is determined by stage together with river-valley topography.
- flow velocity: Although the flow velocity is much less over the floodplain than in the main channel, it can be great enough to cause damage.
What are the important effects or factors that govern the magnitude of a flood?
• Rainfall in the drainage basin upstream of the given point on the given river. This boils down to both rainfall intensity (depth per unit time) and rainfall duration, and also the area of the drainage basin covered by the rainstorm. The worst scenario is: high intensity for a long time over a large area of the drainage basin.
• Preceding condition of soil moisture in the area of rainfall: dry, which lessens the runoff, or saturated, which maximizes the runoff? The difference can be as much as half an inch of equivalent rainfall. That’s a big effect for small floods but only a small effect for large floods.
• Channel storage. Think in terms of what happens when a flood discharge from an upstream river enters a large lake. The lake has a large surface area, so it takes a long time for the flood flow to raise the lake elevation and therefore increase the discharge out of the lake. This storage effect is also present to a non-negligible extent along the river channel itself: As the flood proceeds downstream, it has to fill a greater and greater volume of space in the river channel itself. This effect attenuates the flood in the downstream direction: in effect, it stretches out the hydrograph and lowers its peak (in terms of either the stage hydrograph or the discharge hydrograph).
• Channel geometry. The narrower the channel, for a given flood discharge, the more the stage rises. When the stage reaches bank-full, the water spreads out over the floodplain, and the stage then increases far less rapidly with increasing discharge.
Are Floods Getting Worse?
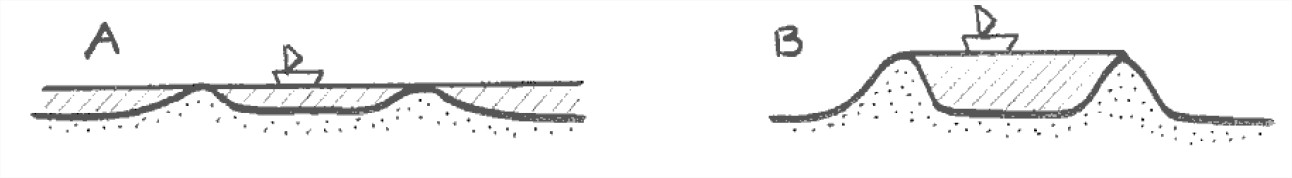
The answer to that question is certainly “yes”, in terms of dollar value of damage, just because of greater human use of flood-prone areas near rivers. But the answer is yes also in terms of higher stage, because of the effect of more levee protection: the levees prevent the high discharges from spreading over the floodplain, so the rise in stage is confined to within the channel (Figure \(\PageIndex{7}\)).
Is flood discharge increasing on average as well? There are two aspects to this question.
(1) In urbanized drainage basins, the percentage of area paved increases, thus decreasing the concentration time and tending to produce higher peaks in the hydrograph (stage and discharge) for a given rainfall. In rural drainage basins, bare-soil agriculture and clear cutting of forests have the same effect, although it seems not to be a really major effect. (Their effect on sediment yield is much greater, though.)
(2) Average rainfall in the drainage basin might be increasing because of climate change (although in much of the U.S., the prediction is that global warming will decrease precipitation rather than increase it). However, “storminess” (increased incidence of major rainstorms) is predicted to increase with climate change.
Can Floods Be Controlled?
A better way of putting the question would be: how can flood damage be minimized, in the sense that a given measure affords more flood protection than it costs to institute?
(1) Build higher and higher levees. Yes, you can keep the floodwaters off the floodplain by building the levees higher. In a real sense, however, this is a self-defeating activity (Figure 5-50). Under natural conditions, the flood stage has built into it an inherently self-limiting effect: the floodplain area is so much greater than the channel area that, once the river goes beyond bank-full to inundate the floodplain, water-level rise is minor. (But remember that “minor” in a natural sense may be catastrophic for people living on the floodplain.) Building the levees higher restricts the river discharge to a much narrower width of the river valley, so the flood stage is much higher than would have been the case without the higher levees. Because of the effect of eliminating the floodplain-spreading effect, effective protection would necessitate impractically high levees. Moreover, if those high levees are overtopped, the flood damage to the surrounding floodplain area is likely to be much worse than if the levees had not been there.
(2) Flood-control dams. Clearly, the stage and discharge hydrographs can be reduced downstream of a given point on a river by building a water-storage dam there: catch the water so as to knock down the flood peak, and release the water slowly later in times of lower discharge. The problems, aside from the great cost of building dams, is that the effect lessens downstream, so a number of dams are needed. For decades, in the mid-1900s, there was a controversy over whether to build lots of small dams in upstream areas or a few big dams in downstream areas. It was finally concluded that for effective flood control throughout the whole basin, both sets of dams would be needed.
(3) Land management. Good agricultural practices (fallow planting; terrace agriculture; contour planting) should increase infiltration and thus lower runoff, and also make the concentration time longer. Careful consideration has shown, however, that the effect is measured in tenths of an inch of equivalent rainfall, so it would be effective against minor floods but not major floods. The great benefit is greatly decreased soil erosion—which is a different (but very important) matter.
(4) Restrictions on human use of floodplains. Clearly the best way to prevent flood damage is not to put anything susceptible to damage on floodplains! The expense of relocation is usually too great for this to be practical (although it’s happening in some places; it’s a policy issue rather than a scientific issue), but intermediate measures are effective: establish floodways and spreading areas that are used for such things as agriculture (of certain kinds) and recreation, but not permanent structures. This doesn’t solve the problem for already urbanized areas, though.
Can Floods Be Predicted?
Simple answer is just “no”. Well, in a sense you can predict floods, but only after the rain has stopped falling! There are two aspects to this:
- Given the rainstorm, predict the runoff in order to create a flood hydrograph
- Given the flood hydrograph, watch the evolution of the hydrograph as the flood wave moves downstream. This technique is called flood routing.
Various approximate techniques have been developed, and continue to be refined, for predicting the nature of the flood wave downstream of a rainstorm in a drainage basin. The assumptions and approximations are many: distribution of rainfall; extent of runoff vs. infiltration; time of concentration to create the hydrograph. It works okay for very small catchments but not so well for large catchments. It’s a standard engineering technique for very small catchments (much less than one square mile). Once a flood is underway, however, there are good flood-routing techniques for predicting its future course down the river.
The other aspect of flood prediction has to do with the statistics or probability of floods. One assumes that, given the climate and the nature of the drainage basin upstream of a given point on a river, there is some underlying frequency distribution of floods, in terms of either stage or discharge. Any record of floods is then a sample population (in the parlance of statistics) from that underlying frequency distribution. So if you know the frequency distribution, you can give the probability of a given flood in a given time period (that’s not a prediction, but it’s very useful in making a cost–benefit analysis or decision). However, the probability aspect of flood prediction assumes that the climate (specifically frequency of storms and average rainfall) and hydrology (partially controlled by development in the watershed) is not changing, which is not necessarily true with climate change or land use change. If you are interested in learning more about how fluvial hydrologists go about figuring out the probability of a given flood in a given time period in a given river system, go to the advanced topic at the end of this section.
Effects of Urbanization
Urbanization can have major effects of the magnitude and frequency of floods. Here’s an example ( Figure \(\PageIndex{8}\)): Seneca Creek, near Rockville, Maryland, drains an area of 100 square miles. Its watershed has been subject to much urbanization in recent decades. Take the record of discharge, 61 years long, from 1931 to 1991, and divide it into two equal parts, early and late. The average annual flood in the period 1931–1960 was 3000 cfs, in the period 1961–1991 it was 6000 cfs—twice as great! Likewise, bank-full discharge occurred 1.2 times per year in first period but 2.2 times per year in second period.
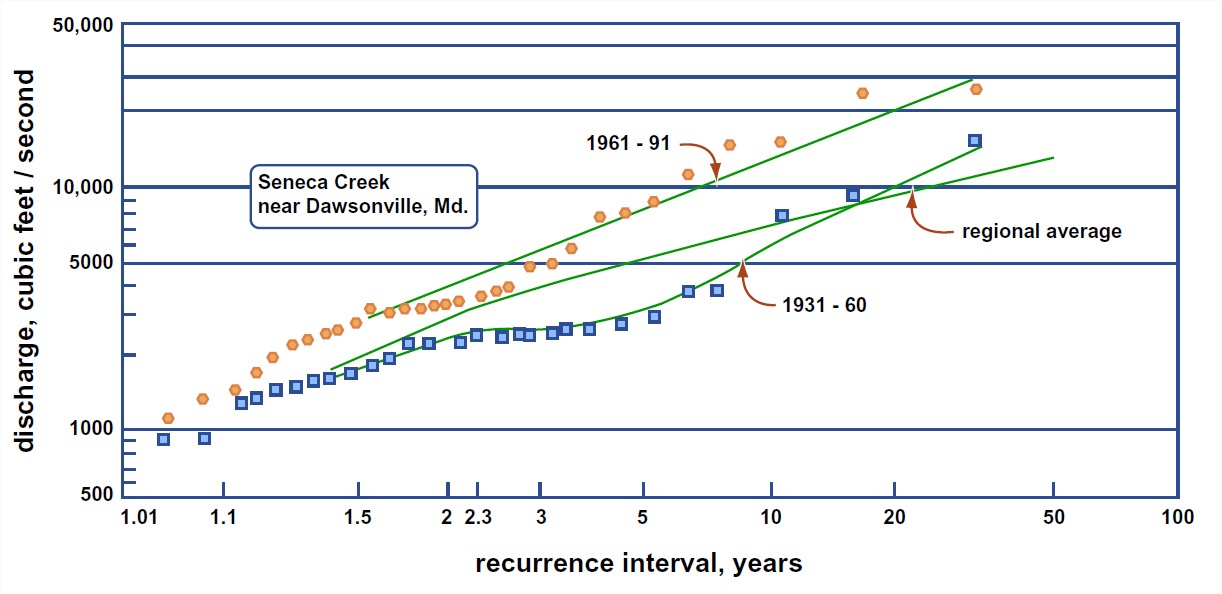
Rainfall was almost exactly the same in the two periods, so the great differences have to be accounted for entirely by the effects of urbanization effects. The stream is not artificially leveed, so presumably the effect has been caused by a decrease in concentration time; the more pavement, the faster the runoff, and the shorter the concentration time.
Effects of Aggradation
There’s a serious long-term problem in areas, especially in the lower reaches of large rivers, where crustal subsidence is non-negligible (i.e., the substrate beneath the active channel is moving downward relative to a datum like sea level) and/or where sea level itself is rising. (The former effect is more important than the latter.) The subsidence can be a combination of two effects:
- deep crustal subsidence
- subsidence caused by compaction of the sedimentary substrate of the river
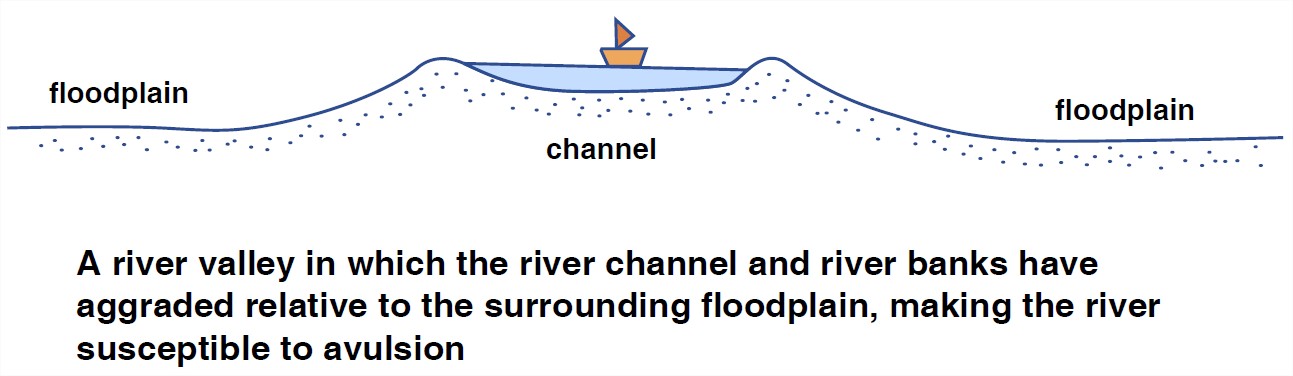
The river channel aggrades to keep pace with subsidence, and in consequence it finds itself higher and higher above its floodplain—because, under conditions of net aggradation, deposition can be much faster in the channel, where the river is transporting most of its sediment, than over the floodplain. At certain times the river breaks through some particularly vulnerable point along its natural levees and finds its way out onto the floodplain, which is now at a significantly lower elevation, and establishes a whole new course for long distances down the floodplain. The process is called avulsion; the river is said to avulse. The river then proceeds to build up its channel bed and its levees, again to be high above the floodplain, and avulse once more. Avulsions often develop over a period of time rather than happening all at once: more and more of the river discharge is diverted through the gap in the levee, flood after flood. The end result, however, is the same.
To prevent avulsion, humans in avulsion-prone areas tend to build higher and higher levees, in the hope of preventing such an unfortunate event. The channel bed gets higher and higher relative to the surrounding floodplain ( Figure \(\PageIndex{9}\)).
This is happening today in the lowermost reaches of the Mississippi River. Much of the city of New Orleans lies well below the river. The Mississippi has an unfortunate preference for flowing down the Atchafalaya River to Morgan City. The U.S. Army Corps of Engineers maintains a gigantic headworks on the left bank of the river upstream of New Orleans to prevent the entire discharge of the Mississippi from going down the Atchafalaya; at present, about a third of the discharge leaves the Mississippi at that point. How long such a situation can be maintained is a matter of some controversy. If you would like to read an engaging account of the problem with the lower Mississippi, see the book by John McPhee (1989).
China has an even bigger problem with the Huang He (in English, the Yellow River), because they have been fighting the river for far longer than we have been fighting the Mississippi. The bed of the Huang He at the city of Kaifeng is almost fifteen meters above the streets of the city, only several kilometers from the river! The Chinese are working hard to come up with a way of solving this problem in the long term; for the near term (a few more decades) the levees are considered to be adequate.
Seasonality of River Discharge
The discharge levels of streams are highly variable depending on the time of year and on specific variations in the weather from one year to the next. In Canada, most streams show discharge variability similar to that of the Stikine River in northwestern B.C., as illustrated in Figure \(\PageIndex{10}\). The Stikine River has its lowest discharge levels in the depths of winter when freezing conditions persist throughout most of its drainage basin. Discharge starts to rise slowly in May, and then rises dramatically through the late spring and early summer as a winter’s worth of snow melts. For the year shown, the minimum discharge on the Stikine River was 56 cubic meters per second (m3/s) in March, and the maximum was 37 times higher, 2,470 m3/s, in May.
© Steven Earle. CC BY. Based on from data at Water Survey of Canada, Environment Canada.
Streams in coastal areas of southern British Columbia show a very different pattern from those in most of the rest of the country because their drainage basins do not remain entirely frozen and because they receive a lot of rain (rather than snow) during the winter. The Qualicum River on Vancouver Island typically has its highest discharge levels in January or February and its lowest levels in late summer (Figure \(\PageIndex{11}\)). In 2013, the minimum discharge was 1.6 m3/s, in August, and the maximum was 34 times higher, 53 m3/s, in March.
© Steven Earle. CC BY. Based on from data at Water Survey of Canada, Environment Canada.
When a stream’s discharge increases, both the water level (stage) and the velocity increase as well. Rapidly flowing streams become muddy and large volumes of sediment are transported both in suspension and along the stream bed. In extreme situations, the water level reaches the top of the stream’s banks (the bank-full stage, see Figure \(\PageIndex{4}\)), and if it rises any more, it floods the surrounding terrain. In the case of mature or old-age streams, this could include a vast area of relatively flat ground known as a flood plain, which is the area that is typically covered with water during a major flood. Because fine river sediments are deposited on flood plains, they are ideally suited for agriculture, and thus are typically occupied by farms and residences, and in many cases, by towns or cities. Such infrastructure is highly vulnerable to damage from flooding, and the people that live and work there are at risk.
ADVANCED TOPIC: THE PROBABILITY APPROACH TO RIVER FLOODS
1. The important question that arises is: what can be done about establishing the probability of very large floods? This is extremely important, but it’s fraught with difficulties. Here’s how it’s done, given a long record of discharge at some location along the river (Figure \(\PageIndex{12}\)):
- Determine the largest momentary discharge in each year.
- Rank these in order of decreasing discharge (the highest being number one, the lowest being equal to the number of years of record).
- Compute the recurrence interval (also called the return period), in years: the average number of years within which a given event (i.e., a flood of given magnitude) will be equaled or exceeded), by the formula T = (n+1)/m, where T is the recurrence interval, n is the number of years in the record, and m is the rank of the event (or, equivalently, the probability p of a given event being equaled or exceeded in any given year; that’s called the exceedence probability).
- Plot the results in a graph with recurrence interval and/or exceedence probability on the horizontal axis and the annual maximum discharge on the vertical axis.
- Fit a smooth curve through the points in some way.
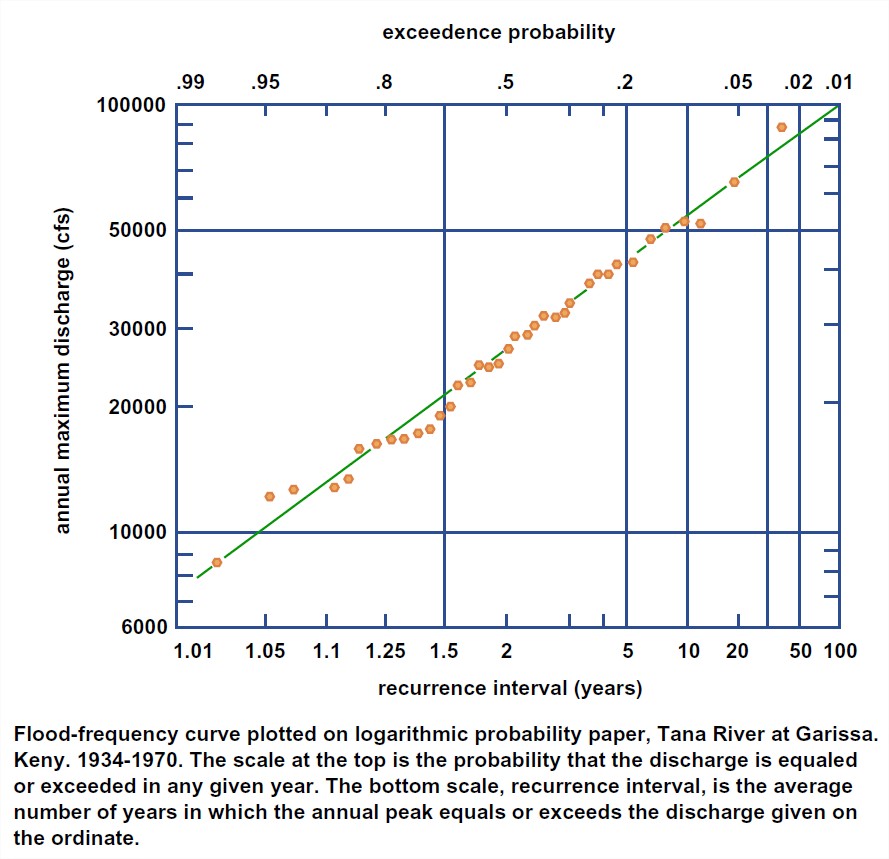
2. The results are reliable for the mid-range of the graph, but they become very uncertain near the high-discharge end because of the small numbers of very large events. Fitting such a tail of a distribution is always tricky business, but it is important if one is to try to extrapolate to much longer times, which is one of the important goals of such an exercise. Various techniques have been in use for fitting such a curve. Several such distributions have been in use. The trouble with blind curve fitting is that one or two unrepresentative or outlying points at the high-discharge end can bias the curve significantly.
3. One valuable approach is to try to determine, from historical records, whether the greatest discharge in the period of record was exceeded in earlier times. If the greatest discharge in the period of record can be established to have been greater than any other for a number of years before the period of record, the period of record can be extended back in time and the ranking redone. This tends to shift the unrepresentatively large outlying point to the right and bring it more closely in line with the rest of the distribution.
Contributors and Attributions
Modified by Kyle Whittinghill (University of Pittsburgh) from the following sources:
- 5.12: Floods by John Southard, is licensed CC BY-NC-SA
- Stream Types, Stream Erosion and Deposition, and Flooding from Physical Geology by Steven Earle (licensed under a Creative Commons Attribution 4.0 International License)