
8: Photosynthesis Lab
- Page ID
- 163246

\( \newcommand{\vecs}[1]{\overset { \scriptstyle \rightharpoonup} {\mathbf{#1}} } \)
\( \newcommand{\vecd}[1]{\overset{-\!-\!\rightharpoonup}{\vphantom{a}\smash {#1}}} \)
\( \newcommand{\dsum}{\displaystyle\sum\limits} \)
\( \newcommand{\dint}{\displaystyle\int\limits} \)
\( \newcommand{\dlim}{\displaystyle\lim\limits} \)
\( \newcommand{\id}{\mathrm{id}}\) \( \newcommand{\Span}{\mathrm{span}}\)
( \newcommand{\kernel}{\mathrm{null}\,}\) \( \newcommand{\range}{\mathrm{range}\,}\)
\( \newcommand{\RealPart}{\mathrm{Re}}\) \( \newcommand{\ImaginaryPart}{\mathrm{Im}}\)
\( \newcommand{\Argument}{\mathrm{Arg}}\) \( \newcommand{\norm}[1]{\| #1 \|}\)
\( \newcommand{\inner}[2]{\langle #1, #2 \rangle}\)
\( \newcommand{\Span}{\mathrm{span}}\)
\( \newcommand{\id}{\mathrm{id}}\)
\( \newcommand{\Span}{\mathrm{span}}\)
\( \newcommand{\kernel}{\mathrm{null}\,}\)
\( \newcommand{\range}{\mathrm{range}\,}\)
\( \newcommand{\RealPart}{\mathrm{Re}}\)
\( \newcommand{\ImaginaryPart}{\mathrm{Im}}\)
\( \newcommand{\Argument}{\mathrm{Arg}}\)
\( \newcommand{\norm}[1]{\| #1 \|}\)
\( \newcommand{\inner}[2]{\langle #1, #2 \rangle}\)
\( \newcommand{\Span}{\mathrm{span}}\) \( \newcommand{\AA}{\unicode[.8,0]{x212B}}\)
\( \newcommand{\vectorA}[1]{\vec{#1}} % arrow\)
\( \newcommand{\vectorAt}[1]{\vec{\text{#1}}} % arrow\)
\( \newcommand{\vectorB}[1]{\overset { \scriptstyle \rightharpoonup} {\mathbf{#1}} } \)
\( \newcommand{\vectorC}[1]{\textbf{#1}} \)
\( \newcommand{\vectorD}[1]{\overrightarrow{#1}} \)
\( \newcommand{\vectorDt}[1]{\overrightarrow{\text{#1}}} \)
\( \newcommand{\vectE}[1]{\overset{-\!-\!\rightharpoonup}{\vphantom{a}\smash{\mathbf {#1}}}} \)
\( \newcommand{\vecs}[1]{\overset { \scriptstyle \rightharpoonup} {\mathbf{#1}} } \)
\(\newcommand{\longvect}{\overrightarrow}\)
\( \newcommand{\vecd}[1]{\overset{-\!-\!\rightharpoonup}{\vphantom{a}\smash {#1}}} \)
\(\newcommand{\avec}{\mathbf a}\) \(\newcommand{\bvec}{\mathbf b}\) \(\newcommand{\cvec}{\mathbf c}\) \(\newcommand{\dvec}{\mathbf d}\) \(\newcommand{\dtil}{\widetilde{\mathbf d}}\) \(\newcommand{\evec}{\mathbf e}\) \(\newcommand{\fvec}{\mathbf f}\) \(\newcommand{\nvec}{\mathbf n}\) \(\newcommand{\pvec}{\mathbf p}\) \(\newcommand{\qvec}{\mathbf q}\) \(\newcommand{\svec}{\mathbf s}\) \(\newcommand{\tvec}{\mathbf t}\) \(\newcommand{\uvec}{\mathbf u}\) \(\newcommand{\vvec}{\mathbf v}\) \(\newcommand{\wvec}{\mathbf w}\) \(\newcommand{\xvec}{\mathbf x}\) \(\newcommand{\yvec}{\mathbf y}\) \(\newcommand{\zvec}{\mathbf z}\) \(\newcommand{\rvec}{\mathbf r}\) \(\newcommand{\mvec}{\mathbf m}\) \(\newcommand{\zerovec}{\mathbf 0}\) \(\newcommand{\onevec}{\mathbf 1}\) \(\newcommand{\real}{\mathbb R}\) \(\newcommand{\twovec}[2]{\left[\begin{array}{r}#1 \\ #2 \end{array}\right]}\) \(\newcommand{\ctwovec}[2]{\left[\begin{array}{c}#1 \\ #2 \end{array}\right]}\) \(\newcommand{\threevec}[3]{\left[\begin{array}{r}#1 \\ #2 \\ #3 \end{array}\right]}\) \(\newcommand{\cthreevec}[3]{\left[\begin{array}{c}#1 \\ #2 \\ #3 \end{array}\right]}\) \(\newcommand{\fourvec}[4]{\left[\begin{array}{r}#1 \\ #2 \\ #3 \\ #4 \end{array}\right]}\) \(\newcommand{\cfourvec}[4]{\left[\begin{array}{c}#1 \\ #2 \\ #3 \\ #4 \end{array}\right]}\) \(\newcommand{\fivevec}[5]{\left[\begin{array}{r}#1 \\ #2 \\ #3 \\ #4 \\ #5 \\ \end{array}\right]}\) \(\newcommand{\cfivevec}[5]{\left[\begin{array}{c}#1 \\ #2 \\ #3 \\ #4 \\ #5 \\ \end{array}\right]}\) \(\newcommand{\mattwo}[4]{\left[\begin{array}{rr}#1 \amp #2 \\ #3 \amp #4 \\ \end{array}\right]}\) \(\newcommand{\laspan}[1]{\text{Span}\{#1\}}\) \(\newcommand{\bcal}{\cal B}\) \(\newcommand{\ccal}{\cal C}\) \(\newcommand{\scal}{\cal S}\) \(\newcommand{\wcal}{\cal W}\) \(\newcommand{\ecal}{\cal E}\) \(\newcommand{\coords}[2]{\left\{#1\right\}_{#2}}\) \(\newcommand{\gray}[1]{\color{gray}{#1}}\) \(\newcommand{\lgray}[1]{\color{lightgray}{#1}}\) \(\newcommand{\rank}{\operatorname{rank}}\) \(\newcommand{\row}{\text{Row}}\) \(\newcommand{\col}{\text{Col}}\) \(\renewcommand{\row}{\text{Row}}\) \(\newcommand{\nul}{\text{Nul}}\) \(\newcommand{\var}{\text{Var}}\) \(\newcommand{\corr}{\text{corr}}\) \(\newcommand{\len}[1]{\left|#1\right|}\) \(\newcommand{\bbar}{\overline{\bvec}}\) \(\newcommand{\bhat}{\widehat{\bvec}}\) \(\newcommand{\bperp}{\bvec^\perp}\) \(\newcommand{\xhat}{\widehat{\xvec}}\) \(\newcommand{\vhat}{\widehat{\vvec}}\) \(\newcommand{\uhat}{\widehat{\uvec}}\) \(\newcommand{\what}{\widehat{\wvec}}\) \(\newcommand{\Sighat}{\widehat{\Sigma}}\) \(\newcommand{\lt}{<}\) \(\newcommand{\gt}{>}\) \(\newcommand{\amp}{&}\) \(\definecolor{fillinmathshade}{gray}{0.9}\)Purpose:
This lab explores the process of photosynthesis, focusing on pigment separation, absorption spectra, and photosynthetic rates in leaves. Students will apply chromatography and spectrophotometry to study plant pigments and analyze photosynthetic efficiency under different conditions.
Tasks:
- Extract pigments from spinach leaves and separate them using paper chromatography.
- Analyze the absorption spectrum of chlorophyll pigments using a spectrophotometer.
- Measure the rate of photosynthesis in leaf disks under different conditions.
Criteria for Success:
- Accurately separate and identify pigments in chromatography experiments.
- Collect and interpret spectrophotometric and photosynthetic rate data.
- Record observations and calculate retention factors (Rf values) for pigments.
Timeline for Photosynthesis Lab:
- Introduction and Setup (15 minutes): Overview of photosynthesis and lab objectives.
- Pigment Extraction and Chromatography (20 minutes): Extract pigments and separate them using paper chromatography.
- Absorption Spectrum Analysis (25 minutes): Measure pigment absorption using a spectrophotometer.
- Photosynthetic Rate Measurement (35 minutes): Count floating disks in water and bicarbonate solutions.
- Data Compilation and Discussion (15 minutes): Analyze results, calculate Rf values, and discuss findings.
Introduction
Have you ever wondered why leaves change colors in the fall but remain green during other seasons of the year? Leaves contain multiple types of pigments that are involved in many different functions in the plant, including photosynthesis, protection from UV radiation, and even attracting pollinators. Pigment molecules are stored inside of plastids, a class of cellular organelles that includes chloroplasts, the organelles responsible for photosynthesis. Found inside chloroplasts, chlorophyll is the most common pigment in a leaf. It comes in two varieties (chlorophyll a and chlorophyll b). During the spring and summer months, when day length is longest and the sunlight is most direct, plants produce a large amount of chlorophyll, which is used to capture sunlight energy that drives photosynthesis.
All of the wavelengths of energy emitted by the sun are collectively called the electromagnetic spectrum. Waves at the low end of the spectrum (those with the longest wavelengths), like radio waves and microwaves, emit less energy, while waves at the high end (those with the shortest wavelengths), like x-rays and gamma rays, emit higher energy. The very small section of the electromagnetic spectrum that humans can see is called the visible light spectrum. Plants can use these same wavelengths of light, from red at the low end to violet at the high end of the visible light spectrum, to power photosynthesis(Fig. 1).
Photosynthesis is the process by which plants use energy from the sun and water from the soil to convert atmospheric carbon dioxide into sugar (glucose) that can be used for energy production (Fig. 2).
Different pigments absorb and reflect different wavelengths of light and therefore appear different colors to us. During the spring and summer months, when plants are most productive, they produce a huge amount of chlorophyll molecules. Chlorophyll a and chlorophyll b absorb mostly at the red-to-orange and blue-to-violet ends of the visible light spectrum; they reflect the rest of the wavelengths. The reflected wavelengths, mostly in the yellow-to-green range, are the wavelengths that are detected by the human eye. This is why plants appear green to us (Fig. 3).
Another class of pigments found in plants is the carotenoids. Carotenoids include carotenes, which appear yellow-orange, and xanthophylls, which appear mostly yellow. These pigments are found in the plant all year round but are largely masked by the abundant chlorophyll molecules that are present during the spring and summer. Carotenoids play a minor role in photosynthesis, but they play a larger role in protecting the plant tissues from damage caused by UV radiation from the sun.
As summer gives way to fall, day length gets shorter, temperatures decrease, and water may become less available. Plants stop producing new chlorophyll molecules, and the remaining chlorophyll molecules are broken down and reabsorbed to be used again in the following spring. Carotenoids break down more slowly, which is why we can see their yellow and orange colors showing through as chlorophyll is lost from the leaves.
Lab Safety
Safety Guidelines for Handling Chemicals and Equipment:
- Wear gloves and goggles during all procedures involving solvents and UV light.
- Handle isopropyl alcohol and solvents carefully; they are flammable and should be used in a ventilated area.
- Avoid direct exposure to UV light; do not look directly at the light source.
- Dispose of chemical and biological waste in designated containers.
Suggested Student Roles and Group Size
For groups of 3 students:
- Chromatography Specialist: Prepares chromatography sheets and applies pigment extracts. Cuts and vacuums leaf discs in exercise 3.
- Spectrophotometer Operator: Calibrates and uses the spectrophotometer to collect absorption data. Sets up cup experiment in exercise 3.
- Data Recorder: Records and organizes data, calculates Rf values, and ensures worksheets are complete.
If two groups (6 students) combine:
- Add a Photosynthesis Monitor to count floating disks and a Materials Manager to prepare solutions and manage clean-up.
Exercise 1: Separation of Plant Pigments Using Chromatography
In this lab, you will first extract pigments from spinach leaves and then separate pigments from one another using a technique called chromatography. Chromatography is used to separate chemicals based on their varying solubilities in selected solvents. Recall from our discussions of the Chemistry of Life (textbook chapter), molecules and compounds are classified as polar or nonpolar, and that “like dissolves like.” In other words, polar compounds dissolve in polar solvents, but not in non-polar solvents, and vice versa. An example of this concept is seen when oil, a nonpolar substance, comes in contact with water, a polar substance. The two substances do not mix; they are repelled by one another. Chromatography works by separating chemicals according to their varying degrees of polarity. In chromatography experiments, there are two “phases,” the stationary phase, which does not move, and the mobile phase, which travels across the stationary phase.
In this experiment, you will use paper chromatography. Paper, which is made of cellulose, is very polar, and acts as the stationary phase. The solvent you will use is a mixture of isopropyl alcohol and water, both of which are partially nonpolar and partially polar. The solvent acts as the mobile phase.
Extracted plant pigments are applied to the paper, and the paper is placed in the solvent. As the solvent moves up the paper through capillary action, it carries the pigments along with it. More polar pigments are attracted to the polar cellulose molecules in the stationary phase (the paper), so they move more slowly as the solvent travels up the paper. Nonpolar pigments are more strongly attracted to the nonpolar solvent and tend to stay in solution longer, thus moving farther up the paper. The pigments are carried at different rates because they are not equally soluble. Since different pigment molecules have different molecular structures and varying degrees of polarity, this technique works well to separate pigments from one another, giving us a clear look at each pigment individually.
The distance that each pigment travels will be unique to that pigment based on the solvent selected. These migration distances can be used to calculate the Rf (retention factor) value, which is simply calculated by dividing the distance traveled by the pigment over the distance traveled by the solvent.
Rf = distance traveled by pigment (cm) / distance traveled by solvent (cm)
Materials
| Equipment | Materials |
| Mortar and pestle | Fresh spinach leaves |
| Filter paper or cheesecloth | 91% isopropyl alcohol (IPA)- warmed to 40℃ in a water bath |
| Small funnel | Clean sand |
| Test tubes | |
| Electronic balance | |
| Weigh boat | |
| Handheld UV light (Turn lights off in lab and shine handheld UV light on extracts to cause fluorescence) |
For Chromatography:
Materials
| Equipment | Materials |
|---|---|
| Chromatography paper | Solvent mixture: 90% isopropyl alcohol, 10% water- warmed to 40℃ in a water bath |
| Glass jar with lid | |
| Small funnel | |
| Pencil | |
| Metric ruler | |
| Capillary tube or disposable micropipette |
For Spectroscopy:
| Equipment | Materials |
| PASCO Wireless Spectrometer | |
| Plastic cuvettes | |
| iPad or laptop | |
| Transfer pipettes |
Procedures
A. Pigment Extraction
- Obtain and weigh 4.0g fresh spinach leaves. Tear leaves into small pieces, discarding the large midvein.
- Add leaves and a small pinch of sand to the mortar
- Add 15mL warm (40°C) isopropyl alcohol
- Grind thoroughly for 5 minutes until paste-like
- Let stand 2 minutes, then filter through a cheesecloth-lined funnel into a test tube
- If the solution is too concentrated for the spectrophotometer, dilute with more IPA until the solution is translucent and not cloudy
- Examine your chlorophyll extract under UV light. Turn off the lights in the lab and shine the fluorescent black light onto the extract. Do not look into the light directly. Observe any changes to the pigment.
B. Pigment Separation
NOTE: The organic solvents used in this step are extremely volatile and flammable. Keep the lid on the solvent containers when not in use.
Paper chromatography requires that the atmosphere within the chromatography jar be completely saturated with solvent. Be sure that the lid or aluminum foil covering the jar stays in place securely before and during chromatogram development.
ONLY TOUCH THE EDGES THE PAPER; oils from your skin can interfere with the movement of solvent on the paper.
- Prepare chromatography sheet: Use the pencil to draw a line 2 cm from the bottom of the paper.
- This line will serve as a guide when applying the spinach extract. It will help ensure that the extract is applied evenly, in a straight line, and at a level above the solvent in the chromatography jar.
- Apply pigment: Using a glass capillary tube (or a disposable pipette with a very fine tip), apply the pigment extract to the paper in a linear series of small dots on the line you created. NOTE: Leave a 1 cm margin at each edge that is free of pigment extract.
- Allow enough time for the extract to dry then re-apply more pigment directly on top of the first application. Repeat this dry and reapply process until there is a significant buildup of pigment extract on the paper. The more layers of pigment you apply, the better your results will be. Allow the sample to dry.
- Add approximately 20 mL of chromatography solution (alcohol) to the jar to about 1 cm deep from the bottom of the jar.
- Lower the paper into the jar so that the bottom edge is in the alcohol but the pigment is NOT touching the alcohol. You can fold the top edge of the paper over the lip of the jar and use the cap of the jar to hold the paper in place (see figure below for an example).
- Alternatively, you can roll the paper into a cylinder so that the line faces outward and is toward the bottom of the jar. You can secure this cylinder shape by using a stapler to staple the top of the paper. Place the rolled paper into the jar so that it is resting in the chromatography solution. The chromatography solution should not be high enough to touch the pigments on the paper.

- Cover the jar with the lid or aluminum foil and observe as the chromatography solvent travels up the paper. Allow the solvent to climb the paper for a minimum of 20 minutes.
- Before the solvent front has reached the top edge, remove the chromatogram and allow it to dry on the benchtop. Make sure to use a pencil to draw a line to indicate where the solvent ended.
- You should be able to see at least four distinct bands. (There may be as many as six bands.)
- Make a sketch of your chromatogram using the template that follows or insert a picture with the bands outlined in pencil. If drawing, use colored pencils to show the band colors.
- Use Table 1 to help you identify each pigment. On your sketch, label each band with the name of the pigment.
- Mark the distance (in cm) from the initial pigment band to each colored band as well as the total distance from the initial pigment band to the solvent front.
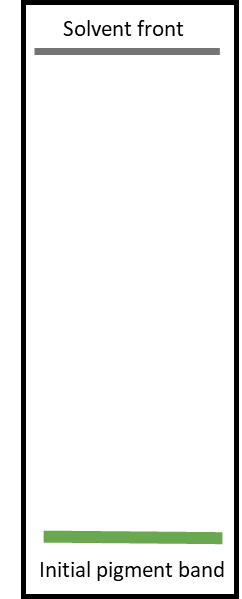
Sketch of Resulting Chromatogram:
|
Pigment |
Band Color |
Function |
|---|---|---|
|
Chlorophyll a |
Blue-green |
Primary photosynthetic pigment |
|
Chlorophyll b |
Yellow-green |
Accessory pigment broadens light absorption |
|
Carotene (Carotenoids) |
Orange |
Protects from photo damage, aids in light capture |
|
Xanthophyll |
Yellow |
Protects against excess light energy |
|
Anthocyanins |
Red, Purple, or Blue* |
Provides color in flowers/fruits, UV protection |
|
Pheophytin |
Gray or Olive-green |
Degraded chlorophyll, indicative of breakdown |
- Use the data from your sketch to complete the data table below. Calculate the \(R_f\) value and include that in your data table.
\[R_f = \dfrac{\text{distance traveled by pigment (cm)}}{\text{distance traveled by solvent (cm)}} \nonumber\]
|
A |
B |
C |
D |
E |
|---|---|---|---|---|
|
Name of Pigment |
Description of color |
Distance solvent front traveled from initial pigment band |
Distance pigment traveled from initial pigment band |
Rf value of pigment (column D / column C) |
Exercise 2: Analysis of the Absorption Spectrum of Leaves
While we know most leaves are green, we have now seen that other pigments are also found in the leaves. The green color that we observe is a consequence of reflected light in the wavelengths of about 550-500nm in size (Fig. 3). In the autumn months of the year, many plants stop producing chlorophyll, revealing the colors of the other pigments beneath. Every chemical has a specific set of wavelengths it can absorb and thus be identified. By analyzing the absorption spectrum of leaf pigments, we can infer what wavelengths of light will be useful in photosynthesis.
Equipment Setup
- Connect PASCO spectrometer to device:
○ For iPad: Use Bluetooth connection
○ For laptop: Connect via USB cable
○ Open PASCO Spectrometer application
○ Select "Analyze Solution" from top menu
i. Make a new reading file if an old file is still open
Calibration Steps (see figure below)
- Baseline Calibration:
- Select "Calibrate Dark" from the bottom menu
- Cover the sample well completely with your hand
- Wait for the checkmark to appear (~5 seconds)
- This sets your "zero light" reference point
- Reference Calibration:
- Fill cuvette ¾ full with pure isopropyl alcohol (blank)
- Handle cuvette only by ribbed sides
- Place in well with clear sides facing light source
- Select "Calibrate Reference"
- Wait for the checkmark to appear
- This sets your "100% transmission" reference point

Sample Analysis
- Sample Preparation:
- Dilute your extract if needed (solution should be translucent)
- Start with 1:4 dilution (1 part extract : 3 parts IPA)
- Fill cuvette ¾ full with diluted sample
- Wipe outside of cuvette with lens paper
- Data Collection:
- Place sample cuvette in well
- Press "Start Recording"
- Wait for reading to stabilize (~10 seconds)
- If peaks are flat-topped (saturated):
- Remove sample and add more IPA
- Rerun measurement
- If peaks are too small:
- Use more concentrated sample
- Press "Stop Recording" when satisfied
Data Analysis
- Peak Identification:
- Use "Add Coordinate" tool to mark absorption peak
- Expected peaks:
- Chlorophyll a: 430nm and 662nm
- Chlorophyll b: 453nm and 642nm
- Carotenoids: broad peak 420-480nm
- Record Data:
- Wavelength (nm) of each major peak
- Absorption value at each peak
- Write these values in table 2
Troubleshooting Guide
Common Issues:
- Flat-topped peaks:
- Solution: Dilute sample more
- Indicates detector saturation
- Noisy/jagged spectrum:
- Solution: Check calibration
- Ensure cuvette is clean and properly placed
- No peaks visible:
- Solution: Use more concentrated sample
- Check instrument calibration
- Verify extract contains pigments
- Shifted peaks:
- Solution: Check pH of solution
- Verify solvent is pure IPA
Understanding Your Results
- Peak Analysis:
- Higher absorbance = more pigment present
- Peak location identifies specific pigments
- Peak width indicates pigment interaction
- Biological Significance:
- 430-460nm peaks: blue light absorption
- 640-670nm peaks: red light absorption
- Green light gap: reflected (why leaves appear green)
- Calculate Relative Concentrations:
- Compare peak heights between samples
- Higher peaks indicate more pigment
- Use Beer-Lambert Law if quantification is needed
|
Pigment |
Peak Absorption Wavelengths (nm) |
Record your actual peak measurements if they closely correspond to the stated values |
Pigment present in sample? (YES or NO) |
|
Chlorophyll A |
430 |
||
|
662 |
|||
|
Chlorophyll B |
453 |
||
|
642 |
|||
|
Carotenoids |
460 |
||
|
550 |
|||
|
Anthocyanins |
520* |
||
|
Xanthophyll |
494 |
||
|
Betalains |
535 |
||
|
480* |
|||
|
Other Peak(s) observed |
Exercise 3: Measuring the Rate of Photosynthesis
Background
Inside every leaf is an intricate system that powers plant life on Earth. Each leaf cell contains chloroplasts - tiny organelles filled with green chlorophyll that capture light energy for photosynthesis.
Beyond just light, plants need carbon dioxide, which enters through microscopic pores called stomata and dissolves in the water inside leaf cells. The spaces between leaf cells create a network of channels where gases can move throughout the tissue, similar to the internal structure of your lungs. During photosynthesis, these spaces gradually fill with oxygen as it's produced, similar to how a sponge fills with water.
In nature, this oxygen typically diffuses out through the stomata. In this experiment, we will trap this oxygen inside the leaves by submerging them in water in order to create buoyancy. Adding sodium bicarbonate to water provides extra dissolved carbon dioxide that plants can absorb directly through their cell membranes, potentially enabling faster photosynthesis than they could achieve using only the carbon dioxide naturally present in the water that we will submerge the leaves in.
(remixed from link CCBY 2.1.1)
Materials
| Equipment | Materials |
| Hole punch | Fresh leaves |
| 2 clear plastic cups | Sodium bicarbonate solution (source of CO₂) |
| Syringe (10mL) | Water |
| 2 index cards | Dilute detergent |
| Light source | |
| 2 Petri dishes (optional) | |
| Timer |
Employing Steps in the Scientific Method:
- Record the Question that is being investigated in this experiment. ________________________________________________________________
- Record a Hypothesis for the question stated above. ________________________________________________________________
- Predict the results of the experiment based on your hypothesis (if/then). ________________________________________________________________
Procedure:
Solution Preparation to Establish Test Conditions
- Prepare two cups:
- Label the first cup "Sodium Bicarbonate" and add 75mL of the solution or fill about half the cup.
- Bicarbonate provides CO₂ needed for photosynthesis
- Label the second cup "Water" and add 75mL water or fill about half the cup.
- Add one drop of dilute detergent to each cup
- The detergent breaks the surface tension, allowing the solution to enter the leaves
Leaf Disk Preparation to Create Uniform Samples
- Fold two index cards in half, then unfold
- Creates clean surface for collecting disks
- Punch 10 leaf disks for each treatment
- Avoid large veins (they affect floating)
- Keep the hole punch closed while tapping to release the disk
- Uniform disk size ensures consistent results
Vacuum Infiltration Process to remove air from leaf tissue
- For Bicarbonate Solution:
- Remove syringe plunger
- Add 10 leaf disks using folded paper as a funnel
- Replace plunger to 1mL mark (protects disks)
- Draw up 5mL bicarbonate/detergent solution
- Remove air bubbles by holding upright and pushing gently
- Create Vacuum:
- Cover the syringe tip with your thumb
- Pull the plunger to 10mL while gently shaking
- This removes air from leaf tissue spaces
- Allows solution to enter the air spaces in the leaf
- Hold 10 seconds
- Release plunger (keep thumb on tip)
- Solution will replace air in leaf tissue
- Repeat this process until the the disks sink
- Transfer disks to labeled cup
- Swirl to prevent disks from sticking to the sides
- Repeat this entire process with water solution
Experimental Setup
- Place the cups as close to a bright light source as possible. Up against a bulb is ideal.
- Place a water-filled petri dish on top of each cup if needed
- This acts as a heat filter
- Prevents temperature differences between samples
- If using LED bulbs, this heat sink may not be needed. Ask your instructor for instructions.
- Keep liquids away from electrical components
Data Collection to quantify the photosynthetic rate
- Start a timer
- Each minute for 16 minutes:
- Count floating disks in each cup
- Record in data table
- Floating indicates oxygen buildup from photosynthesis, refilling the air spaces
- More floaters = higher photosynthesis rate
Expected Results
- Bicarbonate disks should float faster (more CO₂ available)
- Water-only disks float more slowly (limited CO₂)
- Some disks may not
Troubleshooting disks won't sink: Repeat vacuum process
- If no disks float: Check light intensity. Verify that you used the correct solution.
- If results vary greatly: Check leaf disk uniformity
|
Minute |
In Water/Detergent |
In Bicarbonate/Detergent |
|---|---|---|
|
1 |
||
|
2 |
||
|
3 |
||
|
4 |
||
|
5 |
||
|
6 |
||
|
7 |
||
|
8 |
||
|
9 |
||
|
10 |
||
|
11 |
||
|
12 |
||
|
13 |
||
|
14 |
||
|
15 |
||
|
16 |
Extension Activity: (Optional)
The results of this experiment can be presented graphically. The presentation of your data in a graph will assist you in interpreting your results. Based on your results, you can complete the final step of scientific investigation, in which you must be able to propose a logical argument that either allows you to support or reject your initial hypothesis.
- Graph your results using the data from Table 2, using different symbols for the leaf disks in water vs. the leaf disks in bicarbonate solution. Follow APA guidelines for making a line graph.
- What is the dependent variable? Which axis is used to graph this data?______________________________________________________________________
What is your independent variable? Which axis is used to graph this data? ______________________________________________________________________
Questions
- Complete the following sentence:
Photosynthesis is a set of ____________________________ in which ____________energy is converted to __________________energy.
- Explain why there was a color change in the green pigment when UV light was shined into the extract.
- Why do some trees appear green in the summer but change colors in the fall?
- What optimal wavelengths (or peaks) did you observe for both chlorophyll a and b?
- Do your leaf disks float? Use the information in this diagram of a cross-section of a leaf to explain why a leaf disk would float.

- Where does photosynthesis occur in a leaf? State which organelles carry out photosynthesis and which type or types of leaf cells have this organelle.
- Explain why it is useful to the plant to have air spaces around the spongy mesophyll cells in the leaves. (Hint: Recall the chemical equation for photosynthesis.
- What was the purpose of the sodium bicarbonate in this experiment?
- Leaf disks normally float. What caused the leaf disks to sink?
- Leaf disks normally float. What caused the leaf disks to sink?
- Suppose that a leaf disk that has had the air sucked out is placed in a bicarbonate solution under a dim light that results in a low rate of photosynthesis that just equals the rate of cellular respiration. Would you expect this leaf disk to float? Explain why or why not.
- How do these differences in polarity affect the movement of the pigments up the chromatography paper? Explain why this is observed.
- What does the abbreviation Rf stand for? How is it calculated? What does it tell us?
- How do you think the knowledge obtained from your chromatogram and the spectrograms relate to our understanding of plant pigments?
Practical Challenge
- Use the chromatogram below to calculate Rf values

Rf = distance traveled by pigment (cm) / distance traveled by solvent (cm)
- Based on these calculations, what do you think both high and low Rf values can tell you about the substances?
- Some years, autumn leaf colors are much less bright or intense than other years. Speculate why this might be.
- If Solution A moves 4 cm and Solution B moves 4.5 cm on a piece of chromatography paper, when the solvent moves 10 cm, which is the most polar solution? Explain your answer.
Alignment with Program Competencies
|
Lab Task |
SLO/Competency Alignment |
|---|---|
|
Chromatography and Rf values |
Develops technical lab skills |
|
Absorption spectrum analysis |
Applies critical thinking and quantitative reasoning |
|
Measuring photosynthetic rates |
Connects biological principles to experimental data |