
2: Scientific Method
- Page ID
- 163240

\( \newcommand{\vecs}[1]{\overset { \scriptstyle \rightharpoonup} {\mathbf{#1}} } \)
\( \newcommand{\vecd}[1]{\overset{-\!-\!\rightharpoonup}{\vphantom{a}\smash {#1}}} \)
\( \newcommand{\dsum}{\displaystyle\sum\limits} \)
\( \newcommand{\dint}{\displaystyle\int\limits} \)
\( \newcommand{\dlim}{\displaystyle\lim\limits} \)
\( \newcommand{\id}{\mathrm{id}}\) \( \newcommand{\Span}{\mathrm{span}}\)
( \newcommand{\kernel}{\mathrm{null}\,}\) \( \newcommand{\range}{\mathrm{range}\,}\)
\( \newcommand{\RealPart}{\mathrm{Re}}\) \( \newcommand{\ImaginaryPart}{\mathrm{Im}}\)
\( \newcommand{\Argument}{\mathrm{Arg}}\) \( \newcommand{\norm}[1]{\| #1 \|}\)
\( \newcommand{\inner}[2]{\langle #1, #2 \rangle}\)
\( \newcommand{\Span}{\mathrm{span}}\)
\( \newcommand{\id}{\mathrm{id}}\)
\( \newcommand{\Span}{\mathrm{span}}\)
\( \newcommand{\kernel}{\mathrm{null}\,}\)
\( \newcommand{\range}{\mathrm{range}\,}\)
\( \newcommand{\RealPart}{\mathrm{Re}}\)
\( \newcommand{\ImaginaryPart}{\mathrm{Im}}\)
\( \newcommand{\Argument}{\mathrm{Arg}}\)
\( \newcommand{\norm}[1]{\| #1 \|}\)
\( \newcommand{\inner}[2]{\langle #1, #2 \rangle}\)
\( \newcommand{\Span}{\mathrm{span}}\) \( \newcommand{\AA}{\unicode[.8,0]{x212B}}\)
\( \newcommand{\vectorA}[1]{\vec{#1}} % arrow\)
\( \newcommand{\vectorAt}[1]{\vec{\text{#1}}} % arrow\)
\( \newcommand{\vectorB}[1]{\overset { \scriptstyle \rightharpoonup} {\mathbf{#1}} } \)
\( \newcommand{\vectorC}[1]{\textbf{#1}} \)
\( \newcommand{\vectorD}[1]{\overrightarrow{#1}} \)
\( \newcommand{\vectorDt}[1]{\overrightarrow{\text{#1}}} \)
\( \newcommand{\vectE}[1]{\overset{-\!-\!\rightharpoonup}{\vphantom{a}\smash{\mathbf {#1}}}} \)
\( \newcommand{\vecs}[1]{\overset { \scriptstyle \rightharpoonup} {\mathbf{#1}} } \)
\(\newcommand{\longvect}{\overrightarrow}\)
\( \newcommand{\vecd}[1]{\overset{-\!-\!\rightharpoonup}{\vphantom{a}\smash {#1}}} \)
\(\newcommand{\avec}{\mathbf a}\) \(\newcommand{\bvec}{\mathbf b}\) \(\newcommand{\cvec}{\mathbf c}\) \(\newcommand{\dvec}{\mathbf d}\) \(\newcommand{\dtil}{\widetilde{\mathbf d}}\) \(\newcommand{\evec}{\mathbf e}\) \(\newcommand{\fvec}{\mathbf f}\) \(\newcommand{\nvec}{\mathbf n}\) \(\newcommand{\pvec}{\mathbf p}\) \(\newcommand{\qvec}{\mathbf q}\) \(\newcommand{\svec}{\mathbf s}\) \(\newcommand{\tvec}{\mathbf t}\) \(\newcommand{\uvec}{\mathbf u}\) \(\newcommand{\vvec}{\mathbf v}\) \(\newcommand{\wvec}{\mathbf w}\) \(\newcommand{\xvec}{\mathbf x}\) \(\newcommand{\yvec}{\mathbf y}\) \(\newcommand{\zvec}{\mathbf z}\) \(\newcommand{\rvec}{\mathbf r}\) \(\newcommand{\mvec}{\mathbf m}\) \(\newcommand{\zerovec}{\mathbf 0}\) \(\newcommand{\onevec}{\mathbf 1}\) \(\newcommand{\real}{\mathbb R}\) \(\newcommand{\twovec}[2]{\left[\begin{array}{r}#1 \\ #2 \end{array}\right]}\) \(\newcommand{\ctwovec}[2]{\left[\begin{array}{c}#1 \\ #2 \end{array}\right]}\) \(\newcommand{\threevec}[3]{\left[\begin{array}{r}#1 \\ #2 \\ #3 \end{array}\right]}\) \(\newcommand{\cthreevec}[3]{\left[\begin{array}{c}#1 \\ #2 \\ #3 \end{array}\right]}\) \(\newcommand{\fourvec}[4]{\left[\begin{array}{r}#1 \\ #2 \\ #3 \\ #4 \end{array}\right]}\) \(\newcommand{\cfourvec}[4]{\left[\begin{array}{c}#1 \\ #2 \\ #3 \\ #4 \end{array}\right]}\) \(\newcommand{\fivevec}[5]{\left[\begin{array}{r}#1 \\ #2 \\ #3 \\ #4 \\ #5 \\ \end{array}\right]}\) \(\newcommand{\cfivevec}[5]{\left[\begin{array}{c}#1 \\ #2 \\ #3 \\ #4 \\ #5 \\ \end{array}\right]}\) \(\newcommand{\mattwo}[4]{\left[\begin{array}{rr}#1 \amp #2 \\ #3 \amp #4 \\ \end{array}\right]}\) \(\newcommand{\laspan}[1]{\text{Span}\{#1\}}\) \(\newcommand{\bcal}{\cal B}\) \(\newcommand{\ccal}{\cal C}\) \(\newcommand{\scal}{\cal S}\) \(\newcommand{\wcal}{\cal W}\) \(\newcommand{\ecal}{\cal E}\) \(\newcommand{\coords}[2]{\left\{#1\right\}_{#2}}\) \(\newcommand{\gray}[1]{\color{gray}{#1}}\) \(\newcommand{\lgray}[1]{\color{lightgray}{#1}}\) \(\newcommand{\rank}{\operatorname{rank}}\) \(\newcommand{\row}{\text{Row}}\) \(\newcommand{\col}{\text{Col}}\) \(\renewcommand{\row}{\text{Row}}\) \(\newcommand{\nul}{\text{Nul}}\) \(\newcommand{\var}{\text{Var}}\) \(\newcommand{\corr}{\text{corr}}\) \(\newcommand{\len}[1]{\left|#1\right|}\) \(\newcommand{\bbar}{\overline{\bvec}}\) \(\newcommand{\bhat}{\widehat{\bvec}}\) \(\newcommand{\bperp}{\bvec^\perp}\) \(\newcommand{\xhat}{\widehat{\xvec}}\) \(\newcommand{\vhat}{\widehat{\vvec}}\) \(\newcommand{\uhat}{\widehat{\uvec}}\) \(\newcommand{\what}{\widehat{\wvec}}\) \(\newcommand{\Sighat}{\widehat{\Sigma}}\) \(\newcommand{\lt}{<}\) \(\newcommand{\gt}{>}\) \(\newcommand{\amp}{&}\) \(\definecolor{fillinmathshade}{gray}{0.9}\)Purpose:
This lab provides hands-on experience with the scientific method by studying animal behavior. Students will explore how pill bugs respond to environmental stimuli, practice experimental design, and apply data analysis to understand their behavior.
Tasks:
- Observe pill bug behavior in a neutral environment.
- Develop a hypothesis and design an experiment to test pill bug preference for moist vs. dry environments.
- Collect, record, and graph data from multiple trials.
- Analyze results and draw conclusions about pill bug behavior.
Criteria for Success:
- Develop a clear and logical hypothesis based on observations.
- Conduct a controlled experiment with reliable data collection methods.
- Create accurate, well-labeled graphs of your results.
- Explain the findings clearly and relate them to your hypothesis.
Lab Safety
Safety Guidelines for Handling Pill Bugs and Lab Equipment:
- Handle pill bugs gently using a soft brush or plastic spoon to prevent injury to the animals.
- Ensure behavior chambers are stable and securely assembled.
- Avoid over-moistening the environment to prevent accidental spills.
- Wash hands thoroughly after handling pill bugs or environmental materials.
- Dispose of any biological waste in designated containers.
Timeline for Pill Bug Lab
- Introduction and Setup (10 minutes)
- Overview of lab objectives and scientific method.
- Demonstration of behavior chamber setup.
- Observations and Hypothesis (15 minutes)
- Observe pill bugs in a neutral environment (5-10 minutes).
- Write observations and form hypotheses.
- Experiment Setup (10 minutes)
- Assemble behavior chambers and prepare environments.
- Data Collection (30 minutes)
- Conduct three trials (10 minutes per trial)
- Record pill bug positions every minute.
- Graphing and Analysis (15 minutes)
- Create line graphs and calculate averages.
- Analyze data and compare results to the hypothesis.
- Discussion and Wrap-Up (10 minutes)
THE SCIENTIFIC METHOD INTRODUCTION: What is science and how do we “do” science?
Science is how we gain knowledge about the natural world. Typically, it pertains only to what we can investigate or observe using our senses – or instruments that extend the ability of our senses. As a science, biology concerns itself with understanding the unity and diversity of living things – the 2,300,000, or so, described (and millions of undescribed) species with which we share the planet.
Ideally, the SCIENTIFIC METHOD is a process that describes how scientists perform investigations to provide a systematic and rational approach to answering questions about the natural world. One goal is to eliminate bias – and be as objective as possible in what we study. That being said, bias cannot ever be fully removed, but the goal is to recognize and minimize it as much as possible. Ideas that can’t be tested, directly observed, or measured in some way should not be subjected to the scientific method. There are certainly other ways to obtain knowledge (cultural, emotional, etc) they usually do not qualify as science because they do not follow the axioms of science. An axiom, in a general sense, is a truth that is accepted without proof. It might seem that science does not assume anything but many assumptions are often ignored such as the relationship between cause and effect, and that our senses and measurements accurately represent reality.
The goal of today’s lab is to familiarize you with the idealized steps of the scientific method but it's important to recognize that science rarely proceeds so linearly.
You will use these steps to determine the effects of different environmental conditions on the behavioral patterns of pill bugs (Armidillium vulgare)

This is an ideal model organism because its body is transparent, allowing its internal organs to be viewed with the help of a dissecting microscope (Fig. 2).
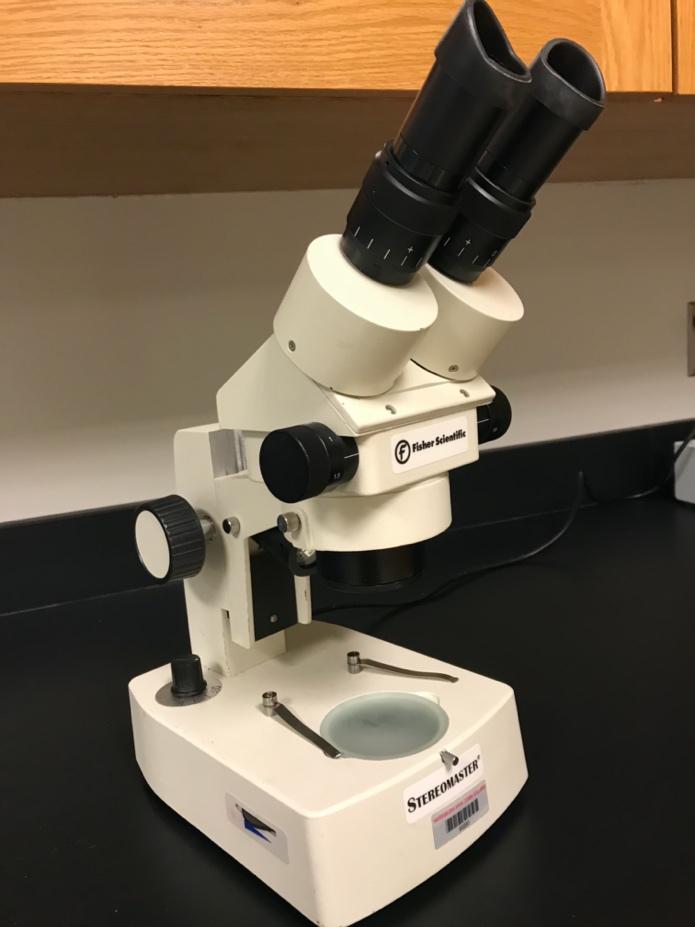
These are easily viewed with the help of a dissecting microscope or with a hand lens (Fig. 2).
Model organisms are non-human species used in research to investigate biological processes. Information learned in studies of model organisms can often be applied to other species, including humans. We use model organisms to learn about many different processes, including genetics, cellular mechanisms, and growth and development. Certain characteristics make a species an ideal model organism. For example, it must be easy to manipulate for study, inexpensive and easy to cultivate, and produce many offspring.
Some commonly used model organisms include Drosophila melanogaster (fruit fly), Caenorhabditis elegans (C. elegans, roundworm), and Escherichia coli (E. coli, bacteria). The best model organism to use for a study depends upon the question being investigated. In this study, Armadillium is a good model organism because of its simple behavioral patterns, which allows for ease of measuring taxis (movement in response to a stimulus) and gathering data on the effects of different environmental conditions.
Steps of the Scientific Method
The scientific method consists of the following steps:
- Making an observation
- Asking a question based on that observation
- Forming a logical AND testable answer to that question (stated in terms of a hypothesis)
- Designing a controlled experiment to see if the hypothesis is supported or rejected
- Collecting, analyzing, and interpreting the data generated by the experiment
If the conclusion of an experiment does not support a hypothesis, another hypothesis must be developed along with another experiment designed to test it. Many times, designing an experiment to test the hypothesis, and only the hypothesis, is one of the most difficult aspects of science. Ultimately, the results of experimentation are often published in peer-reviewed journals (along with detailed methods used to obtain them) so that other researchers can verify or replicate the experiment, and build on that work.
An idealized version of the scientific method is demonstrated in Figure 3. It is considered “idealized” because it is important to note that chance plays an important role. Often, the initial observations that result in important discoveries are stumbled upon by accident rather than sought out. Also remember that the scientific method does not always apply to observational or discovery science, which is usually more descriptive.
Purpose
The purpose of this experiment is to provide hands-on experience with the scientific method by studying animal behavior. You will investigate how environmental factors, such as moisture levels, affect pillbug habitat preference. This experiment will help you practice key scientific skills: observation, hypothesis formulation, experimental design, data collection, and data analysis. Moreover, you will develop your ability to reason scientifically about biological phenomena and connect experimental results to real-world behaviors in organisms.
You will design and carry out an experiment to study how pillbugs respond to different moisture levels in their environment.
Formulating a Question and Stating a Hypothesis
In science, observations often lead to the formulation of questions that generate hypotheses – and associated predictions that are testable. In today’s lab, we are considering the following question: “What is the effect on behavior of different conditions for pillbugs”?
A hypothesis is a testable explanation of a set of observations based on available data. It is a tentative answer to the question you are asking based on knowledge about what you're observing and asking. This knowledge can be pre-existing or information from a published resource. For these reasons, it is NOT correct to say that a hypothesis is an educated guess.
In this lab, you need to formulate several hypotheses about how you believe various test solutions will affect the behavior of pillbugs based on your prior knowledge. After you formulate the hypothesis, you will test predictions based on these hypotheses. Hypotheses can be rephrased as predictions and can be written as “If…., then….” statements.
For example: “If I put Daphnia in ice water, then their heart rates will decrease since decreasing temperatures slow down the movement of molecules.”
It’s important to note that the “If…, then…” statement is not the hypothesis, it is a prediction made about the hypothesis.
Formulate a hypothesis to describe what you predict will happen in each of your test conditions. Read through the procedure section of the lab before you define your control and variables so that you have a good understanding of how the
a. Control habitat:
b. Test condition 1:
c. Test condition 2:
- An independent variable is the condition or event under study. It is the predetermined condition the investigator sets (and can vary). Only one independent variable is tested at a time so that an observed response is attributable to just that variable.
- A dependent variable is a condition or event that occurs (the data collected) in response to the specified, predetermined, independent variables that are set.
- Controlled variables are any conditions or events that could potentially affect the outcome of an experiment. Consequently, they must be held constant (controlled) and never varied. An example of a controlled variable would be the temperature of the room during the test. This variable needs to be controlled because the movements of pillbugs can slow in lower temperatures.
In the spaces below, define the variables that will be considered in your experiment today:
a. What will be the independent variables?
b. What will be the dependent variables? Be specific with your answers.
c. Apart from temperature, what other variables should be controlled? List at least 3 controlled variables.
Importance of a Control Group:
Most well-planned experiments contain a control group in addition to an experimental group. The experimental group is the group whose experience is manipulated – usually by only one variable at a time. The control group is the group used for a comparison; it serves as a baseline against which the effects of a treatment can be evaluated. A control group should be as much like the experimental group as possible. It should be treated in every way like the experimental group except for one manipulated factor (the independent variable).
MATERIALS AND METHODS
Materials and Supplies:
Materials
| Equipment | Materials |
|---|---|
| Behavior chambers: Petri dishes, divided plastic containers, or other arenas that allow for the separation of different environmental conditions (moist and dry sides) | Pillbugs (Armadillidium vulgare): 5-10 pillbugs (per group) will be used as test subjects for observing behavior. Larger numbers of pillbugs will yield better results. |
| Divider: A physical barrier (optional) that separates the moist and dry sides of the behavior chamber to prevent mixing. | Moist substrate: Damp paper towels or moistened soil, used to create a humid environment on one side of the chamber. |
| Soft brush or plastic spoon: To safely handle and transfer pillbugs between environments. | Dry substrate: Dry paper towels or dry soil, used to create a dry environment on the other side of the chamber. |
| Stopwatch or timer: To measure the time pillbugs spend in each environment during observation periods. | |
| Data sheets: For recording observations, including the number of pillbugs on each side of the chamber at each time interval. | |
| Transfer pipette: To add moisture to the substrate as needed throughout the experiment. |
Suggested Student Roles and Group Size
For groups of 2–3 students:
- Data Recorder: Records observations, data, and completes the worksheet.
- Experiment Operator: Assembles and manages the behavior chamber setup.
- Pill Bug Handler (optional): Transfers pill bugs safely between environments.
Exercise 1- The Pillbug Experiment
Do not start the experiment at this point. This is the general outline of the experiment. The ‘Procedure’ section below provides detailed information about the experimental setup.
- Observe Pillbug Behavior:
○ Begin by placing pillbugs in a neutral environment such as a petri dish with a little soil in it. Watch their movements and reactions for 5-10 minutes, recording your observations in detail.
- Formulate a Question and Hypothesis:
○ Develop a research question, such as: "How does moisture influence pillbug habitat preference?"
○ Based on your observations and background knowledge, form a hypothesis. For example: "Pillbugs prefer moist environments over dry ones because they are prone to desiccation."
- Design Your Experiment:
○ Set up a behavior chamber with two distinct environments: one side containing a moist substrate (e.g., damp paper towel) and the other side containing a dry substrate. Place the pillbugs in the center and observe their movements.
○ Conduct at least three trials to ensure that your results are reliable.
○ Be sure to define the parameters of a trial. Define things like time, temperature, light, etc. Details matter and can drastically alter your results. It’s common for something unexpected to happen and cause you to redesign and restart your experiment.
- Collect Data:
○ For each trial, record how many pillbugs are on the moist side versus the dry side at one-minute intervals for a duration of 10-20 minutes. Organize your data in a table for clarity.
○ Record
- Analyze and Graph Your Results:
○ Use the data you collected to create a line graph. On the X-axis, indicate time (in minutes), and on the Y-axis, show the number of pillbugs present on each side of the chamber.
○ Analyze the data to determine whether pillbugs preferred the moist or dry side of the chamber over time.
- Interpret Your Results:
○ Compare your experimental results to your hypothesis. Did the pillbugs display a clear preference for the moist environment? Reflect on why the pillbugs behaved as they did and discuss any limitations of the experiment that could have influenced the results.
Your work will be assessed on the following points:
- Clarity of Observations and Hypothesis: Observations should be recorded with sufficient detail, and your hypothesis should be clear, logical, and based on your initial observations.
- Experimental Design: The experiment should effectively test moisture's impact on pillbug behavior, with appropriate control of variables and a consistent setup for each trial.
- Data Collection: Data should be accurately recorded in a well-organized table, reflecting the number of pillbugs on each side at each time point.
- Graphing and Analysis: Your graph should clearly present the results, with properly labeled axes and a descriptive title. Your analysis should explain the patterns seen in the graph and relate them to your hypothesis.
- Conclusion: Your conclusion should state whether the data supported or contradicted the hypothesis. You should also provide an explanation for the pillbugs' behavior and discuss any potential experimental limitations or errors.
PROCEDURE
Part 1: Building the Pillbug Enclosure with Attached Petri Dishes
- Assemble the Petri Dish Enclosure:
○ Take two large Petri dishes. These dishes will represent two different environments, which you will design based on the variables you wish to test (e.g., light vs. dark, rough vs. smooth, food vs. no food).
○ Prepare each dish by setting up your chosen environment in each based on your hypothesis. For example, one Petri dish might be lined with damp paper towels while the other is kept dry, or one dish might be illuminated while the other is covered to create darkness.
- Create a Pathway by Modifying the Petri Dishes:
○ Cut a small slot (approximately 1-2 cm wide and tall) into the sides of each Petri dish, ensuring that the slots are aligned when the dishes are placed side by side.
○ Carefully position the two Petri dishes so that the slots are facing each other, creating a continuous opening between the two dishes.
○ Use clear tape to attach the dishes together securely along the sides where the slots are cut, ensuring the pathway between the two dishes is stable and pillbugs can move freely between them.
○ This connection will allow the pillbugs to travel directly from one dish to the other without needing additional tubes or materials.
- Prepare the Pillbug Chamber:
○ Place the connected Petri dishes in a stable area on the lab bench. Make sure the environments in each dish are properly set up before introducing the pillbugs.
Part 2: Initial Observations and Drawing
- Observation Period:
○ Place 5 pillbugs in a neutral environment (such as an empty Petri dish) and observe their behavior for 5-10 minutes. Record observations about their movements, responses to stimuli, and any distinctive behaviors in your lab notebook.
- Pillbug Drawing:
○ Choose one pillbug to observe closely using magnification. Make a detailed drawing, focusing on its anatomy. Label important features such as the head, antennae, thoracic segments, and pleon (tail region). Include the drawing in your lab notebook.
Part 3: Conducting the Experiment
- Introduce Pillbugs to the Attached Dishes:
○ Using a soft brush or plastic spoon, gently place 5 pillbugs into the center of the connected Petri dishes, allowing them to explore both environments freely.
○ Ensure that the pillbugs can easily move between the two dishes through the slots you cut.
- Observation and Data Collection:
○ Start the timer and observe the pillbugs for 10-20 minutes. Every minute, record how many pillbugs are present in each environment.
○ Use a data table similar to the one below to track your observations:
|
Time (Minutes) |
# of Pillbugs in Environment A |
# of Pillbugs in Environment B |
Notes on Behavior |
|---|---|---|---|
|
1 |
|||
|
2 |
|||
|
3 |
|||
- Repeat the Experiment:
○ After completing the first trial, return the pillbugs to their holding container. Ensure both environments remain consistent for the next trials.
○ Repeat the experiment for at least two additional trials to ensure reliable data.
Part 4: Analyzing and Graphing the Results
- Average the Data:
○ After completing all trials, calculate the average number of pillbugs in each environment at each time point.
○ Summarize the results in a table, showing the averages for both environments across time intervals.
- Create a Graph:
○ Create a line graph to visualize the data. Plot time (minutes) on the X-axis and the average number of pillbugs on the Y-axis.
○ Use separate lines to represent the number of pillbugs in each environment.
- Interpret Your Results:
○ Analyze the data to determine if the pillbugs showed a preference for one environment over the other. Relate this behavior to your hypothesis.
○ Discuss any experimental limitations and propose potential improvements for future experiments.
Tables, charts, and graphs are usually the most effective tools to provide a concise summary of the type of numerical data you collected today.
A graph is a diagram showing the relationship between independent and dependent variables.
When making graphs, the following rules should be observed:
- The independent variable is usually plotted on the X-axis (horizontal axis) and the dependent variable is plotted on the Y-axis (vertical axis).
- Each axis should be labeled properly with the name of the variable and the units of measurement.
- Data intervals must be evenly spaced across the axes, usually beginning with zero and increasing in consistent even increments.
- All graphs should have a title or caption to describe the information presented. Capitalize the first word in the title and place a period at the end.
- Choose a graph that best represents the type of data you collected:
-
- Line graphs show changes in the quantity of the chosen variable and emphasize the rise and fall of the values over their range.
- Bar graphs are used for data that represent separate or discontinuous groups or non-numerical categories, thus emphasizing the discrete differences between the groups.
Graph Your Results:
Discuss with your group how to design the graph so it best represents your data and ultimately the conclusions you draw.
Rubric for Graphing Extension Activity
|
Criteria |
Excellent (5) |
Proficient (4) |
Needs Improvement (2–3) |
Not Complete (0) |
|---|---|---|---|---|
|
Accurate Data Representation |
All data points correct and well-labeled |
Minor errors in data or labels |
Multiple errors in data or labels |
No data presented |
|
Graph Design |
Neat, clear axes, proper scaling |
Mostly clear with minor issues |
Axes or scaling unclear |
No graph provided |
|
Analysis of Relationship |
Insightful explanation of behavior patterns |
Adequate explanation with minor gaps |
Incomplete explanation |
No explanation |
Graph Your Results:
Discuss with your group how to design the graph so it best represents your data and ultimately the conclusions you draw.
Use the grid below to graph your group’s results:
Title:
Interpret Your Results:
Once you have collected your data and summarized it as a graph, the last step is to analyze and interpret your results. Ultimately, you have reached the stage in the scientific method process where you need to determine whether the hypothesis you initially generated has been supported or refuted (not supported).
Questions for Review
1) What is the difference between a control group and a controlled variable?
2) What are some types of questions science can’t answer?
3) Where would you find an independent variable on a line graph?
4) What are ‘levels of treatment’?
5) Much like citing your sources, making a graph usually follows format guidelines. What is the correct way to format a graph in APA style?
Practical Challenge
1) Give an example of a well written hypothesis and a prediction based on this hypothesis.
2) What kind of data would be appropriate to use for a bar graph?
3) Did the results of your experiments support or refute your hypothesis?