
7: Respiration and Fermentation
- Page ID
- 163245

\( \newcommand{\vecs}[1]{\overset { \scriptstyle \rightharpoonup} {\mathbf{#1}} } \)
\( \newcommand{\vecd}[1]{\overset{-\!-\!\rightharpoonup}{\vphantom{a}\smash {#1}}} \)
\( \newcommand{\dsum}{\displaystyle\sum\limits} \)
\( \newcommand{\dint}{\displaystyle\int\limits} \)
\( \newcommand{\dlim}{\displaystyle\lim\limits} \)
\( \newcommand{\id}{\mathrm{id}}\) \( \newcommand{\Span}{\mathrm{span}}\)
( \newcommand{\kernel}{\mathrm{null}\,}\) \( \newcommand{\range}{\mathrm{range}\,}\)
\( \newcommand{\RealPart}{\mathrm{Re}}\) \( \newcommand{\ImaginaryPart}{\mathrm{Im}}\)
\( \newcommand{\Argument}{\mathrm{Arg}}\) \( \newcommand{\norm}[1]{\| #1 \|}\)
\( \newcommand{\inner}[2]{\langle #1, #2 \rangle}\)
\( \newcommand{\Span}{\mathrm{span}}\)
\( \newcommand{\id}{\mathrm{id}}\)
\( \newcommand{\Span}{\mathrm{span}}\)
\( \newcommand{\kernel}{\mathrm{null}\,}\)
\( \newcommand{\range}{\mathrm{range}\,}\)
\( \newcommand{\RealPart}{\mathrm{Re}}\)
\( \newcommand{\ImaginaryPart}{\mathrm{Im}}\)
\( \newcommand{\Argument}{\mathrm{Arg}}\)
\( \newcommand{\norm}[1]{\| #1 \|}\)
\( \newcommand{\inner}[2]{\langle #1, #2 \rangle}\)
\( \newcommand{\Span}{\mathrm{span}}\) \( \newcommand{\AA}{\unicode[.8,0]{x212B}}\)
\( \newcommand{\vectorA}[1]{\vec{#1}} % arrow\)
\( \newcommand{\vectorAt}[1]{\vec{\text{#1}}} % arrow\)
\( \newcommand{\vectorB}[1]{\overset { \scriptstyle \rightharpoonup} {\mathbf{#1}} } \)
\( \newcommand{\vectorC}[1]{\textbf{#1}} \)
\( \newcommand{\vectorD}[1]{\overrightarrow{#1}} \)
\( \newcommand{\vectorDt}[1]{\overrightarrow{\text{#1}}} \)
\( \newcommand{\vectE}[1]{\overset{-\!-\!\rightharpoonup}{\vphantom{a}\smash{\mathbf {#1}}}} \)
\( \newcommand{\vecs}[1]{\overset { \scriptstyle \rightharpoonup} {\mathbf{#1}} } \)
\(\newcommand{\longvect}{\overrightarrow}\)
\( \newcommand{\vecd}[1]{\overset{-\!-\!\rightharpoonup}{\vphantom{a}\smash {#1}}} \)
\(\newcommand{\avec}{\mathbf a}\) \(\newcommand{\bvec}{\mathbf b}\) \(\newcommand{\cvec}{\mathbf c}\) \(\newcommand{\dvec}{\mathbf d}\) \(\newcommand{\dtil}{\widetilde{\mathbf d}}\) \(\newcommand{\evec}{\mathbf e}\) \(\newcommand{\fvec}{\mathbf f}\) \(\newcommand{\nvec}{\mathbf n}\) \(\newcommand{\pvec}{\mathbf p}\) \(\newcommand{\qvec}{\mathbf q}\) \(\newcommand{\svec}{\mathbf s}\) \(\newcommand{\tvec}{\mathbf t}\) \(\newcommand{\uvec}{\mathbf u}\) \(\newcommand{\vvec}{\mathbf v}\) \(\newcommand{\wvec}{\mathbf w}\) \(\newcommand{\xvec}{\mathbf x}\) \(\newcommand{\yvec}{\mathbf y}\) \(\newcommand{\zvec}{\mathbf z}\) \(\newcommand{\rvec}{\mathbf r}\) \(\newcommand{\mvec}{\mathbf m}\) \(\newcommand{\zerovec}{\mathbf 0}\) \(\newcommand{\onevec}{\mathbf 1}\) \(\newcommand{\real}{\mathbb R}\) \(\newcommand{\twovec}[2]{\left[\begin{array}{r}#1 \\ #2 \end{array}\right]}\) \(\newcommand{\ctwovec}[2]{\left[\begin{array}{c}#1 \\ #2 \end{array}\right]}\) \(\newcommand{\threevec}[3]{\left[\begin{array}{r}#1 \\ #2 \\ #3 \end{array}\right]}\) \(\newcommand{\cthreevec}[3]{\left[\begin{array}{c}#1 \\ #2 \\ #3 \end{array}\right]}\) \(\newcommand{\fourvec}[4]{\left[\begin{array}{r}#1 \\ #2 \\ #3 \\ #4 \end{array}\right]}\) \(\newcommand{\cfourvec}[4]{\left[\begin{array}{c}#1 \\ #2 \\ #3 \\ #4 \end{array}\right]}\) \(\newcommand{\fivevec}[5]{\left[\begin{array}{r}#1 \\ #2 \\ #3 \\ #4 \\ #5 \\ \end{array}\right]}\) \(\newcommand{\cfivevec}[5]{\left[\begin{array}{c}#1 \\ #2 \\ #3 \\ #4 \\ #5 \\ \end{array}\right]}\) \(\newcommand{\mattwo}[4]{\left[\begin{array}{rr}#1 \amp #2 \\ #3 \amp #4 \\ \end{array}\right]}\) \(\newcommand{\laspan}[1]{\text{Span}\{#1\}}\) \(\newcommand{\bcal}{\cal B}\) \(\newcommand{\ccal}{\cal C}\) \(\newcommand{\scal}{\cal S}\) \(\newcommand{\wcal}{\cal W}\) \(\newcommand{\ecal}{\cal E}\) \(\newcommand{\coords}[2]{\left\{#1\right\}_{#2}}\) \(\newcommand{\gray}[1]{\color{gray}{#1}}\) \(\newcommand{\lgray}[1]{\color{lightgray}{#1}}\) \(\newcommand{\rank}{\operatorname{rank}}\) \(\newcommand{\row}{\text{Row}}\) \(\newcommand{\col}{\text{Col}}\) \(\renewcommand{\row}{\text{Row}}\) \(\newcommand{\nul}{\text{Nul}}\) \(\newcommand{\var}{\text{Var}}\) \(\newcommand{\corr}{\text{corr}}\) \(\newcommand{\len}[1]{\left|#1\right|}\) \(\newcommand{\bbar}{\overline{\bvec}}\) \(\newcommand{\bhat}{\widehat{\bvec}}\) \(\newcommand{\bperp}{\bvec^\perp}\) \(\newcommand{\xhat}{\widehat{\xvec}}\) \(\newcommand{\vhat}{\widehat{\vvec}}\) \(\newcommand{\uhat}{\widehat{\uvec}}\) \(\newcommand{\what}{\widehat{\wvec}}\) \(\newcommand{\Sighat}{\widehat{\Sigma}}\) \(\newcommand{\lt}{<}\) \(\newcommand{\gt}{>}\) \(\newcommand{\amp}{&}\) \(\definecolor{fillinmathshade}{gray}{0.9}\)Purpose:
This lab explores cellular respiration and fermentation, highlighting their key differences and the conditions that affect their efficiency. Students will investigate the production of carbon dioxide as an indicator of these processes in plants and yeast.
Tasks:
- Measure carbon dioxide production in germinating peas during cellular respiration.
- Observe aerobic respiration in yeast using methylene blue.
- Measure carbon dioxide production during alcoholic fermentation with varying yeast concentrations.
Criteria for Success:
- Accurately collect and record data for each experiment.
- Analyze and interpret the relationship between conditions and metabolic rates.
- Present findings in well-labeled tables and optional graphs.
Timeline for Respiration and Fermentation Lab
- Introduction and Setup (15 minutes): Overview of cellular respiration and fermentation.
- Cellular Respiration in Plants (20-minute setup): Set up and measure CO2 production in germinating peas. Final measurement at the end of the lab.
- Aerobic Respiration in Yeast (20 minutes): Prepare and observe yeast with methylene blue.
- Alcoholic Fermentation in Yeast (30 minutes): Measure CO2 production with saccharometers.
- Data Compilation and Discussion (15 minutes): Analyze results and discuss findings.
Introduction
Living things need to convert food into usable energy. They do this by breaking down complex molecules like glucose to produce ATP (adenosine triphosphate), which powers cellular functions. There are two main ways organisms do this: cellular respiration and fermentation.
Cellular respiration usually requires oxygen (aerobic) and produces the most ATP from each glucose molecule. While some microorganisms can perform cellular respiration without oxygen (anaerobic), this produces much less energy. We'll focus on the more common aerobic process.
Both cellular respiration and fermentation involve chemical reactions called redox reactions. In these reactions, electrons move between molecules using special carriers like NAD+. When a molecule loses electrons, it becomes "oxidized" (think "OIL" - Oxidation Is Loss). When a molecule gains electrons, it becomes "reduced" (think "RIG" - Reduction Is Gain). For example, when NAD+ gains electrons, it becomes NADH.
\[\ce{NAD^{+} + 2e^{-} + H^{+} ->[\text{Redox Reaction}] NADH}\]
Aerobic cellular respiration happens in three main steps:
- Glycolysis (in the cell's cytoplasm)
- Citric acid cycle (or Krebs cycle)
- Electron transport chain (both in the mitochondria)
This process completely breaks down glucose using oxygen, producing up to 32 ATP molecules. At the end, the high-energy electrons from glucose reduce oxygen to form water. Since oxygen strongly attracts electrons, this final state represents a much lower energy level than the original glucose molecule.
Fermentation, in contrast, occurs without oxygen and is much less efficient. It starts with glycolysis to produce pyruvic acid and 2 ATP molecules. Then enzymes convert pyruvic acid into end products, giving us either alcoholic or lactic acid fermentation. While fermentation produces some ATP, it doesn't completely break down glucose - the end products still contain high-energy electrons. As a result, fermentation only yields 2 ATP molecules per glucose, compared to the 32 from cellular respiration.
.svg?revision=1&size=bestfit&width=587&height=441)
PART 1: CELLULAR RESPIRATION
Exercise 1 : Investigating Cellular Respiration in Plants
This part of the lab investigates cellular respiration in pea seeds. Seeds of plants are stuffed full of sugars like starch. Cellular respiration involves breaking down sugars to generate ATP and this process allows plants to harvest energy necessary to produce roots, shoots, and leaves.
The process of cellular respiration also results in the release of carbon dioxide gas. Carbon dioxide will react with water to form carbonic acid. The formation of carbonic acid will affect the pH of an aqueous solution. Since carbon dioxide is colorless, odorless, and very hard to detect, we will use a pH indicator to detect the presence of carbonic acid and thus carbon dioxide. pH indicators, like red cabbage juice, bromothymol blue, and phenol red are chemicals that change color when pH is altered.
In this experiment, we will observe cellular respiration in germinating pea seeds by detecting carbon dioxide production and monitoring the changes in the pH of the solution. It is important to understand that even though pea seeds are plants, they are not photosynthetic at this stage of their life cycle.
Lab Safety
- Wear safety goggles and gloves during all procedures.
- Handle bromothymol blue and methylene blue solutions with care; avoid skin or eye contact.
- Clean up spills immediately and dispose of biological and chemical waste properly.
- Wash hands thoroughly after completing the lab.
Suggested Student Roles and Group Size
For groups of 2–3 students:
- Experiment Operator: Conducts tests and ensures accurate timing.
- Data Recorder: Records all measurements and ensures worksheet completion.
- Materials Manager (optional): Prepares solutions and cleans up materials.
| Equipment | Materials |
| 16 clear microcentrifuge tubes (1.5 mL or 2 mL) | ~10 soaked peas (prepared as described below) |
| 5 red plastic or plastic beads | 5 dry peas |
| Nonabsorbent cotton or foam plugs (optional) | Very dilute Bromothymol blue solution (BTB) (enough for 0.5 mL per tube) |
| Gloves | |
| Permanent marker for labeling | |
| Pipette or dropper | |
| Sealable container or Ziploc bag for soaking peas | |
| Paper towel | |
| Plastic tray or rack for holding microcentrifuge tubes | |
| Timer or stopwatch |
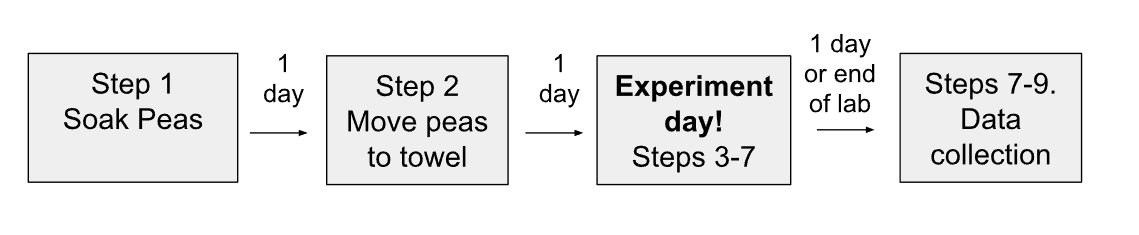
Overall Timeline:
Employing Steps in the Scientific Method:
- Record the Question that is being investigated in this experiment. ________________________________________________________________
- Record a Hypothesis for the question stated above. ________________________________________________________________
- Predict the results of the experiment based on your hypothesis (if/then). ________________________________________________________________
- Perform the experiment below and collect your data.
Procedure:
- Seed Preparation
- Two days before the experiment: Place 15 peas into a sealable container and cover with several inches of nonchlorinated water. Soak overnight.
- One day before the experiment: Drain the water from the soaked peas, place them on a damp paper towel, and store them in a plastic bag in the dark overnight.
- Keep the remaining 5 peas dry (no soaking required).
- Experiment Setup
- Label 20 microcentrifuge tubes using a permanent marker:
- Tubes #1–6: Soaked peas
- Tubes #7–11: Dry peas
- Tubes #12–16: red plastic beads
- Indicator Solution
- Put on gloves. Using a pipette or dropper, add 0.5 mL of bromothymol blue solution (BTB) to each microcentrifuge tube.
- Seal Tubes with Cotton
- You can skip this step if your peas do not fall to the bottom of the tube and make contact with the pH indicator.
- Place a small plug of nonabsorbent cotton or foam lightly packed into each tube. Ensure the cotton allows airflow between the pea or bead and the BTB solution. The goal is to have a place for the pea to rest without coming into contact with the BTB.


- Add Materials
- For Tubes #1–6: Add one soaked pea to each tube.
- For Tubes #7–11: Add one dry pea to each tube.
- For Tubes #12–16: Add one red plastic bead to each tube.
- Record Initial Observations
- Observe and record the initial color of the bromothymol blue solution in all 20 tubes. Note any variation.
- Important note: only make observations about the liquid in the bottom of the tube, not the cotton.
- Incubation
- Place all the tubes in a rack or tray. Store them in a safe location, where they will not get bumped, at room temperature.
- After 1 hour, observe and record the color of the BTB solution in each tube.
- After 2 hours, observe and record the color of the BTB solution again.
- Clean Up
- At the end of the experiment, pour the used BTB solution into the designated waste container as instructed.
- Rinse and wash all microcentrifuge tubes thoroughly or dispose of them in the appropriate container.
Data Table 1.
Use the table below to record your observations.
|
Tube # |
Material |
Initial BTB Color |
Observation after 1 Hour |
Observation After 2 Hours |
|---|---|---|---|---|
|
1 |
Soaked Pea |
|||
|
2 |
Soaked Pea |
|||
|
3 |
Soaked Pea |
|||
|
4 |
Soaked Pea |
|||
|
5 |
Soaked Pea |
|||
|
6 |
Soaked Pea |
|||
|
7 |
Dry Pea |
|||
|
8 |
Dry Pea |
|||
|
9 |
Dry Pea |
|||
|
10 |
Dry Pea |
|||
|
11 |
Dry Pea |
|||
|
12 |
red plastic Bead |
|||
|
13 |
red plastic Bead |
|||
|
14 |
red plastic Bead |
|||
|
15 |
red plastic Bead |
|||
|
16 |
red plastic Bead |
Questions for Review
- What is the color of the indicator at at
- Neutral pH?
- Basic pH?
- Acidic pH?
- What was the purpose of Tubes 12-16?
- What specifically was produced as a result of cellular respiration that changed the color of the indicator?
- How is carbon dioxide an indicator that cellular respiration is taking place in these peas?
- Germination is the process by which a dormant seed begins to sprout and grow into a seedling. What are some possible metabolic processes that are required for seed germination?
- During respiration, a seed metabolizes sugars. What is the source of the sugar metabolized by the seed?
- What variables do you think may affect the respiration rate of the seeds?
- The equation for cellular respiration is:
\[\ce{C6H12O6 + 6O2 → 6CO2 + 6H2O + 32 ATP}\]
The energy released from the complete oxidation of glucose under standard conditions is 686 kcal/mol. The energy released from the hydrolysis of ATP to ADP and inorganic phosphate under standard conditions is 7.3 kcal/mol. Using the equation for cellular respiration above, calculate the efficiency of respiration (i.e. the percentage of chemical energy in glucose that is transferred to ATP). *For help with answering this question, refer to Concept 9.4 (Campbell Textbook).
PART 2: AEROBIC RESPIRATION IN YEAST
Optional Activity or Demonstration
This part of the lab investigates aerobic cellular respiration by Saccharomyces cerevisiae, also referred to as “baker’s yeast” and “brewer’s yeast.” Yeast is a unicellular fungus that can convert glucose into carbon dioxide and ATP when oxygen is present. Methylene blue dye can be used as an indicator for aerobic respiration in yeast. Aerobic respiration releases hydrogen ions and electrons that are picked up by the methylene blue dye, gradually turning the dye colorless. This redox reaction can be observed when viewing a wet mount of yeast and methylene blue under the compound light microscope. The mitochondria of yeast cells undergoing aerobic respiration will appear as a clear area surrounded by a ring of light blue cytoplasm. If cellular respiration is not taking place, the mitochondria will absorb the blue dye and will not turn colorless.
Materials:
| Equipment | Materials |
| Transfer pipette | Yeast (not quick rise) |
| Compound light microscope | Distilled water |
| Microscope slide and cover slip | Methylene blue dye (in dropper bottle) |
- Distilled water
- Transfer pipette
- Methylene blue dye (in dropper bottle)
- Compound light microscope
- Microscope slide and cover slip
Procedure:
- Prepare yeast suspension: Add 7 grams yeast to 50 ml warm tap water. Stir to mix and keep in 37℃ incubator. (Your instructor may have already prepared this before lab)
- The instructor or one group should add 10mL of the warm yeast suspension to a small beaker or test tube. Add 1-2 drops of methylene blue dye to this sample. Return the remaining yeast suspension to the incubator.
- Place a drop of the dyed yeast suspension on a clean microscope slide with a transfer pipette and place a cover slip on the microscope slide over the yeast suspension.
- Observe the yeast using the scanning objective lens. Use the coarse adjustment knob to focus on the yeast cells. Switch to the low-power objective lens and then to the high-power objective lens.
- In the circle below, draw or insert a picture of several yeast cells undergoing aerobic respiration and several yeast cells not undergoing aerobic respiration. Label the cytoplasm and nucleus if visible.

PART 3: ALCOHOLIC FERMENTATION IN YEAST
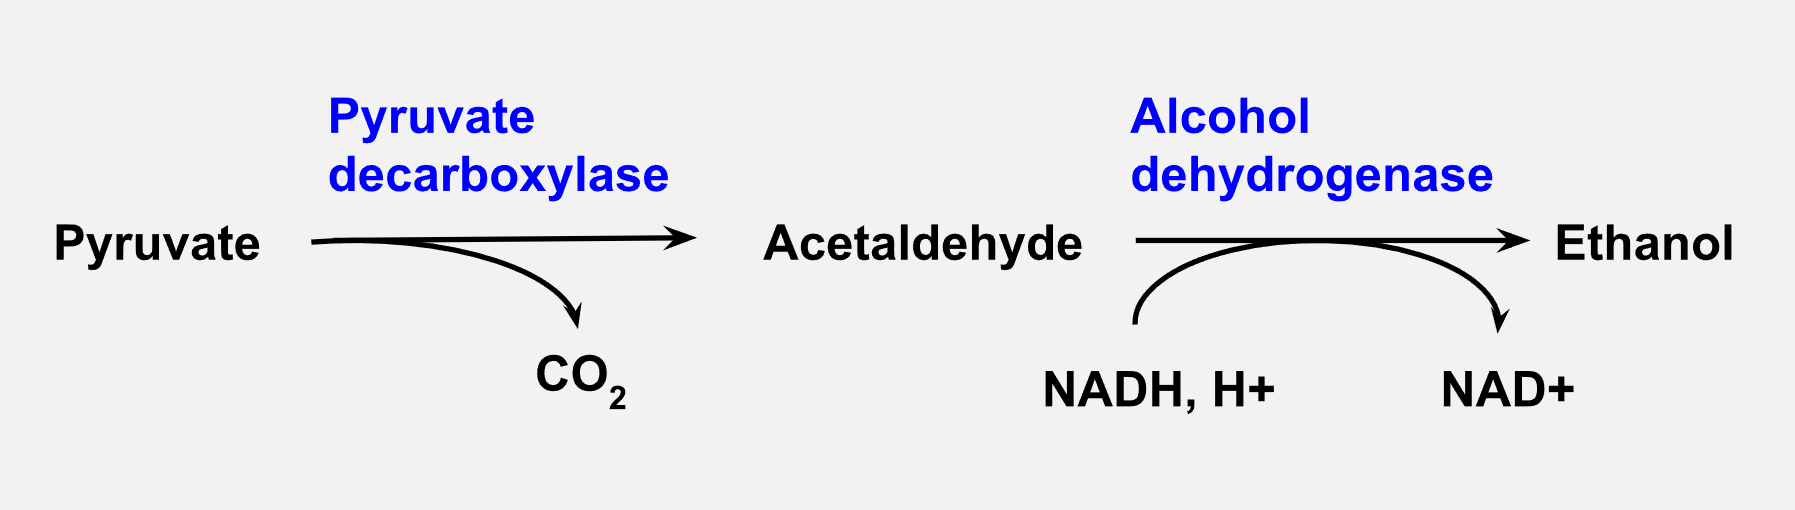
This part of the lab investigates alcoholic fermentation by Saccharomyces cerevisiae, also referred to as “baker’s yeast” and “brewer’s yeast.” Yeast converts pyruvate from glycolysis into acetaldehyde, releasing carbon dioxide gas. Acetaldehyde is then enzymatically converted by the enzyme alcohol dehydrogenase into ethanol (Figure 2). In this lab, we will measure the accumulation of carbon dioxide released in the first enzymatic reaction as an indicator of the progression of fermentation.
Exercise 1: Investigating Different Concentrations of Yeast
For this section, two groups of 3 students should join
Roles for 6 Students:
- Experiment Operators (2 students):
- Prepare test tubes and saccharometers, add solutions, and ensure no errors during setup.
- Timekeeper/Data Recorder (2 students):
- Manage the timer and record CO2 column heights at each time point.
- Materials Managers (2 students):
- Gather materials, assist with setup, and clean up after the experiment.
Materials:
| Equipment | Materials |
| 4 test tubes in test tube rack | 10% Glucose solution |
| 4 saccharometers | 4 saccharometers |
| Transfer pipettes | distilled water |
| Small graduated cylinder | Yeast (leftover from the previous step) |
| Timer | |
| Lab tray | |
| Masking tape or lab tape | |
| Metric ruler | |
| Spatula | |
| Sharpie | |
| Incubation Chamber (optional) |
|
Saccharometer |
DI Water |
Glucose Solution |
Yeast Suspension |
|---|---|---|---|
|
1 |
16 ml |
12 ml |
0 ml |
|
2 |
24 ml |
0 ml |
4 ml |
|
3 |
12 ml |
12 ml |
4 ml |
|
4 |
4 ml |
12 ml |
12 ml |
Employing Steps in the Scientific Method:
- Record the Question that is being investigated in this experiment. ________________________________________________________________
- Record a Hypothesis for the question stated above. ________________________________________________________________
- Predict the results of the experiment based on your hypothesis (if/then). ________________________________________________________________
Procedure:
- SETUP AND LABELING Label both your test tubes and saccharometers 1-4 with tape (don’t write directly on the saccharometer glass). This careful labeling is crucial because you'll be tracking different experimental conditions in each tube.
- PREPARE GLUCOSE SolutionS Using your transfer pipette, add the specified amounts of glucose and distilled water from Table 2 to each test tube. Be precise with these measurements, as they create the different concentrations we'll be testing.
- ADD YEAST Solution This step requires quick, careful work. Add the yeast solution amounts listed in Table 1 to each test tube. Work efficiently because fermentation begins immediately when yeast contacts glucose. Each tube will have a different concentration to test how this affects the fermentation rate.
- NOTE: all solutions should be combined and mixed in test tubes before being added to the saccharometers.
- TRANSFER TO SACCHAROMETERS Pour each mixture into its matching labeled saccharometer. The saccharometer's design will allow us to measure the CO2 produced by fermentation. Keep them on your tray as a safety measure - fermentation can sometimes be vigorous enough to cause overflow.
- If available, the saccharomers can be placed in a warm incubation chamber for the duration of the experiment. This can greatly increase the rate of fermentation for the short 20-minute experimental period.
- REMOVE AIR BUBBLES Gently tilt each saccharometer to release any trapped air bubbles in the vertical arms. This step is essential for accurate measurements - trapped bubbles could make our readings inaccurate.
- MEASURE AND RECORD Start your timer and record the initial height of the air column in millimeters. This is your "time zero" measurement and it should be as close to 0mm as possible. Continue measuring every 2 minutes for 20 minutes total. You'll see the air column grow as fermentation produces more CO2.
- CLEANUP PROCEDURES After completing all measurements, carefully transport the saccharometers one at a time to the sink. Empty the contents, wash them thoroughly, and return them to the plastic tray, storing them on their sides to prevent damage.
The data you collect will show how quickly yeast ferments glucose under different conditions. The height of the CO2 column directly relates to the fermentation rate - a taller column means more fermentation activity. This helps us understand how substrate concentration affects the rate of this important biological process.
Remember to keep your data table neat and organized - you'll use these measurements to graph the relationship between time and CO2 production for each concentration.
|
Time (min.) |
Sacch. 1 |
Sacch. 2 |
Sacch. 3 |
Sacch. 4 |
|---|---|---|---|---|
|
0 (initial) |
||||
|
2 |
||||
|
4 |
||||
|
6 |
||||
|
8 |
||||
|
10 |
||||
|
12 |
||||
|
14 |
||||
|
16 |
||||
|
18 |
||||
|
20 |
Extension Activity: (Optional)
The results of this experiment can be presented graphically. The presentation of your data in a graph will assist you in interpreting your results. Based on your results, you can complete the final step of scientific investigation, in which you must be able to propose a logical argument that either allows you to support or reject your initial hypothesis.
- Graph your results using the data from Table 3.
- What is the dependent variable? Which axis is used to graph this data? ___________________________________________________________________
- What is your independent variable? Which axis is used to graph this data? ___________________________________________________________________
Questions for Review
- Fermentation and cellular respiration involve redox reactions. Explain what happens to electrons during a redox reaction and how this changes a molecule’s potential energy
- Why did we add the Saccharomyces cerevisiae (baker's yeast) to the fermentation tubes? Specifically, what did the yeast provide to the fermentation mixture?
- We measured the formation of what end product to determine the rate of cellular respiration?
Practical Challenge Questions:
- What other variables could be investigated that might affect the rate of alcoholic fermentation by yeast?
Alignment with SLOs and Program Competencies
|
Lab Task |
Competency Alignment |
|---|---|
|
Measuring respiration and fermentation rates |
Develops technical lab skills |
|
Analyzing metabolic processes |
Applies critical thinking and quantitative reasoning |
|
Differentiating metabolic pathways |
Connects biological principles to experimental data |