
19.1: Introduction to and Components of Food Webs
- Page ID
- 92895
Introduction
All living things require energy in one form or another. Energy is required by most complex metabolic pathways (often in the form of adenosine triphosphate, ATP), especially those responsible for building large molecules from smaller compounds, and life itself is an energy-driven process. Living organisms would not be able to assemble macromolecules (proteins, lipids, nucleic acids, and complex carbohydrates) from their monomeric subunits without a constant energy input.
Food webs illustrate how energy flows directionally through ecosystems, including how efficiently organisms acquire it, use it, and how much remains for use by other organisms of the food web.
Food Chains and Food Webs
In ecology, a food chain is a linear sequence of organisms through which nutrients and energy pass: primary producers, primary consumers, and higher-level consumers are used to describe ecosystem structure and dynamics. There is a single path through the chain.
Food chains do not accurately describe most ecosystems. Even when all organisms are grouped into appropriate trophic levels, some of these organisms can feed on species from more than one trophic level; likewise, some of these organisms can be eaten by species from multiple trophic levels. In other words, the linear model of ecosystems, the food chain, is not completely descriptive of ecosystem structure. A holistic model—which accounts for all the interactions between different species and their complex interconnected relationships with each other and with the environment—is a more accurate and descriptive model for ecosystems. A food web is a graphic representation of a holistic, nonlinear web of primary producers, primary consumers, and higher-level consumers used to describe ecosystem structure and dynamics (Figure 1).
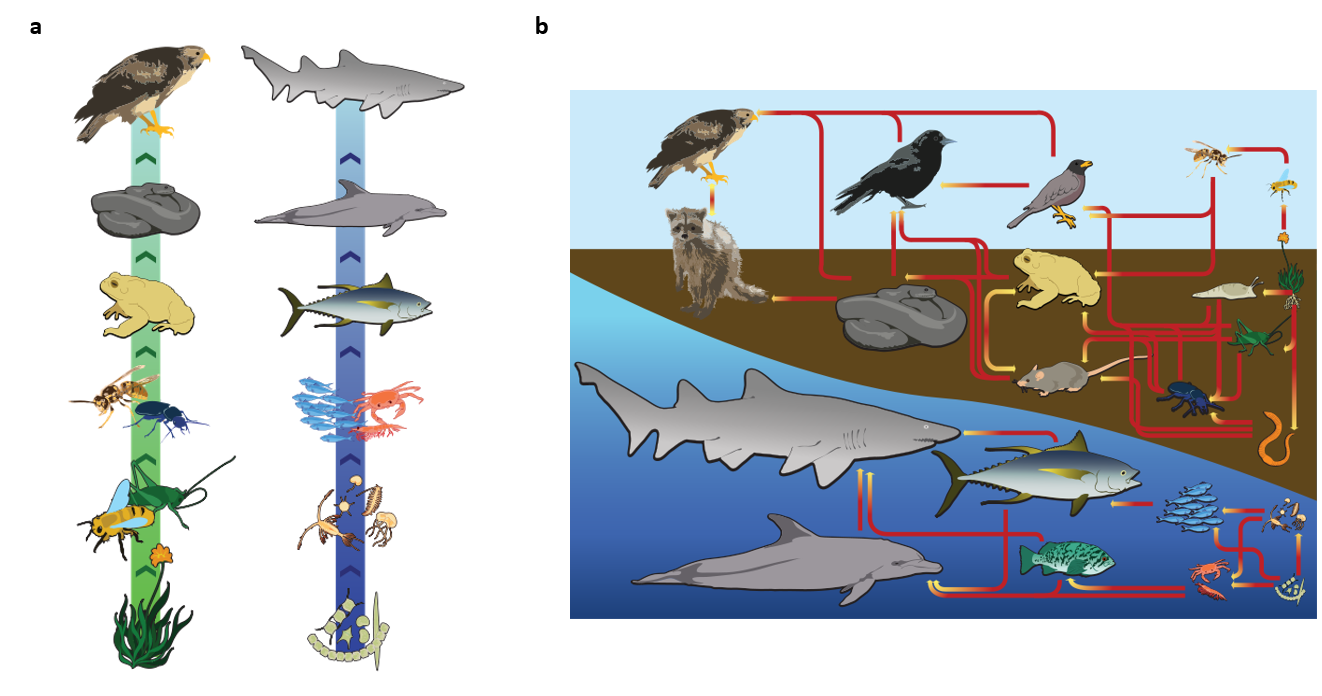
Figure 1. Example of simplified food chains (a) and food webs (b) of terrestrial and marine ecosystems. Developed by LadyofHats and licensed under CC0.
Though more complex than a food chain, a food web remains a simplified illustration of the direct and indirect trophic interactions among species in an ecosystem. Food webs often aggregate many species into trophic groups, which are functional groups of species that have the same predators and prey in a food web. Software can be used to model more complex interactions (Figure 2), but no food web model can capture all of the complexity found within a natural ecosystem.
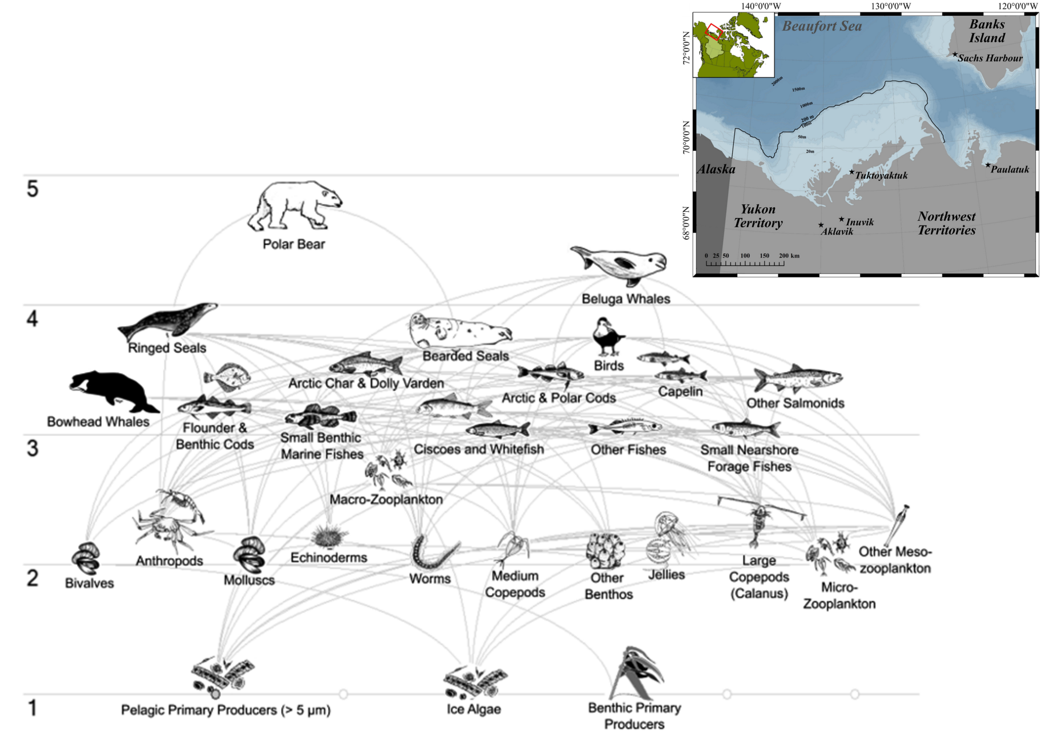
Figure 2: An example of a more complex food web developed by Hoover et al. 2021 using a program called Ecopath. This food web depicts trophic relationships among species in the Canadian Beaufort Sea. Horizontal lines represent trophic level. Image licensed under CC-BY 4.0.
Components of a Food Web
The three basic ways in which organisms get food are as producers, consumers, and decomposers.
-
Producers (autotrophs) are typically plants or algae. Plants and algae do not usually eat other organisms, but pull nutrients from the soil or the ocean and manufacture their own food using photosynthesis. For this reason, they are called primary producers. In this way, it is energy from the sun that usually powers the base of the food chain (Cengage Learning 2002). An exception occurs in deep-sea hydrothermal ecosystems, where there is no sunlight. Here primary producers manufacture food through a process called chemosynthesis (van Dover 2000).
-
Consumers (heterotrophs) are species that cannot manufacture their own food and need to consume other organisms. Animals that eat primary producers (like plants) are called herbivores. Animals that eat other animals are called carnivores, and animals that eat both plants and other animals are called omnivores.
-
Decomposers (detritivores) break down dead plant and animal material and wastes and release it again as energy and nutrients into the ecosystem for recycling. Decomposers, such as bacteria and fungi (mushrooms), feed on waste and dead matter, converting it into inorganic chemicals that can be recycled as mineral nutrients for plants to use again.
Autotrophs
Energy is acquired by living things in three ways: photosynthesis, chemosynthesis, and the consumption and digestion of other living or previously living organisms by heterotrophs.
Photosynthetic and chemosynthetic organisms are both grouped into a category known as autotrophs: organisms capable of synthesizing their own food (more specifically, capable of using inorganic carbon as a carbon source). Photosynthetic autotrophs (photoautotrophs) use sunlight as an energy source, whereas chemosynthetic autotrophs (chemoautotrophs) use inorganic molecules as an energy source. Autotrophs are critical for all ecosystems. Without these organisms, energy would not be available to other living organisms and life itself would not be possible.
Photoautotrophs, such as plants, algae, and photosynthetic bacteria, serve as the energy source for a majority of the world’s ecosystems. Photoautotrophs harness the solar energy of the sun by converting it to chemical energy in the form of ATP (and NADP). The energy stored in ATP is used to synthesize complex organic molecules, such as glucose.
Chemoautotrophs are primarily bacteria that are found in rare ecosystems where sunlight is not available, such as in those associated with dark caves or hydrothermal vents at the bottom of the ocean (Figure 3). Many chemoautotrophs in hydrothermal vents use hydrogen sulfide (H2S), which is released from the vents as a source of chemical energy. This allows chemoautotrophs to synthesize complex organic molecules, such as glucose, for their own energy and in turn supplies energy to the rest of the ecosystem.
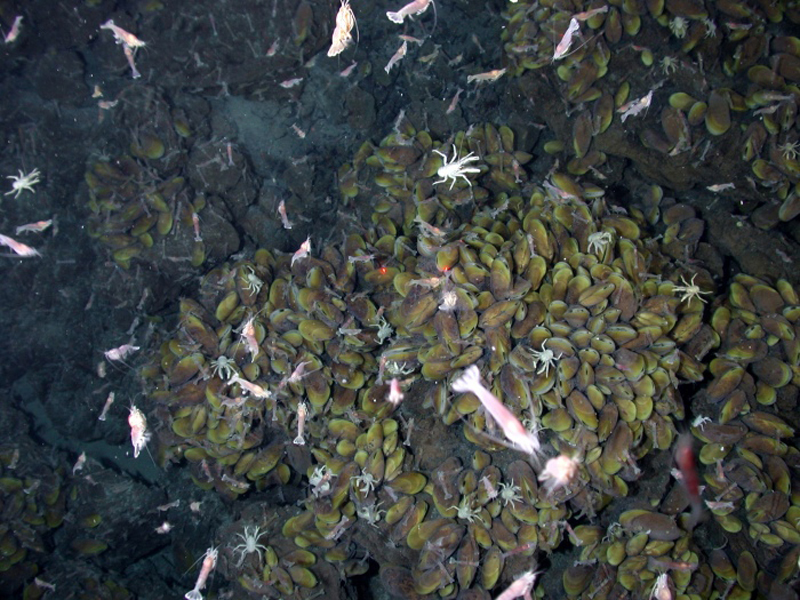
Figure 3 Swimming shrimp, a few squat lobsters, and hundreds of vent mussels are seen at a hydrothermal vent at the bottom of the ocean. As no sunlight penetrates to this depth, the ecosystem is supported by chemoautotrophic bacteria and organic material that sinks from the ocean’s surface. This picture was taken in 2006 at the submerged NW Eifuku volcano off the coast of Japan by the National Oceanic and Atmospheric Administration (NOAA). The summit of this highly active volcano lies 1535 m below the surface.
Food webs in the deep sea vary depending on proximity to seamount, hydrothermal vents, and trenches. In areas near hydrothermal vents, chemosynthetic bacteria are the major primary producers. These chemoautotrophs are what provides energy for the rest of the trophic levels in this system.
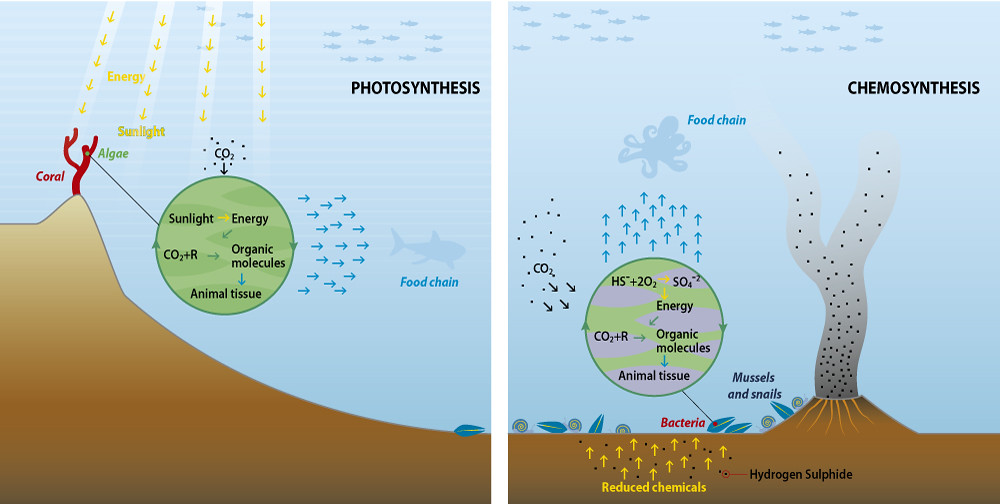
A comparison of photosynthetic (left) vs. chemosynthetic (right) food webs. Diagram developed by GRID-Arendal and licensed under CC-SA-NC.
Species in deep-sea ecosystems have adapted to interact with each other in many ways. One key interaction is the symbiosis between many species and chemosynthetic bacteria in hydrothermal vent systems. These bacteria live within the body of species like tubeworms, which are dependent on the bacteria to survive, similar to the relationship between zooxanthellae and coral. Another important type of deep sea community develops when a dead whale (or other large marine organism) carcass sinks to the ocean floor and provides an influx of nutrients. The communities support scavengers like hagfish, opportunists like bristle worms, and eventually enter a sulfophilic stage that appears similar to a hydrothermal vent community.

Whale falls serve as an extremely important influx of nutrients to the sun-starved deep ocean. This photo shows a Whale skeleton submerged in Monterey Bay National Marine Sanctuary, covered in octopuses and several other species. Photo by National Marine Sanctuaries is licenced under CC 2.0.
Heterotrophs
Unlike autotrophs, heterotrophs consume rather than produce biomass energy as they metabolize, grow, and add to levels of secondary production. A food web depicts a collection of polyphagous heterotrophic consumers that network and cycle the flow of energy and nutrients from a productive base of self-feeding autotrophs (Pimm et al. 1991; Odum and Barrett 2005; Benke 2010). Autotrophs and heterotrophs come in all sizes, from microscopic to many tonnes - from cyanobacteria to giant redwoods, and from viruses to blue whales.
A gradient exists between trophic levels running from complete autotrophs that obtain their sole source of carbon from the atmosphere, to mixotrophs (such as carnivorous plants) that are autotrophic organisms that partially obtain organic matter from sources other than the atmosphere, and complete heterotrophs that must feed to obtain organic matter.
There are different kinds of feeding relations that can be roughly divided into herbivory, carnivory, scavenging and parasitism. Some of the organic matter eaten by heterotrophs, such as sugars, provides energy. An often overlooked but key component of food webs are the decomposers.
Food webs can be controlled by top-down mechanisms (predator abundance determines the abundance of lower trophic levels), bottom-up mechanisms (primary producer abundance determines the abundance of higher trophic levels), or a combination of both. In wasp-waist food webs, population dynamics are controlled by planktivorous lower trophic level species such as sardine, anchovy, and small squids rather than the bottom or the top (Cury et al. 2011). These lower trophic level species often have high abundance but low diversity. The term “wasp-waist” describes the shape of these food webs, with many species existing at lower trophic levels (i.e., the plankton) and at higher trophic level (i.e., the predators), but very few lower trophic level species linking the plankton and the predators. These lower trophic level species exert top-down control on zooplankton and bottom-up control on top predators, with environmental factors largely affecting their abundance (Cury et al. 2000; Cury et al. 2003). Wasp-waist ecosystems are highly vulnerable to collapse when forage fish decline due to the critical energetic links that they provide between highly available zooplankton and larger predators (Shannon 2000).
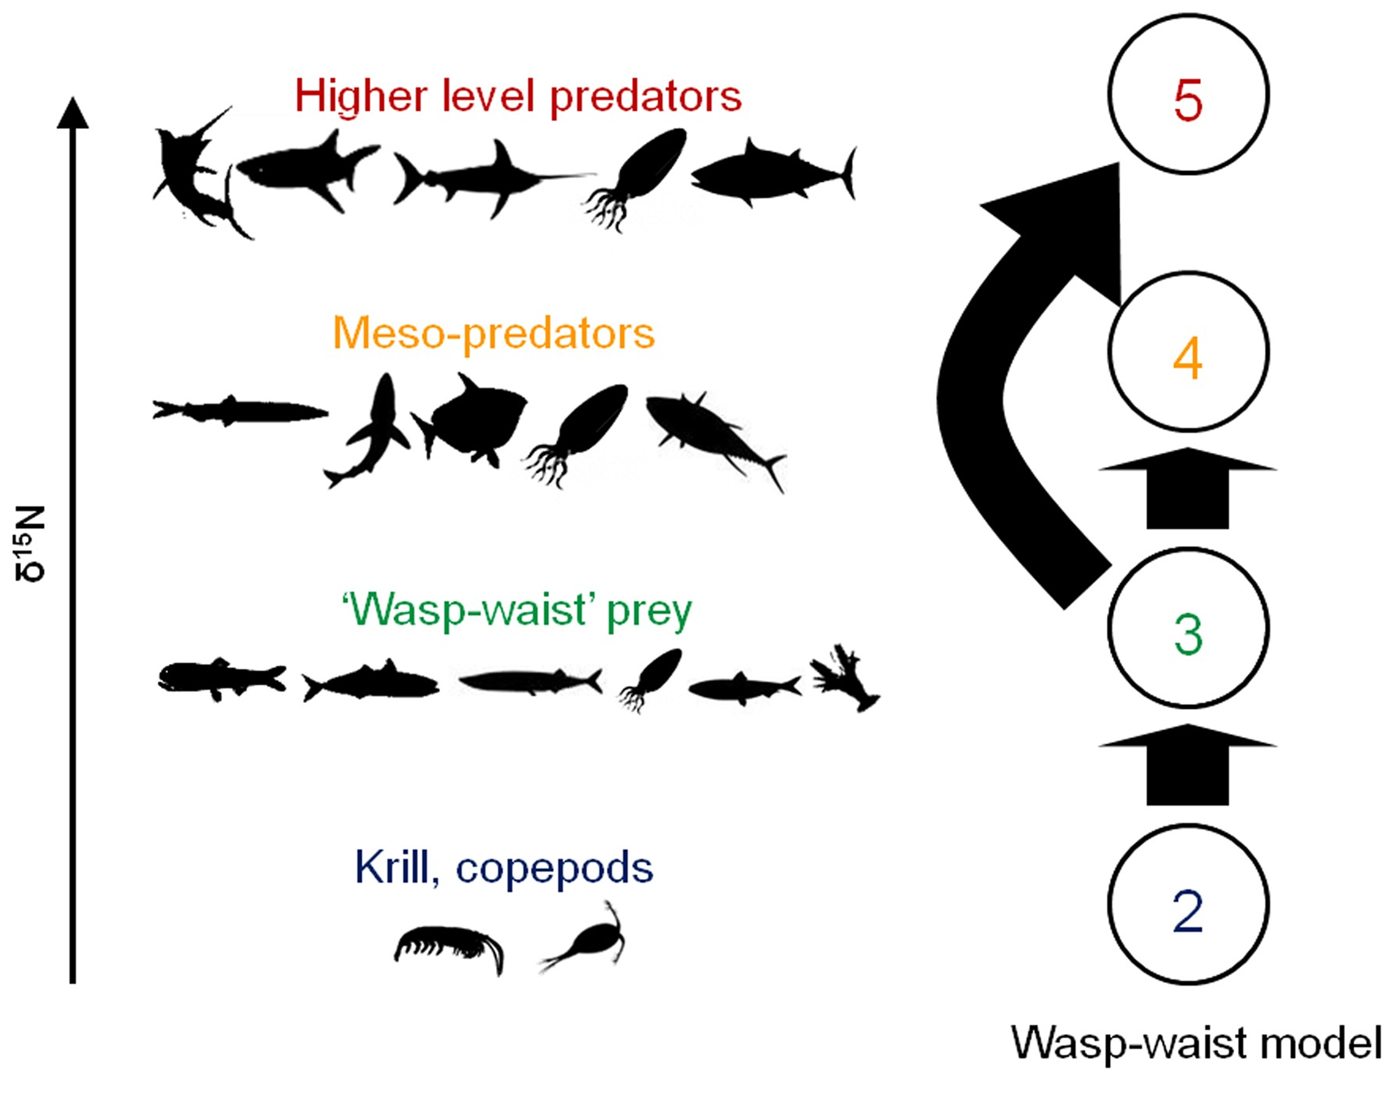
A diagram showing the structure of a wasp-waist model for the California Current Large Marine Ecosystem. Arrows indicate inputs of a trophic group to another. Figure modified from Madigan et al. 2012.
Decomposers, Detritivores, and Scavangers
Decomposers are organisms that break down dead or decaying organisms; they carry out decomposition, a process possible by only certain kingdoms, such as fungi (NOAA 2014). Like herbivores and predators, decomposers are heterotrophic, meaning that they use organic substrates to get their energy, carbon and nutrients for growth and development.
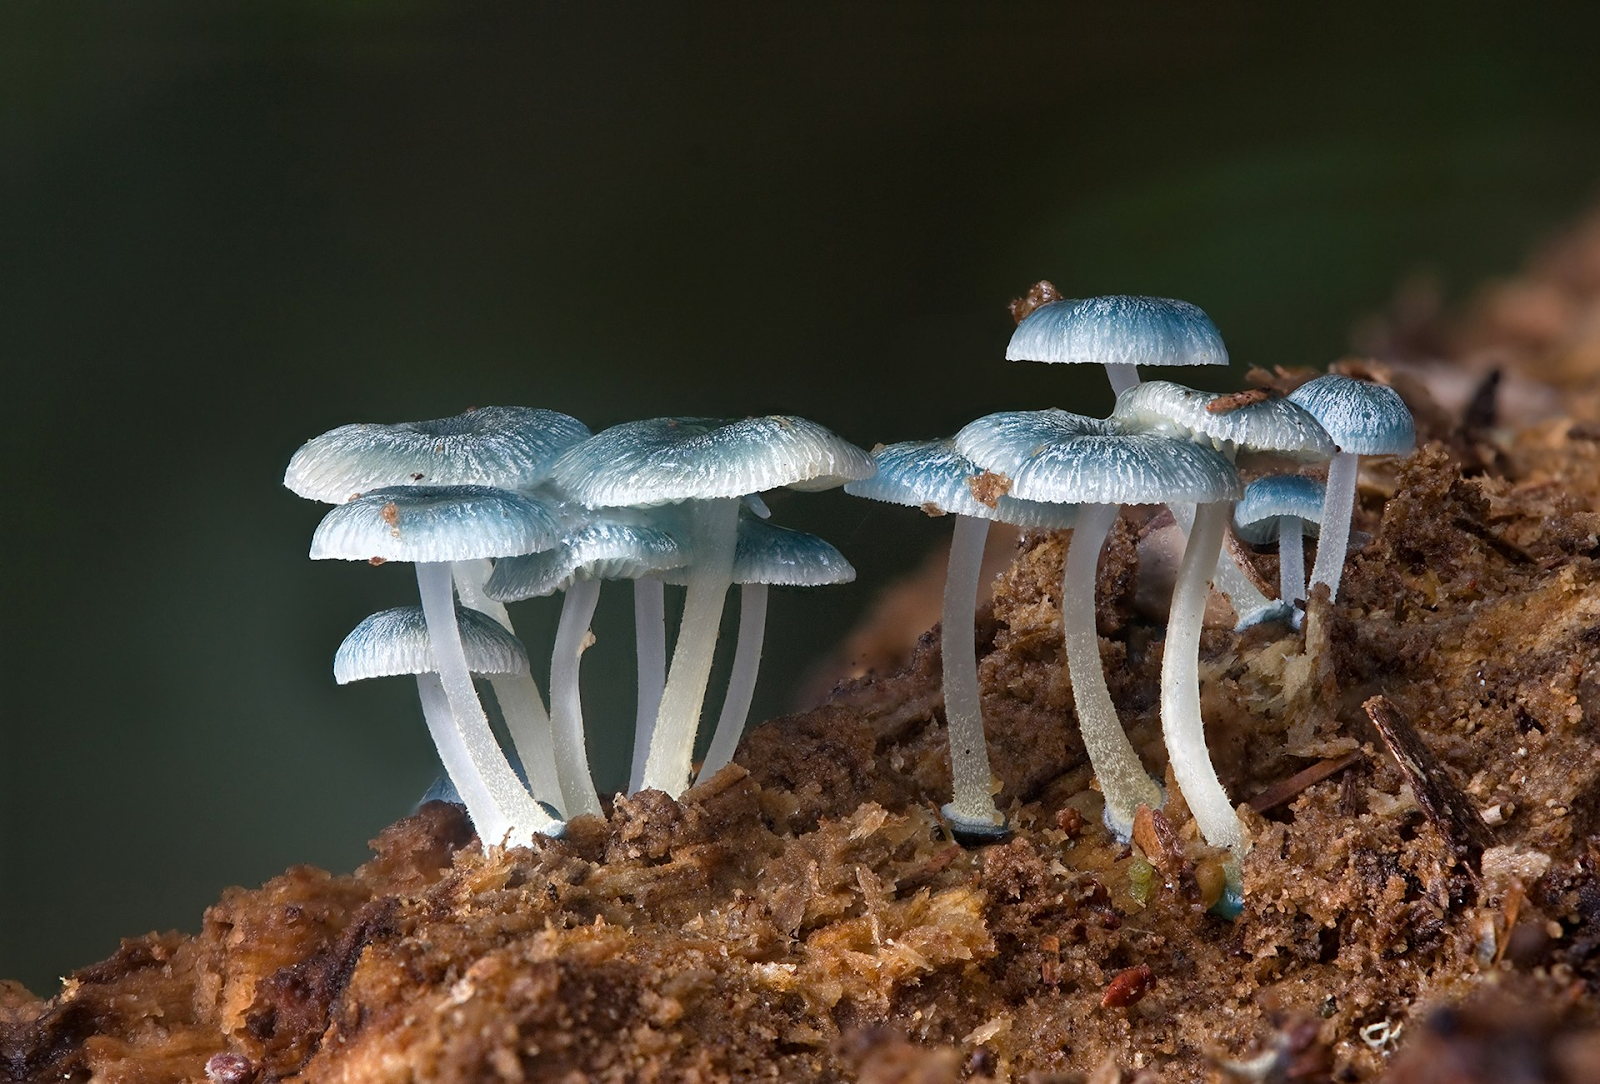
Figure 4: Fungi are the primary decomposers in most environments, illustrated here Mycena interrupta. Only fungi produce the enzymes necessary to decompose lignin, a chemically complex substance found in wood.
Detritivores (also known as detrivores, detritophages, detritus feeders, or detritus eaters) are heterotrophs that obtain nutrients by consuming detritus (decomposing plant and animal parts as well as feces) (Wetzel 2001). There are many kinds of invertebrates, vertebrates and plants that carry out coprophagy. By doing so, all these detritivores contribute to decomposition and the nutrient cycles. Detritivores are usually arthropods and help in the process of remineralization.
Plant tissues are made up of resilient molecules (cellulose, chitin, lignin and xylan) that decay at a much lower rate than other organic molecules. Detritivores perform the first stage of remineralization, by fragmenting the dead plant matter, allowing decomposers to perform the second stage of remineralization (Keddy 2017). The activity of detritivores are the reason why we do not see an accumulation of plant litter in nature (Keddy 2017; Sagi et al. 2019).
While the terms decomposer and detritivore are often interchangeably used, detritivores ingest and digest dead matter internally, while decomposers directly absorb nutrients through external chemical and biological processes (Keddy 2017). Thus, invertebrates such as earthworms, woodlice, and sea cucumbers are technically detritivores, not decomposers, since they must ingest nutrients - they are unable to absorb them externally (Sagi et al. 2019).
Detritivores are an important aspect of many ecosystems. They can live on any type of soil with an organic component, including marine ecosystems, where they are termed interchangeably with bottom feeders. Typical detritivorous animals include millipedes, springtails, woodlice, dung flies, slugs, many terrestrial worms, sea stars, sea cucumbers, fiddler crabs, and some sedentary polychaetes such as worms of the family Terebellidae.
Scavengers are animals that consume dead organisms that have died from causes other than predation or have been killed by other predators (Tan and Corlett 2011). While scavenging generally refers to carnivores feeding on carrion, it is also a herbivorous feeding behavior (Getz 2011). Scavengers play a fundamental role in the environment through the removal of decaying organisms, serving as a natural sanitation service (Ogada et al. 2011). While microscopic and invertebrate decomposers break down dead organisms into simple organic matter which are used by nearby autotrophs, scavengers help conserve energy and nutrients obtained from carrion within the upper trophic levels, and are able to disperse the energy and nutrients farther away from the site of the carrion than decomposers (Olson et a. 2016). Decomposers and detritivores complete this process, by consuming the remains left by scavengers. Scavengers are not typically thought to be detritivores, as they generally eat large quantities of organic matter.
Decomposers are often left off food webs, but if included, they mark the end of a food chain (Hutchinson 2013). Thus food chains start with primary producers and end with decay and decomposers. Since decomposers recycle nutrients, leaving them so they can be reused by primary producers, they are sometimes regarded as occupying their own trophic level (Kane et al. 2016; Pahl and Ruedas 2021).
Detritus is dead particulate organic material, as distinguished from dissolved organic material. Detritus typically includes the bodies or fragments of bodies of dead organisms, and fecal material. Detritus typically hosts communities of microorganisms that colonize and decompose (i.e. remineralize) it. In terrestrial ecosystems it is present as leaf litter and other organic matter that is intermixed with soil, which is denominated "soil organic matter". The detritus of aquatic ecosystems is organic material that is suspended in the water and accumulates in depositions on the floor of the body of water; when this floor is a seabed, such a deposition is denominated "marine snow".
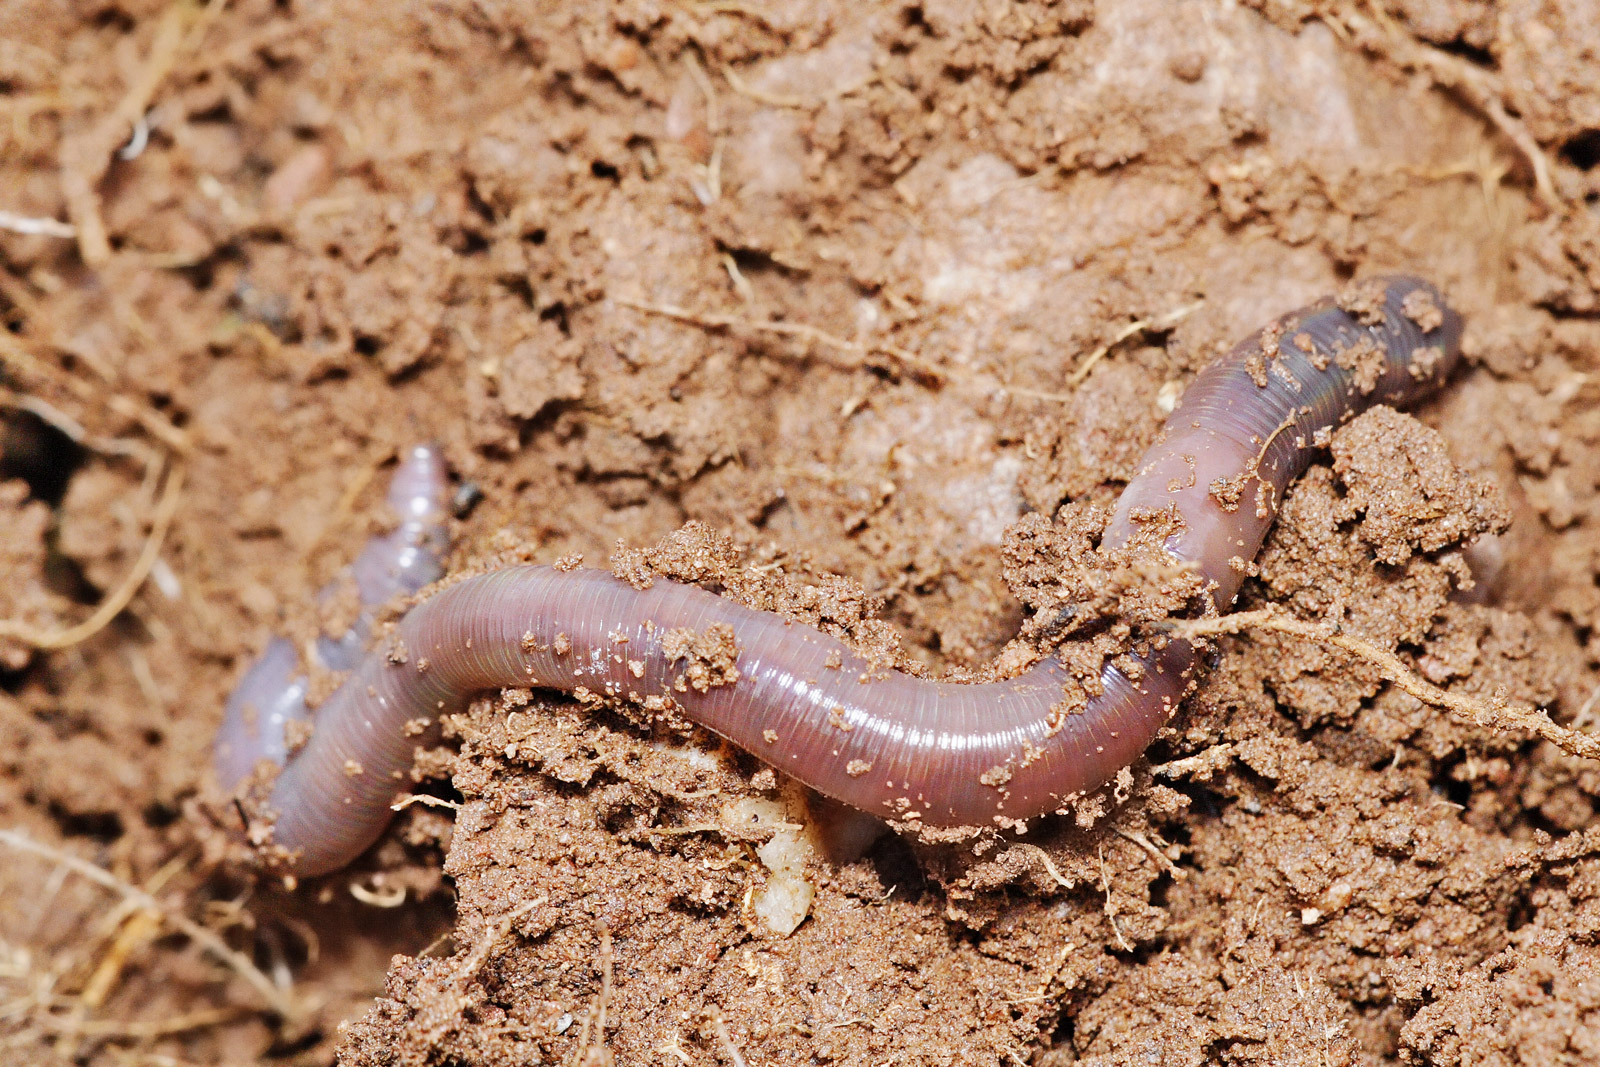
Earthworms are soil-dwelling detritivores.
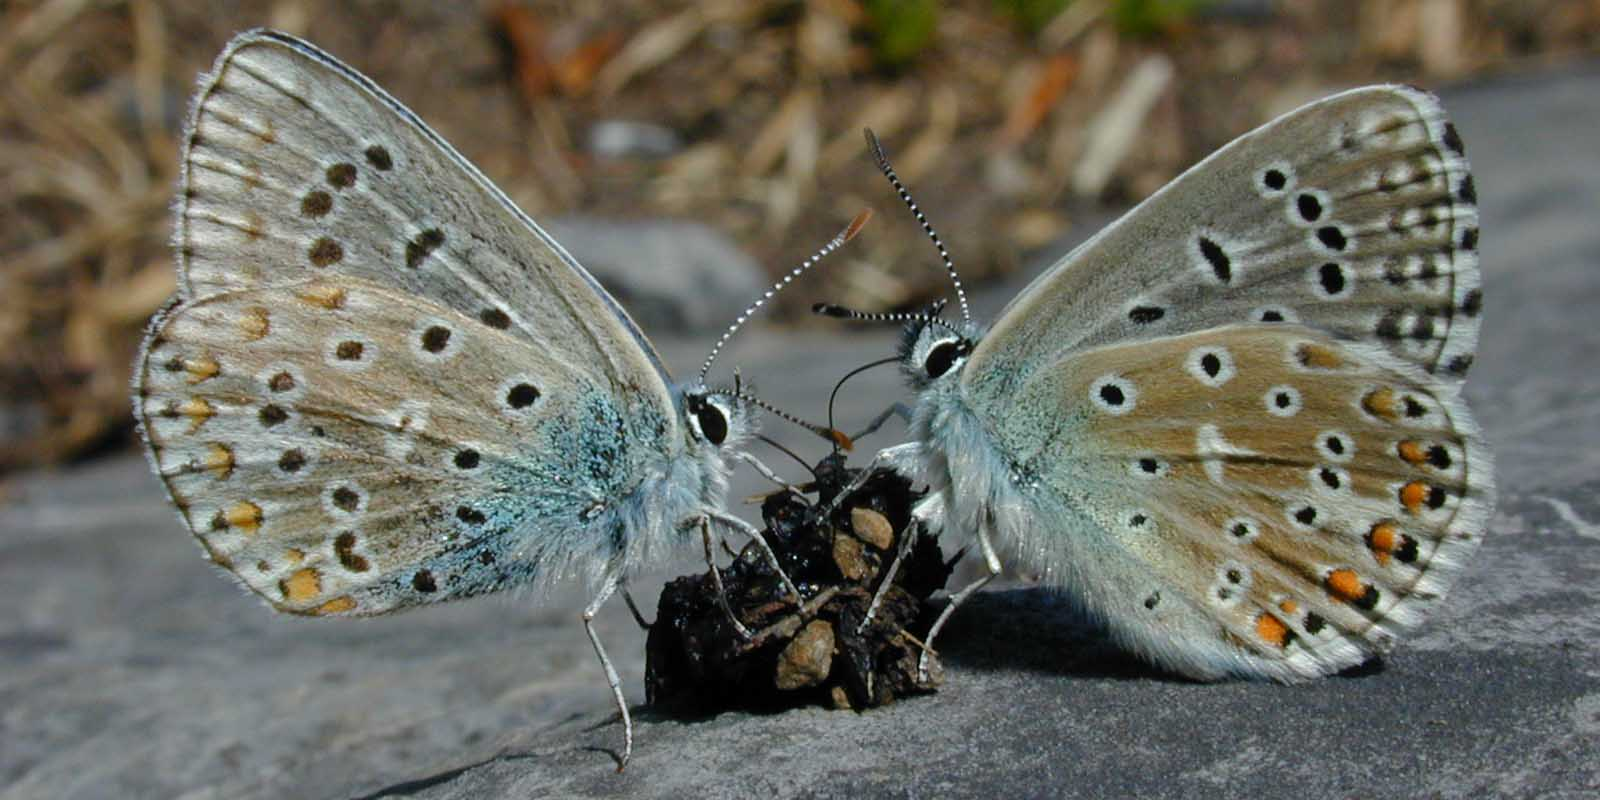
Two Adonis blue butterflies lap at a small lump of feces lying on a rock.
In a detrital web, plant and animal matter is broken down by decomposers, e.g., bacteria and fungi, and moves to detritivores and then carnivores (Gönenç et al. 2007). There are often relationships between the detrital web and the grazing web. Mushrooms produced by decomposers in the detrital web become a food source for deer, squirrels, and mice in the grazing web. Earthworms are detritivores that consume decaying leaves and are then consumed by a variety of wildlife, especially birds.
Trophic Levels
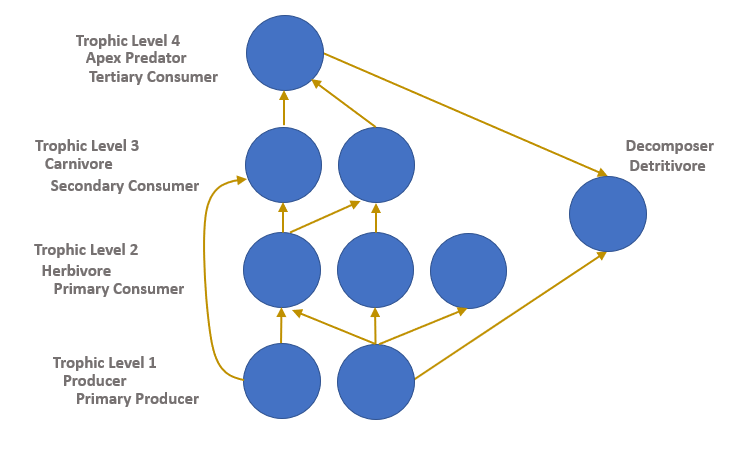
Figure 7: Food web diagram showing the various ways in which organism roles can be differentiated. Developed by N. Gownaris.
The trophic level of an organism is the position it occupies in a food web. A food chain is a succession of organisms that eat other organisms and may, in turn, be eaten themselves. The trophic level of an organism is the number of steps it is from the start of the chain. A food web starts at trophic level 1 with primary producers such as plants, can move to herbivores at level 2, carnivores at level 3 or higher, and typically finish with apex predators at level 4 or 5. The path along the chain can form either a one-way flow or a food "web". Ecological communities with higher biodiversity form more complex trophic paths. The word trophic derives from the Greek τροφή (trophē) referring to food or nourishment (merriam-webster.com, 2017).
Trophic levels can be represented by numbers, starting at level 1 with plants. Further trophic levels are numbered subsequently according to how far the organism is along the food chain.
- Level 1: Plants and algae make their own food and are called producers.
- Level 2: Herbivores eat plants and are called primary consumers.
- Level 3: Carnivores that eat herbivores are called secondary consumers.
- Level 4: Carnivores that eat other carnivores are called tertiary consumers.
- Apex predators by definition have no predators and are at the top of their food web.
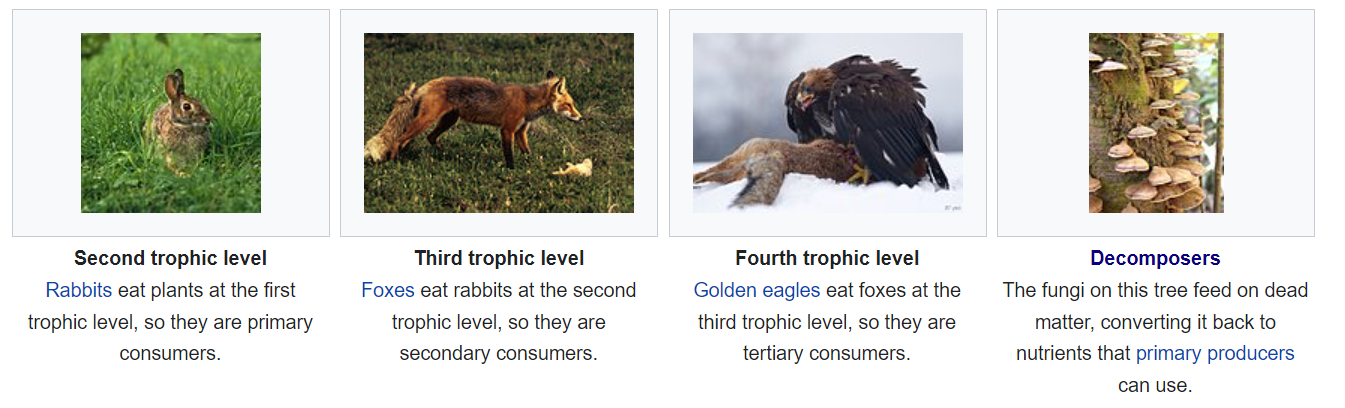
Figure 8: Examples of species found at each trophic level of a terrestrial ecosystem.
The trophic level concept was introduced in a historical landmark paper on trophic dynamics in 1942 by Raymond L. Lindeman. The basis of trophic dynamics is the transfer of energy from one part of the ecosystem to another (Odum and Heald 1975; Cortés 1999). The trophic dynamic concept has served as a useful quantitative heuristic, but it has several major limitations including the precision by which an organism can be allocated to a specific trophic level. Omnivores, for example, are not restricted to any single level. Nonetheless, recent research has found that discrete trophic levels do exist, but "above the herbivore trophic level, food webs are better characterized as a tangled web of omnivores.” (Pauly et al. 1998).
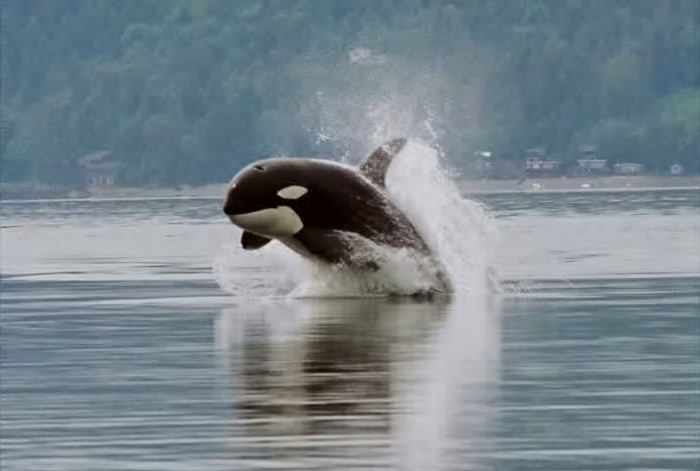
Figure 9: Killer whales (orca) are apex predators but they are divided into separate populations that hunt specific prey, such as tuna, small sharks, and seals.
The fisheries scientist Daniel Pauly sets the values of trophic levels to one in plants and detritus, two in herbivores and detritivores (primary consumers), three in secondary consumers, and so on. The definition of the trophic level, TL, for any consumer species is (Pauly and Palomares 2005)
\[ T L_{i}=1+\sum_{j}\left(T L_{j} \cdot D C_{i j}\right) \nonumber\]
where
\[ T L_{j} \nonumber\]
is the fractional trophic level of the prey j, and
\[ D C_{i j} \nonumber\]
represents the fraction of j in the diet of i. That is, the consumer trophic level is one plus the weighted average of how much different trophic levels contribute to its food.
In the case of marine ecosystems, the trophic level of most fish and other marine consumers takes a value between 2.0 and 5.0. The upper value, 5.0, is unusual, even for large fish (Cortés 1999), though it occurs in apex predators of marine mammals, such as polar bears and orcas (Pauly et al. 1998).
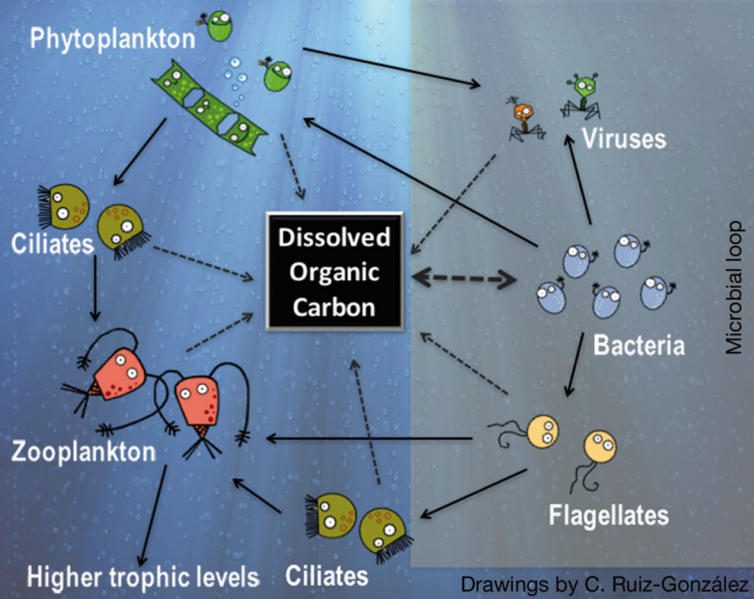
Simplified microbial food web in the sunlit ocean by Anders et al. is licensed under CC-BY-SA 4.0. Left side: classic description of the carbon flow from photosynthetic algae to grazers and higher trophic levels in the food chain. Right side: microbial loop, with bacteria using dissolved organic carbon to gain biomass, which then re-enters the classic carbon flow through protists. Based on DeLong & Karl (2005).
The microbial food web refers to the combined trophic interactions among microbes in aquatic environments. These microbes include viruses, bacteria, algae, heterotrophic protists (such as ciliates and flagellates) (Mostajir et al. 2015). Scientists have relatively recently begun to appreciate the importance of this microscopic food web to the functioning of higher trophic levels.
In aquatic environments, microbes constitute the base of the food web. Single celled photosynthetic organisms such as diatoms and cyanobacteria are generally the most important primary producers in the open ocean. Many of these cells, especially cyanobacteria, are too small to be captured and consumed by small crustaceans and planktonic larvae. Instead, these cells are consumed by phagotrophic protists which are readily consumed by larger organisms. Viruses can infect and break open bacterial cells and (to a lesser extent), planktonic algae (a.k.a. phytoplankton). Therefore, viruses in the microbial food web act to reduce the population of bacteria and, by lysing bacterial cells, release particulate and dissolved organic carbon (DOC). DOC may also be released into the environment by algal cells. The microbial loop describes a pathway in the microbial food web where DOC is returned to higher trophic levels via the incorporation into bacterial biomass.
Ecological Pyramids
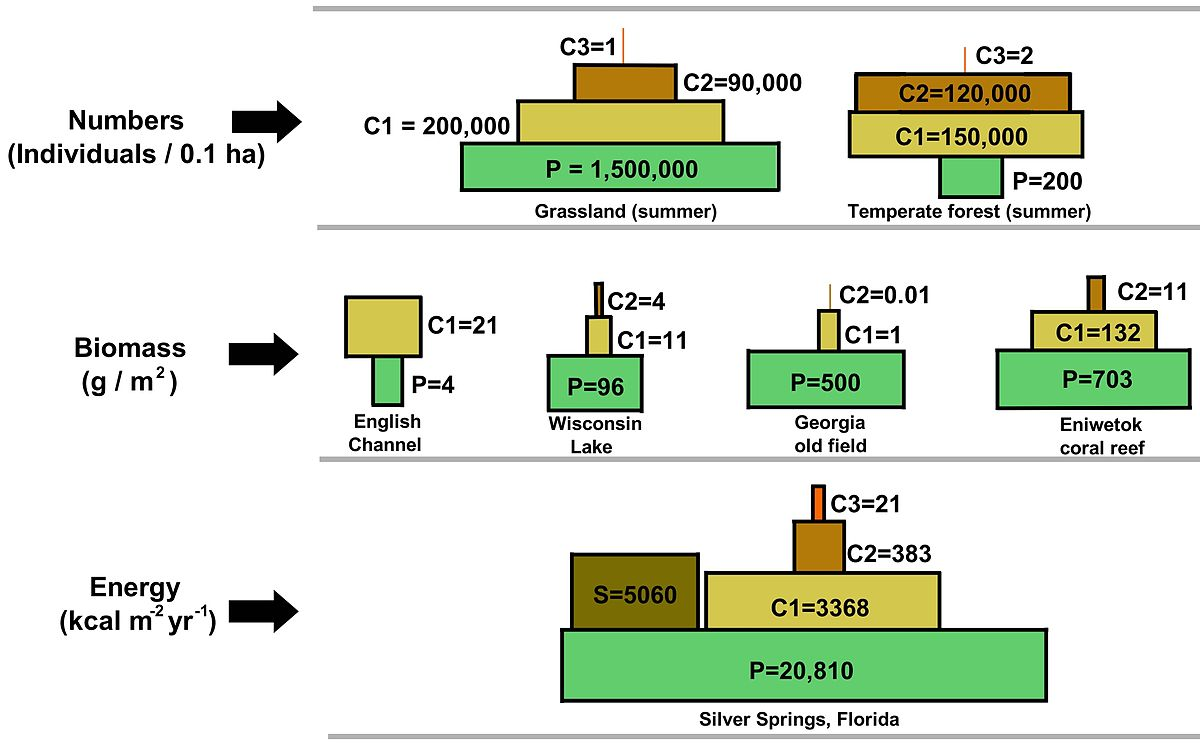
Figure 10: Illustration of a range of ecological pyramids, including top pyramid of numbers, middle pyramid of biomass, and bottom pyramid of energy. The terrestrial forest (summer) and the English Channel ecosystems exhibit inverted pyramids.Note: trophic levels are not drawn to scale and the pyramid of numbers excludes microorganisms and soil animals. Abbreviations: P=Producers, C1=Primary consumers, C2=Secondary consumers, C3=Tertiary consumers, S=Saprotrophs (Odum and Barrett 2005).
Ecological trophic pyramids are typically one of three kinds: 1) pyramid of numbers, 2) pyramid of biomass, or 3) pyramid of energy (Odum and Barrett 2005). In a pyramid of numbers, the number of consumers at each level decreases significantly, so that a single top consumer, (e.g., a polar bear or a human), will be supported by a much larger number of separate producers. There is usually a maximum of four or five links in a food chain, although food chains in aquatic ecosystems are more often longer than those on land. Eventually, all the energy in a food chain is dispersed as heat (Odum and Barrett 2005).
Ecological pyramids place the primary producers at the base. They can depict different numerical properties of ecosystems, including numbers of individuals per unit of area, biomass (g/m2), and energy (k cal m−2 yr−1). The emergent pyramidal arrangement of trophic levels with amounts of energy transfer decreasing as species become further removed from the source of production is one of several patterns that is repeated amongst the planet’s ecosystems (Pimm et al. 1991; Raffaelli 2002; Proulx et al. 2005). The size of each level in the pyramid generally represents biomass, which can be measured as the dry weight of an organism (Rickleffs 1996). Autotrophs may have the highest global proportion of biomass, but they are closely rivaled or surpassed by microbes (Whitman et al. 1998; Grommbridge and Jenkins 2002).
Pyramid structure can vary across ecosystems and across time. In some instances biomass pyramids can be inverted. This pattern is often identified in aquatic and coral reef ecosystems. The pattern of biomass inversion is attributed to different sizes of producers. Aquatic communities are often dominated by producers that are smaller than the consumers that have high growth rates. Aquatic producers, such as planktonic algae or aquatic plants, lack the large accumulation of secondary growth as exists in the woody trees of terrestrial ecosystems. However, they are able to reproduce quickly enough to support a larger biomass of grazers. This inverts the pyramid. Primary consumers have longer lifespans and slower growth rates that accumulate more biomass than the producers they consume. Phytoplankton live just a few days, whereas the zooplankton eating the phytoplankton live for several weeks and the fish eating the zooplankton live for several consecutive years (Spellman 2008). Aquatic predators also tend to have a lower death rate than the smaller consumers, which contributes to the inverted pyramidal pattern. Population structure, migration rates, and environmental refuge for prey are other possible causes for pyramids with biomass inverted. Energy pyramids, however, will always have an upright pyramid shape if all sources of food energy are included and this is dictated by the second law of thermodynamics (Odum and Barrett 2005; Wang et al. 2009).
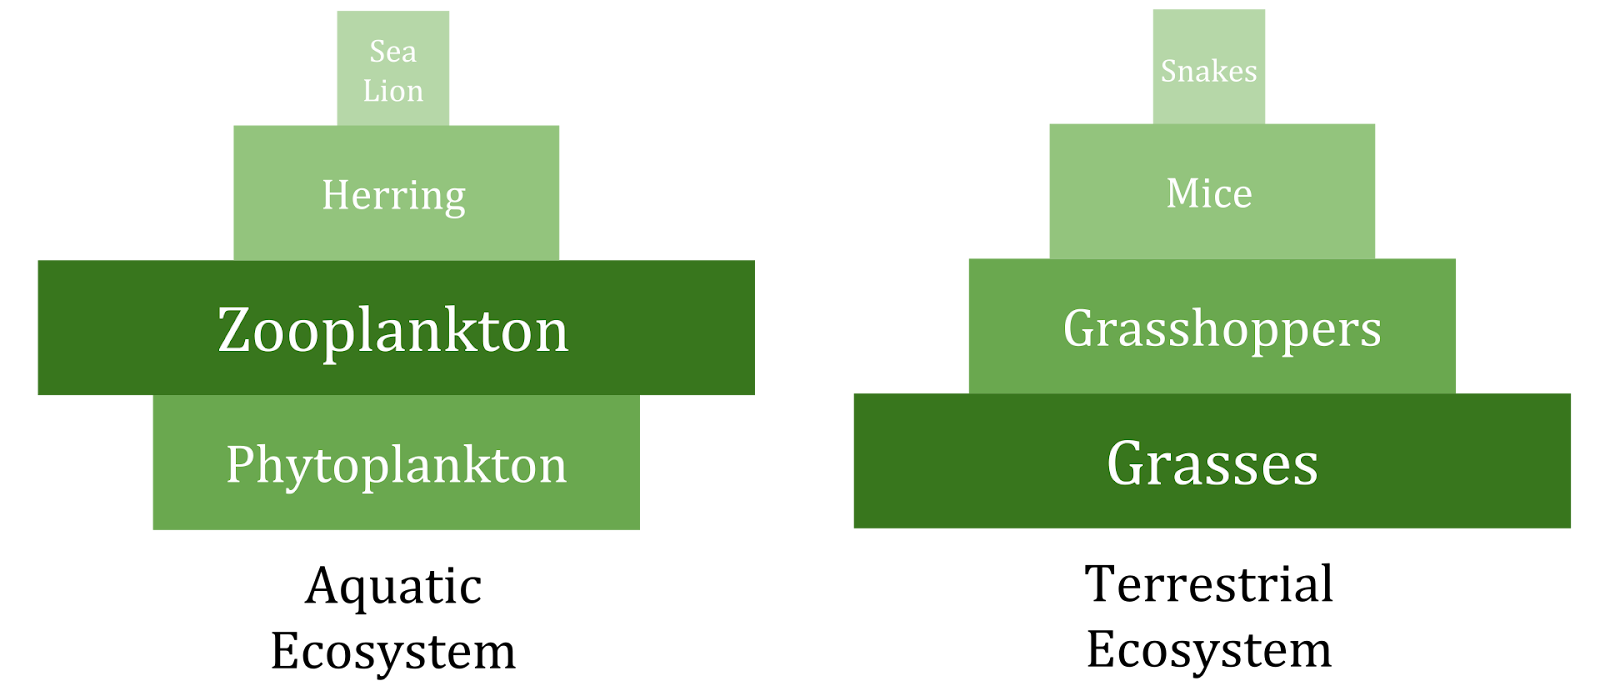
Figure 11: A pyramid of biomass shows the total biomass of the organisms involved at each trophic level of an ecosystem. These pyramids are not necessarily upright. There can be lower amounts of biomass at the bottom of the pyramid if the rate of primary production per unit biomass is high.