
6.2: Anthropogenic Climate Change
- Page ID
- 105345

Anthropogenic Climate Change
- Please read and watch the following Learning Resources
- Reading the material for understanding, and taking notes during videos, will take approximately 2 hours.
- Optional Activities are embedded.
- To navigate to the next section, use the Contents menu at the top of the page OR the right arrow on the side of the page.
- If on a mobile device, use the Contents menu at the top of the page OR the links at the bottom of the page.
- Identify the historical beginnings of anthropogenic climate change
- Explain how current climate change is measured
- Describe the scientific consensus on anthropogenic climate change
- Identify human impacts on specific greenhouse gases
Introduction
Evidence supports the relationship between atmospheric concentrations of carbon dioxide and temperature: as carbon dioxide rises global temperature rises. Since 1950, the concentration of atmospheric carbon dioxide has increased from about 280 ppm to 382 ppm in 2006. In 2021, the atmospheric carbon dioxide concentration was 415 ppm.
This 2.5-minute video shows how atmospheric CO2 has varied recently and also over the last 800,000 years as determined by many CO2 monitoring stations (shown on the insert map). It is also instructive to watch the CO2 variation of the video by latitude. This shows that most of the sources of CO2 are in the Northern Hemisphere where humans reside.
Question after watching: What general trends do you notice over the last 800,000 years? How is the current climate breaking those trends?
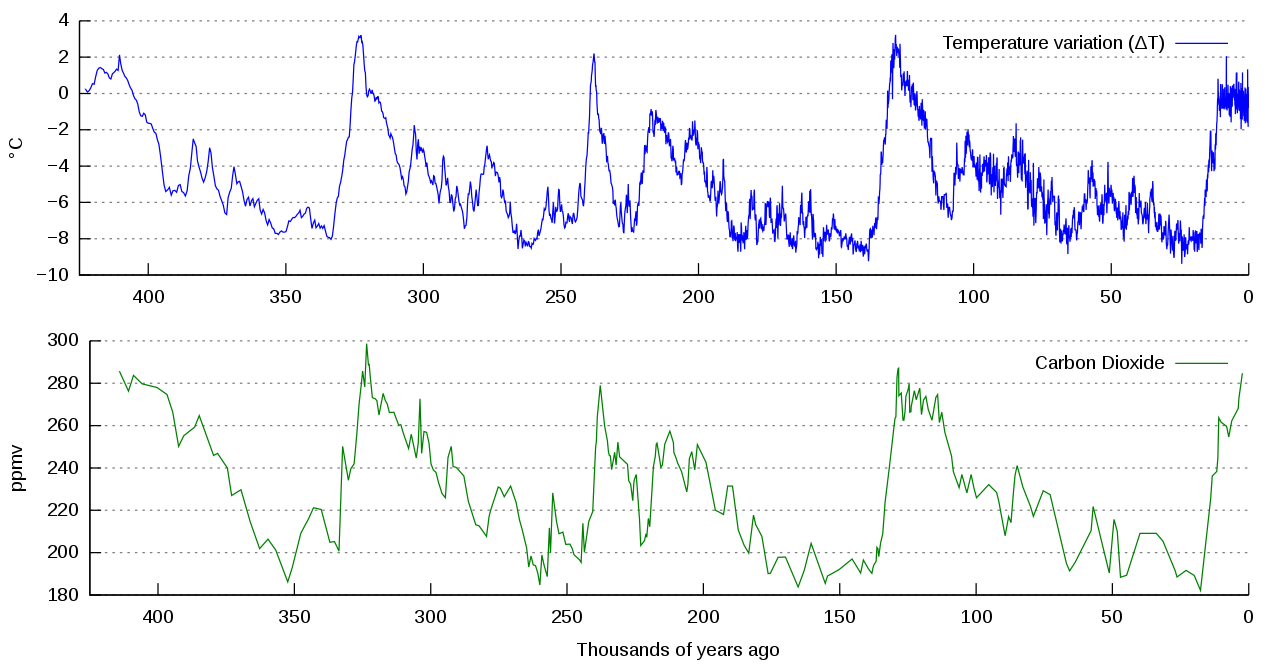
Scientists look at patterns in data and try to explain differences or deviations from these patterns. The atmospheric carbon dioxide data reveal a geologic pattern of carbon dioxide increasing and decreasing, cycling between a low of 180 ppm and a high of 300 ppm before decreasing again, generally over 100,000 year Malankovich cycles (see Unit 5.3.1). Scientists have concluded that it took around 50,000 years for the atmospheric carbon dioxide level to increase from its traditionally low minimum concentration at the height of the last ice age to its higher maximum concentration. However, starting recently, atmospheric carbon dioxide concentrations have increased beyond the historical maximum of 300 ppm. The current increases in atmospheric carbon dioxide have happened very quickly—in a matter of hundreds of years rather than thousands of years. What is the reason for this difference in the rate of change and the amount of increase in carbon dioxide and other greenhouse gases (GHGs)?
Anthropogenic Climate Change
Anthropogenic climate change refers to the impacts of humans on the climate system. Scientists generally look to the Industrial Era as the beginning of anthropogenic climate change, which is the advent of the use of fossil fuels, beginning with coal, to power machinery in the middle of the 1700s. Some climate scientists argue that anthropogenic climate change actually begins much earlier than the Industrial Era and that humans began impacting the climate through deforestation and land clearing to grow food. This would include farming grains in Europe and the Middle East during the first Agricultural Revolution around 8,000 years BCE and developing artificial wetlands for rice cultivation in Asia around 5,000 years BCE. Clearing vegetation for crops is a type of climate-forcing, meaning greenhouse gases (in this case, carbon dioxide) are being released into the atmosphere. The carbon dioxide storage capacity of crops is generally lower than that of the forests originally there. Creating wetlands is also a carbon source due to the bacterial decay of organic matter within wetlands that produces methane.
In fact, whether anthropogenic climate change started with the Agricultural Revolution or the Industrial Revolution is not important, because the really significant climate changes did not start until the early part of the 20th century. Human activities and population size are intertwined. As more and more of the world's population adopts a resource-intensive lifestyle, the climate problem becomes worse. These lifestyles currently require fossil fuels, which provide relatively cheap and abundant energy and are used for everything from transportation and heating and cooling to industry and food production.
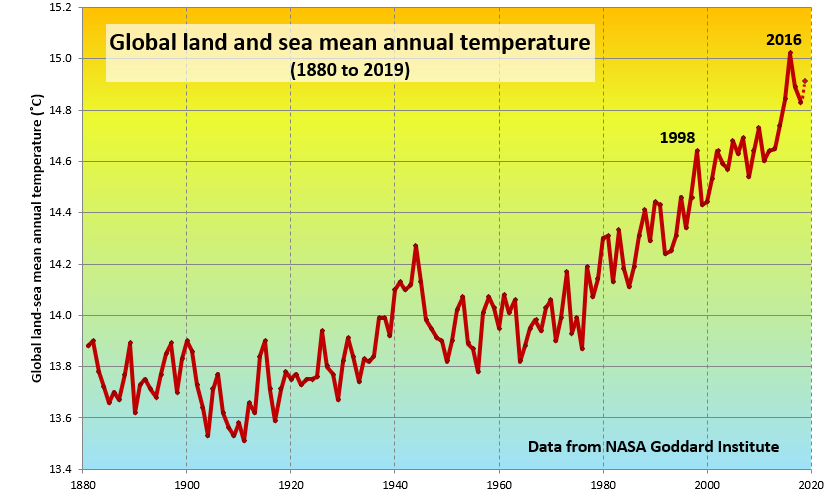
This escalating level of industrialization and mechanization of our lives has driven the anthropogenic climate change of the past century. The trend of mean global temperatures since 1880 is shown in Figure \(\PageIndex{1}\). For approximately the past 55 years, the temperature has increased at a relatively steady and rapid rate, especially compared to past changes. The average temperature now is approximately 1.0°C higher than before industrialization, and two-thirds of this warming has occurred since 1975. Since 1880, average global surface temperatures have trended upward and most of that warming has occurred since 1970. Since the ocean is absorbing a lot of the additional trapped heat, surface temperatures include both land surface and ocean temperatures.
This 60-second animation from two of the world's leading science academies brings you the science behind climate change.
Question after watching: Of the graphs shown, which had you seen before (similar or the same)? Which ones were new to you? What does this make you think about?
How has the global average temperature changed since the Industrial Revolution?
- Cooler by 0.1oC
- The temperature has gone up and down, but remains overall the same
- Warmer by more than 1oC
- Warmer by almost 2oC
-
C. Warmer by more than 1oC
How Do We Know? Measuring Current Climate Change
Changes in land surface or ocean surface temperatures can be expressed as temperature anomalies. A temperature anomaly is a difference in average temperature measurement from a predetermined datum (or baseline). This datum is the average temperature of a particular date range, for example, 1951 to 1980. Another common datum is the last century (1900-2000). Therefore, an anomaly of 1.25 ℃ for 2015 (last century datum) means that the average temperature for 2015 was 1.25 ℃ greater than the 1900-2000 average. In 1950, the temperature anomaly was -0.28 ℃, so this is -0.28 ℃ lower than the 1900-2000 average [3]. These temperatures are annual average surface temperatures. Figure \(\PageIndex{2}\) shows the global mean temperature estimates for the period of 1880 to 2020 using the datum of the 1951-1980 average temperature.
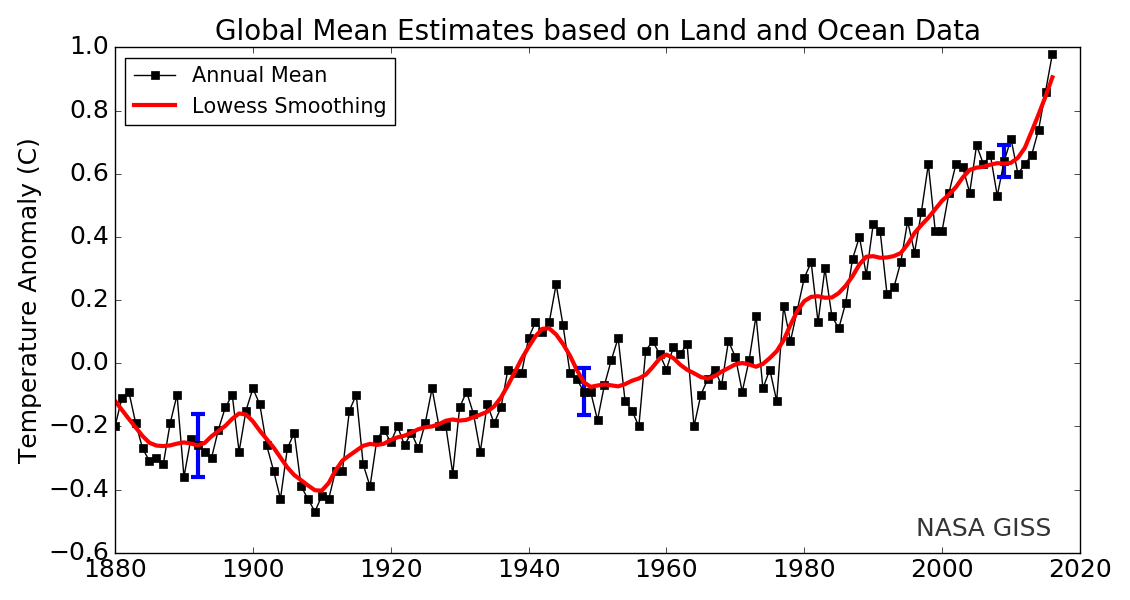
[From https://opengeology.org/textbook/15-...limate-change/ Adapted from Source: National Climate Data Center]
Other valuable insights have been obtained by running sophisticated mathematical global climate models on high-powered supercomputers. These “virtual experiments” examine the potential climatic responses to increases in atmospheric CO2. These computer simulations are known as three-dimensional general circulation models (GCMs). The models simulate the complex movements of energy and mass in the global circulation of the atmosphere. They also examine the interactions of these processes with physical variables that are important aspects of climate, such as temperature and precipitation. A strong tendency that emerges from these virtual experiments is that global warming and associated climate changes are a likely consequence of the well-documented increases of CO2 and other GHGs in the atmosphere.
Many such simulation experiments have examined the scenario of a doubling of CO2 concentration to 800 ppm from its recent concentration of just over 400 ppm. These experiments suggest that such a doubling would result in an increase of 1°C to 4°C in the average temperature of the surface atmosphere. The intensity of warming is predicted to be greatest in high-latitude regions, where the temperature increases might be two to three times greater than in the tropics.
Warming of the lower atmosphere will be one likely change that will be caused by an increased intensity of the greenhouse effect. However, there could also be important effects that occur indirectly due to increased temperatures. The most important of these would include large-scale shifts in the patterns of atmospheric circulation. Such shifts would likely result in changes in the amounts, distribution, and seasonality of precipitation. Changes in precipitation regimes would influence soil moisture, which would greatly affect the distribution and productivity of vegetation, both natural and managed. These changes in precipitation regime would likely have much greater effects on agricultural and wild ecosystems than would any direct influence of a warmed atmosphere.
"Indigenous research methodologies are "…as old as our ceremonies and our nations. They are with us and have always been with us” (Cardinel, 2001). The methodologies for Indigenous-led research are varied across and within First Nation, Inuit, and Métis communities across Canada reflecting the diversity of worldviews and ways of knowing" (First Peoples Group, 2022).
"Many Indigenous climate monitoring projects co-apply Indigenous Knowledge Systems with science bringing together the strengths of both knowledge systems. This has been described as two-eyed seeing (Etuaptmumk in Mi’kmaw), which involves 'learning to see from one eye with the strengths of Indigenous Knowledges and ways of knowing, and from the other eye with the strengths of mainstream knowledges and ways of knowing, and to use both these eyes together, for the benefit of all' (Marshall, 2020)" (First Peoples Group, 2022).
"Indicators are used by many Indigenous Peoples to understand and communicate about ecological change. They are the signs and signals that have guided understanding and decisions within Indigenous communities for hundreds if not thousands of years. Climate indicators can relate to:
- radiation (solar radiation or sunlight; surface temperature and thermal radiation)
- the atmosphere (e.g., temperature, precipitation, wind, humidity);
- the land (e.g., changes in permafrost, soil moisture, soil temperature, water-table depth)
- water quantity (e.g., flow, water depth) or quality (e.g., pH, dissolved oxygen, nitrate, phosphates, water temperature)
- ice and snow (e.g., timing of ice formation and breakup, thickness, quality; snow depth)
- plants and animals (e.g., timing of arrival of species, species population and distribution, health and body condition, taste and yield of berries, spectroscopy)" (First Peoples Group, 2022).
"Elders and Knowledge keepers hold invaluable knowledge about the changes to the land and the environment as a whole. Going out on the land with Knowledge holders can provide a natural space for intergenerational knowledge transfer and Indigenous Knowledge sharing. Participatory video is a newer method of documenting community climate observations and stories through mobilizing stories and collectively-held knowledge with diverse audiences to inform climate adaptation" (First Peoples Group, 2022).
"Many Indigenous climate monitoring projects also follow scientific methods for collecting data. Many monitoring projects incorporate sensors and automated instrumentation which remain in the field such as weather stations, hydrological sensors, trail cameras, soil temperature sensors, etc. Some community-based monitoring projects are even using observations from space-based remote sensors (e.g., Landsat 8, LIDAR)" (First Peoples Group, 2022).
In 2022, the federal government announced $800 million towards Indigenous-led conservation efforts, including those that help to mitigate climate change, like the BC Northern Shelf Bioregion: https://pm.gc.ca/en/news/news-releases/2022/12/07/protecting-more-nature-partnership-indigenous-peoples
Sources:
Cardinel, L. 2001. What is an Indigenous Perspective? Canadian Journal of Native Education, 25(2), 180-182.
Elder Dr. Albert Marshall from Reid, Andrea J Lauren E. Eckert, John-Francis Lane, Nathan Young, Scott G. Hinch, Chris T. Darimont, Steven J. Cooke, Natalie C. Ban, Albert Marshall. 2020. “Two-Eyed Seeing”: An Indigenous framework to transform fisheries research and management. Fish and Fisheries 22:2, p243-261. Available at: https://doi.org/10.1111/faf.12516
This beautifully illustrated animation video explains what climate change means for Tsay Keh Dene, the changes that elders have observed in their territories of British Columbia, and how these changes will impact local cultures and traditional practices. It describes the Tsay Keh Dene and Carcross Tagish Community-Based Climate Monitoring project funded by Crown-Indigenous Relations and Northern Affairs Canada.
Scientific Consensus: Global Anthropogenic Climate Change is Real
The Intergovernmental Panel on Climate Change (IPCC)—established by the United Nations Environment Programme and the World Meteorological Organization in 1988—is responsible for reviewing the scientific literature on climate change and issuing periodic reports on several topics, including the scientific basis for understanding climate change, our vulnerability to observed and predicted climate changes, and what we can do to limit climate change and minimize its impacts. The IPCC uses this information to evaluate current impacts and future risks, in addition to providing policymakers with assessments. These assessments are released about once every six years. The Panel is on their most recent Synthesis Report, the 6th Assessment Report. Working group reports were released in 2021-2022. Hundreds of leading scientists from around the world are chosen to author these reports. Over the history of the IPCC, these scientists have reviewed thousands of peer-reviewed, publicly available studies. The scientific consensus according to the last IPCC assessment is clear: global climate change is real and humans are very likely the cause for this change.
Additionally, the major scientific agencies of the US government also agree that climate change is occurring and that humans are driving it. From the Third National Climate Assessment: “Global climate is changing and is apparent over a wide range of observations. The global warming over the past 50 years is primarily due to human activities.” Many independent scientific organizations have released similar statements, both in the US and abroad. This does not necessarily mean that every scientist agrees on the strength of each component of the climate change system, but a nearly universal agreement exists that climate change is happening and is primarily caused by excess greenhouse gases from human activities.
This 14-minute video from the IPCC summarizes much of the 6th Assessment Report on Impacts, Adaptation, and Vulnerability with a global focus.
Question after watching:
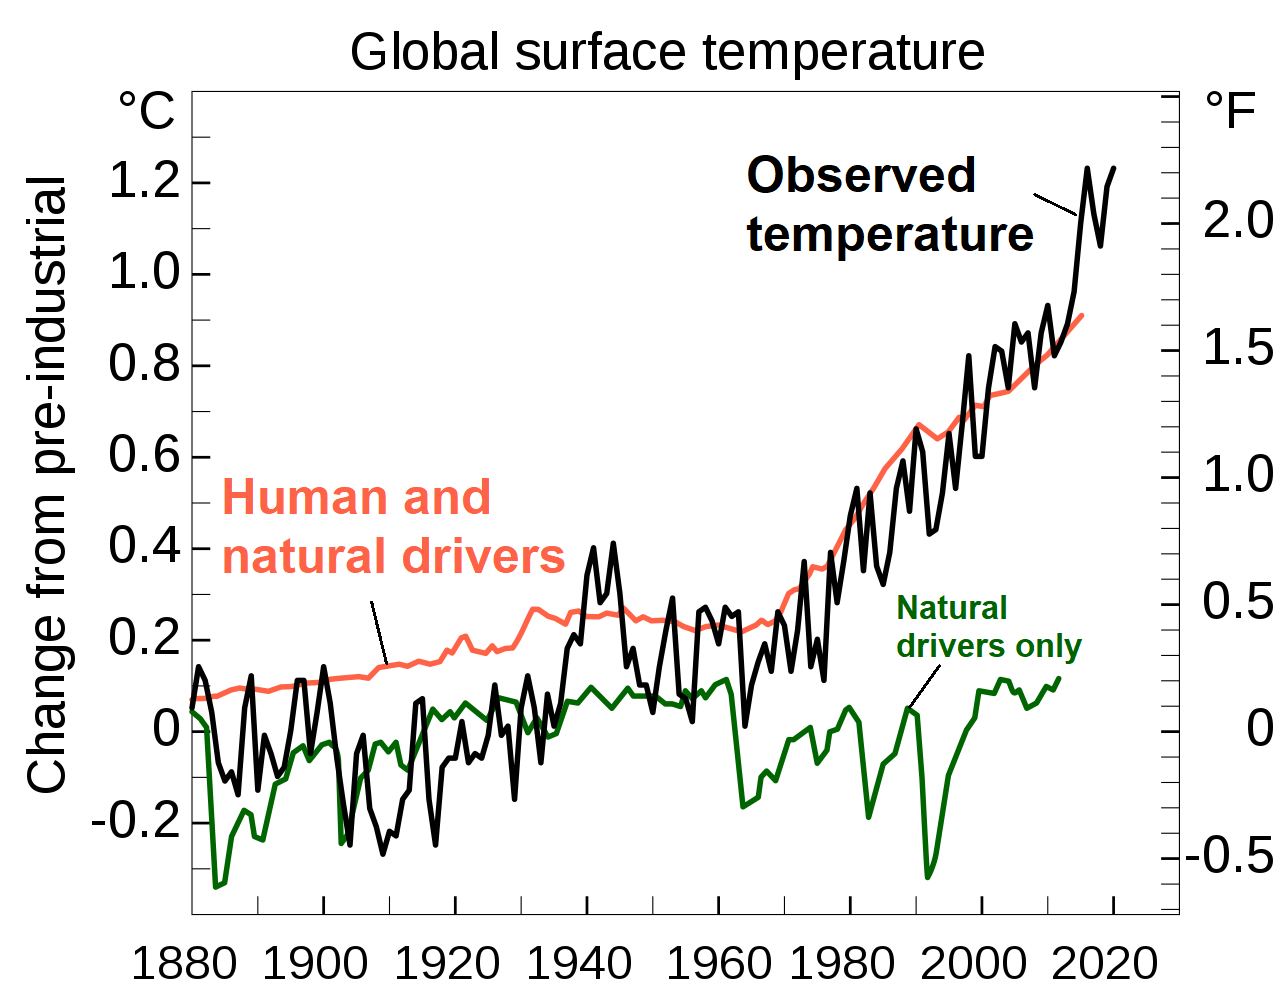
Climate varies naturally over a wide range of time scales. In general, climate changes prior to the Industrial Revolution in the 1700s can be explained by natural causes, such as changes in solar energy, volcanic eruptions, and natural changes in greenhouse gas (GHG) concentrations. Recent changes in climate, however, cannot be explained by natural causes alone. Research indicates that natural causes are very unlikely to explain most observed warming, especially warming since the mid-20th century. Rather, human activities, especially our combustion of fossil fuels, explains the current warming (Figure \(\PageIndex{3}\)). The scientific consensus is clear: through alterations of the carbon cycle, humans are changing the global climate by increasing the effects of something known as the greenhouse effect.
Climate change forecasting is famously complex, with a great amount of uncertainty attached to the task. The general models used for climate change forecasting need to account for a great number of highly variable components, each affecting one another across the only planet we can adequately measure or examine (we have no other planet where we can test predictions). Among thousands of considerations, climatologists, scientists who study climate, need to account for how human activities might change over time, and how these activities will change the atmosphere’s composition. They also need to account for how much CO2 the world’s oceans and plants will absorb, and how wind and fire might influence these processes. Combining all the component parts, climatologists then need to estimate how increased temperatures will affect the polar ice caps, how the melting ice will affect oceanic conditions and currents which, in turn, will affect terrestrial conditions and weather patterns. Uncertainty also exists over interactive effects of some drivers. For example, higher temperatures increase evaporation and cloud cover which, in turn, will have a moderate cooling effect. Because of the complexity of these and other variables going into climate models, a great number of research groups are encouraged to develop their own climate forecasts, each using a range of different scenarios on how human activity might change in the future.
By regularly doing extensive reviews of all the evidence and climate science literature, the IPCC has found that, despite the complexity of climate models, results of all the models taken together exhibited significant agreement with changes already observed. Climate change models have also proven reliable in predicting responses of biodiversity to climate change. While climatologists continue to improve on the finer details of their models, conservation biologists can and should confidently use the climate forecasts available for general conservation planning purposes.
So, why is there still doubt among the general public? The largest reason: various entities and industries have a vested interest in not changing the status quo - they make a great deal of money off of fossil fuels and other polluting industries and so pay to keep doubt about climate change in the public sphere. Find out more in this award-winning Frontline investigation from 2012:
Specific Human Impacts on Greenhouse Gases
Recall that GHGs are probably the most significant drivers of current climate change. The GHGs that affect Earth include carbon dioxide, methane, water vapor, nitrous oxide, and ozone. Water vapor is the most abundant greenhouse gas and also the most important in terms of its contribution to the natural greenhouse effect, despite having a short atmospheric lifetime. Some human activities can influence local water vapor levels. However, on a global scale, the concentration of water vapor is controlled by temperature, which influences overall rates of evaporation and precipitation. Therefore, the global concentration of water vapor is not substantially affected by direct human emissions.
Sinks and Sources
Places in the ecosystem that store GHGs are reservoirs. Places that supply and remove are sources and sinks, respectively. If more GHGs are released than stored, the place is a source. If more GHGs are absorbed than emitted, the reservoir is a sink. A reservoir can change from a sink to a source and vice versa. For example, a forest is a sink for carbon, but when the forest burns it becomes a carbon source.
Carbon Dioxide
Carbon dioxide (CO2) is the primary greenhouse gas that is contributing to recent global climate change. Healthy living forests and the oceans act as carbon sinks. The mantle is a natural source of carbon from volcanic gases. The link between human-induced climate change and atmospheric CO2 concentrations was first highlighted in the late 19th century by Arrhenius. However, it was not until the mid-1950s that scientists started to raise concerns about increasing CO2 concentrations in the atmosphere. By the 1980s, as global annual mean temperatures started to rise, consensus about climate change linked to CO2 began to spread among the broader public. Yet concrete steps to curb CO2 emissions have only been initiated recently.
In the meantime, CO2 emissions continue to accelerate: more than 37 billion tonnes of carbon, a new record, were released into the atmosphere in 2018. CO2 is a natural component of the carbon cycle, involved in such activities as photosynthesis, respiration, volcanic eruptions, and ocean-atmosphere exchange. Human activities, primarily the burning of fossil fuels, deforestation, and changes in land use, release very large amounts of CO2 to the atmosphere, causing its concentration in the atmosphere to rise, where each molecule may remain for more than 200 years. Cement manufacture, animal agriculture, the clearing of land, and the burning of forests are other human activities that release carbon dioxide.
Scientists look at patterns in data and try to explain differences or deviations from these patterns. As stated in Unit 5.3.1, the atmospheric carbon dioxide data reveal a historical pattern of carbon dioxide increasing and decreasing, cycling between a low of 180 ppm and a high of 300 ppm (Figure \(\PageIndex{4}\)). Scientists have concluded that it took around 50,000 years for the atmospheric carbon dioxide level to increase from its low minimum concentration to its higher maximum concentration. However, starting recently, atmospheric carbon dioxide concentrations have increased beyond the historical maximum of 300 ppm. Atmospheric CO2 concentrations have increased by 45% since pre-industrial times, from approximately 280 parts per million (ppm) in the 18th century to 415 ppm in 2021. What is the reason for this difference in the rate of change and the amount of increase in carbon dioxide? A key factor that must be recognized when comparing the historical data and the current data is the presence of modern human society; no other driver of climate change has yielded changes in atmospheric carbon dioxide levels at this rate or to this magnitude.
This 4-minute animation describes the natural carbon cycle and how humans are disrupting that cycle.
Question after watching: Which of the technologies to remove carbon from the atmosphere have you heard of before? Which have you not? What do these technologies do?
How long does a molecule of CO2 remain in the atmosphere?
- CO2 washes out of the atmosphere seasonally.
- CO2 remains in the atmosphere for 5-10 years.
- CO2 remains in the atmosphere for up to 200 years, or more.
- Answer
-
C. CO2 remains in the atmosphere for up to 200 years, or more.
What is the primary cause of the overall rising trend in CO2 in the atmosphere?
- The increase in CO2 is caused by burning of fossil fuels.
- CO2 is increasing because we are coming out of an ice age.
- As human population grows, people exhale more CO2.
- CO2 is released by the oceans as they warm.
- Answer
-
A. The increase in CO2 is caused by burning of fossil fuels.
Earth’s atmosphere naturally contains greenhouse gases. Without them, the world would be way too cold for humans. But we are adding extra greenhouse gases, which are causing Earth to heat up and disrupting weather patterns worldwide. So which of these many gases is heating Earth the most?
Methane
Although this concentration is far less than that of CO2, methane (CH4) is 28 times as potent a greenhouse gas. Methane is produced when bacteria break down organic matter under anaerobic conditions and can be released due to natural or anthropogenic processes. Anaerobic conditions can happen when organic matter is trapped underwater (such as in rice paddies) or in the intestines of herbivores. Anthropogenic causes now account for 60% of total methane release. Examples include agriculture, fossil fuel extraction and transport, mining, landfill use, and burning of forests. Methane can also be released from natural gas fields and the decomposition that occurs in landfills. Specifically, raising cattle releases methane due to fermentation in their rumens producing methane that is expelled from their GI tract. Methane is more abundant in Earth’s atmosphere now than at any time in at least the past 650,000 years, and CH4 concentrations increased sharply during most of the 20th century. They are now more than 2.5 times pre-industrial levels and increasing rapidly.
Another source of methane is the melting of clathrates (methane hydrate). Clathrates are frozen chunks of methane hydrate found at the bottom of the ocean. When water warms these chunks of ice melt and methane is released. As the ocean’s water temperature increases, the rate at which clathrates melt is increasing, releasing even more methane. This leads to increased levels of methane in the atmosphere, which further accelerates the rate of global warming. This is an example of the positive feedback loop that is leading to the rapid rate of increase in global temperatures. There is strong evidence that warming during the Quaternary period 55 million years ago was caused, at least in part, by a massive release of clathrates.
This 2-minute, 3D volumetric visualization shows the emission and transport of atmospheric methane around the globe between December 9, 2017 and December 1, 2018. (NASA)
Question after watching: What patterns do you notice based on the narrator's descriptions and the visualization?
Beef production emits more greenhouse gases than basically anything else we eat, so let’s look at the scale and impact of our bovine pals - and importantly, what we can actually do to make beef less bad.
Other Greenhouse Gases
Nitrous oxide (N2O) is produced through natural and human activities, mainly through agricultural activities and natural biological processes. Fuel-burning and some other processes also create N2O. Concentrations of N2O have risen approximately 18% since the start of the Industrial Revolution, with a relatively rapid increase towards the end of the 20th century. [3] In contrast, the atmospheric concentration of N2O varied only slightly for a period of 11,500 years before the onset of the industrial period, as shown by ice core samples.
Ground-level ozone (O3), which also has a short atmospheric lifetime, is a potent greenhouse gas. Chemical reactions create ozone from emissions of nitrogen oxides and volatile organic compounds from automobiles, power plants, and other industrial and commercial sources in the presence of sunlight. In addition to trapping heat, ozone is a pollutant that can cause respiratory health problems and damage crops and ecosystems.
Chlorofluorocarbons (CFCs), hydrochlorofluorocarbons (HCFCs), hydrofluorocarbons (HFCs), perfluorocarbons (PFCs), and sulfur hexafluoride (SF6), together called F-gases, are often used in coolants, foaming agents, fire extinguishers, solvents, pesticides, and aerosol propellants. Unlike water vapor and ozone, these F-gases have a long atmospheric lifetime, and some of these emissions will affect the climate for many decades or centuries.
Human-Induced Changes in Albedo and Aerosols
When sunlight energy reaches Earth it can be reflected or absorbed. The amount that is reflected or absorbed depends on Earth’s surface and atmosphere. Light-colored objects and surfaces, like snow and clouds, tend to reflect most sunlight, while darker objects and surfaces, like the ocean and forests, tend to absorb more sunlight. The term albedo refers to the amount of solar radiation reflected from an object or surface, often expressed as a percentage. Earth as a whole has an albedo of about 30%, meaning that 70% of the sunlight that reaches the planet is absorbed. Sunlight that is absorbed warms Earth’s land, water, and atmosphere.
Albedo is also affected by aerosols. Aerosols are small particles or liquid droplets in the atmosphere that can absorb or reflect sunlight. Unlike greenhouse gases (GHGs), the climate effects of aerosols vary depending on what they are made of and where they are emitted. Those aerosols that reflect sunlight, such as particles from volcanic eruptions or sulfur emissions from burning coal, have a cooling effect. Those that absorb sunlight, such as black carbon (a part of soot), have a warming effect. In addition, human activities have generally increased the number of aerosol particles in the atmosphere. Overall, human-generated aerosols have a net cooling effect offsetting about one-third of the total warming effect associated with human greenhouse gas emissions. Reductions in overall aerosol emissions can therefore lead to more warming. However, targeted reductions in black carbon emissions can reduce warming.
Human changes in land use and land cover have changed Earth’s albedo. Processes such as deforestation, reforestation, desertification, and urbanization often contribute to changes in climate in the places they occur. These effects may be significant regionally but are smaller when averaged over the entire globe.
This 2-minute video visualizes albedo.
Question after watching: What are some human activities that change albedo as visualized in the video?
Climate Feedbacks
When sea ice melts, as it has done in the Arctic Ocean at a disturbing rate over the past decade, the albedo of the area affected changes dramatically, from around 80% down to less than 10%. This is a positive feedback (see a review of feedback loops in Unit 4.4.1) because much more solar energy is absorbed by the water than by the pre-existing ice, and the temperature increase is amplified. The same applies to ice and snow on land, but the difference in albedo is not as great.
When ice and snow on land melt, sea level rises. Sea level is also rising because the oceans are warming and that increases their volume. A higher sea level means a larger proportion of the planet is covered with water, and since water has a lower albedo than land, more heat is absorbed and the temperature goes up a little more. Since the last glaciation, sea-level rise has been about 125m; a huge area that used to be land is now flooded by heat-absorbent seawater. During the current period of anthropogenic climate change, sea level has risen only about 20 cm, and although that does not make a big change to albedo, sea-level rise is accelerating.
A warming Arctic can catapult the world into drastic climate impacts through feedback loops as seen in this 3.5-minute video.
Question after watching: Why should we be concerned with permafrost melting as well as ice in the Arctic?
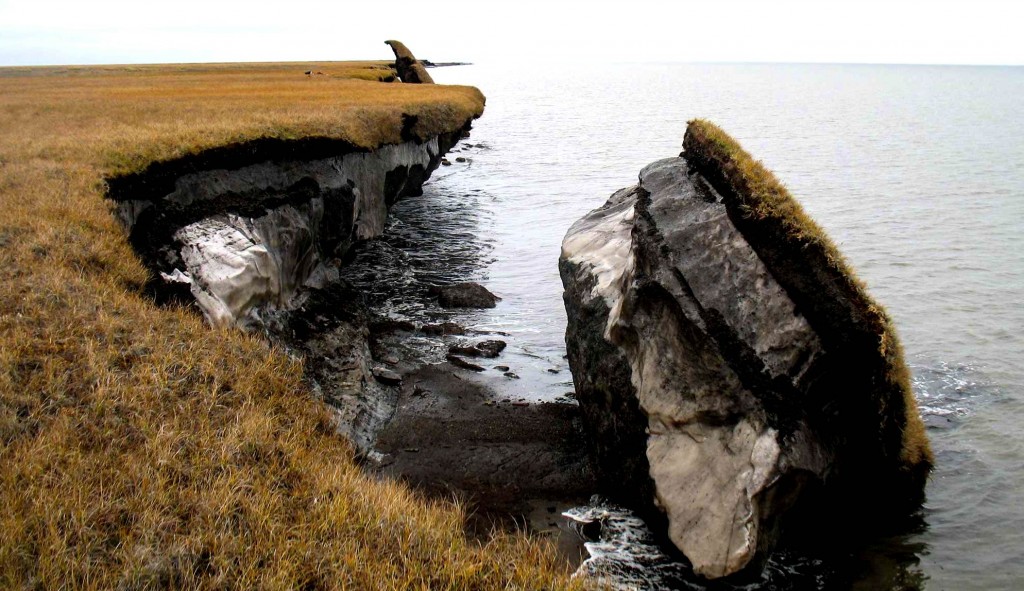
Most of northern Canada has a layer of permafrost that ranges from a few centimeters to hundreds of meters in thickness; the same applies in Alaska, Russia, and Scandinavia. Permafrost is a mixture of soil and ice (Figure \(\PageIndex{10}\)), and it also contains a significant amount of trapped organic carbon that is released as CO2 and CH4 when the permafrost breaks down. Because the amount of carbon stored in permafrost is in the same order of magnitude as the amount released by burning fossil fuels, this is a feedback mechanism that has the potential to equal or surpass the forcing that has unleashed it. In some polar regions, including northern Canada, permafrost also includes methane hydrate. Breakdown of permafrost releases this form of methane.
There is about 45 times as much carbon in the ocean (as dissolved bicarbonate) as there is in the atmosphere (as CO2), and there is a steady exchange of carbon between the two reservoirs. But the ability of CO2 to dissolve in water (its solubility) decreases as the temperature goes up. In other words, the warmer it gets, the more oceanic bicarbonate gets released to the atmosphere as CO2. That makes CO2 solubility another positive feedback mechanism.
Vegetation growth responds positively to both increased temperatures and elevated CO2 levels, and so in general, it represents negative feedback to climate change because the more the vegetation grows, the more CO2 is taken from the atmosphere. However, trees grow bigger and more vigorously so forests have lower albedo so they absorb more heat. In addition, climate change is not just more CO2, it may mean more or less rain, extreme weather events, or drastic seasonal changes that interfere with forest health. Furthermore, climate warming isn’t necessarily good for vegetation growth; some areas have become too hot, too dry, or even too wet to support the plant community that was growing there, and it might take centuries for something to replace it successfully.
All of these positive (and negative) feedbacks work both ways. For example, during climate cooling, growth of glaciers leads to higher albedos, and formation of permafrost results in storage of carbon that would otherwise have returned quickly to the atmosphere.
This 3.5-minute video describes climate tipping points.
Question after watching: What is meant by a "tipping point" for climate? What types of systemic changes are studied in terms of climate tipping points? Are these positive feedbacks or negative feedbacks?