6.1: Introduction to Climate Change
- Page ID
- 105344

\( \newcommand{\vecs}[1]{\overset { \scriptstyle \rightharpoonup} {\mathbf{#1}} } \)
\( \newcommand{\vecd}[1]{\overset{-\!-\!\rightharpoonup}{\vphantom{a}\smash {#1}}} \)
\( \newcommand{\dsum}{\displaystyle\sum\limits} \)
\( \newcommand{\dint}{\displaystyle\int\limits} \)
\( \newcommand{\dlim}{\displaystyle\lim\limits} \)
\( \newcommand{\id}{\mathrm{id}}\) \( \newcommand{\Span}{\mathrm{span}}\)
( \newcommand{\kernel}{\mathrm{null}\,}\) \( \newcommand{\range}{\mathrm{range}\,}\)
\( \newcommand{\RealPart}{\mathrm{Re}}\) \( \newcommand{\ImaginaryPart}{\mathrm{Im}}\)
\( \newcommand{\Argument}{\mathrm{Arg}}\) \( \newcommand{\norm}[1]{\| #1 \|}\)
\( \newcommand{\inner}[2]{\langle #1, #2 \rangle}\)
\( \newcommand{\Span}{\mathrm{span}}\)
\( \newcommand{\id}{\mathrm{id}}\)
\( \newcommand{\Span}{\mathrm{span}}\)
\( \newcommand{\kernel}{\mathrm{null}\,}\)
\( \newcommand{\range}{\mathrm{range}\,}\)
\( \newcommand{\RealPart}{\mathrm{Re}}\)
\( \newcommand{\ImaginaryPart}{\mathrm{Im}}\)
\( \newcommand{\Argument}{\mathrm{Arg}}\)
\( \newcommand{\norm}[1]{\| #1 \|}\)
\( \newcommand{\inner}[2]{\langle #1, #2 \rangle}\)
\( \newcommand{\Span}{\mathrm{span}}\) \( \newcommand{\AA}{\unicode[.8,0]{x212B}}\)
\( \newcommand{\vectorA}[1]{\vec{#1}} % arrow\)
\( \newcommand{\vectorAt}[1]{\vec{\text{#1}}} % arrow\)
\( \newcommand{\vectorB}[1]{\overset { \scriptstyle \rightharpoonup} {\mathbf{#1}} } \)
\( \newcommand{\vectorC}[1]{\textbf{#1}} \)
\( \newcommand{\vectorD}[1]{\overrightarrow{#1}} \)
\( \newcommand{\vectorDt}[1]{\overrightarrow{\text{#1}}} \)
\( \newcommand{\vectE}[1]{\overset{-\!-\!\rightharpoonup}{\vphantom{a}\smash{\mathbf {#1}}}} \)
\( \newcommand{\vecs}[1]{\overset { \scriptstyle \rightharpoonup} {\mathbf{#1}} } \)
\(\newcommand{\longvect}{\overrightarrow}\)
\( \newcommand{\vecd}[1]{\overset{-\!-\!\rightharpoonup}{\vphantom{a}\smash {#1}}} \)
\(\newcommand{\avec}{\mathbf a}\) \(\newcommand{\bvec}{\mathbf b}\) \(\newcommand{\cvec}{\mathbf c}\) \(\newcommand{\dvec}{\mathbf d}\) \(\newcommand{\dtil}{\widetilde{\mathbf d}}\) \(\newcommand{\evec}{\mathbf e}\) \(\newcommand{\fvec}{\mathbf f}\) \(\newcommand{\nvec}{\mathbf n}\) \(\newcommand{\pvec}{\mathbf p}\) \(\newcommand{\qvec}{\mathbf q}\) \(\newcommand{\svec}{\mathbf s}\) \(\newcommand{\tvec}{\mathbf t}\) \(\newcommand{\uvec}{\mathbf u}\) \(\newcommand{\vvec}{\mathbf v}\) \(\newcommand{\wvec}{\mathbf w}\) \(\newcommand{\xvec}{\mathbf x}\) \(\newcommand{\yvec}{\mathbf y}\) \(\newcommand{\zvec}{\mathbf z}\) \(\newcommand{\rvec}{\mathbf r}\) \(\newcommand{\mvec}{\mathbf m}\) \(\newcommand{\zerovec}{\mathbf 0}\) \(\newcommand{\onevec}{\mathbf 1}\) \(\newcommand{\real}{\mathbb R}\) \(\newcommand{\twovec}[2]{\left[\begin{array}{r}#1 \\ #2 \end{array}\right]}\) \(\newcommand{\ctwovec}[2]{\left[\begin{array}{c}#1 \\ #2 \end{array}\right]}\) \(\newcommand{\threevec}[3]{\left[\begin{array}{r}#1 \\ #2 \\ #3 \end{array}\right]}\) \(\newcommand{\cthreevec}[3]{\left[\begin{array}{c}#1 \\ #2 \\ #3 \end{array}\right]}\) \(\newcommand{\fourvec}[4]{\left[\begin{array}{r}#1 \\ #2 \\ #3 \\ #4 \end{array}\right]}\) \(\newcommand{\cfourvec}[4]{\left[\begin{array}{c}#1 \\ #2 \\ #3 \\ #4 \end{array}\right]}\) \(\newcommand{\fivevec}[5]{\left[\begin{array}{r}#1 \\ #2 \\ #3 \\ #4 \\ #5 \\ \end{array}\right]}\) \(\newcommand{\cfivevec}[5]{\left[\begin{array}{c}#1 \\ #2 \\ #3 \\ #4 \\ #5 \\ \end{array}\right]}\) \(\newcommand{\mattwo}[4]{\left[\begin{array}{rr}#1 \amp #2 \\ #3 \amp #4 \\ \end{array}\right]}\) \(\newcommand{\laspan}[1]{\text{Span}\{#1\}}\) \(\newcommand{\bcal}{\cal B}\) \(\newcommand{\ccal}{\cal C}\) \(\newcommand{\scal}{\cal S}\) \(\newcommand{\wcal}{\cal W}\) \(\newcommand{\ecal}{\cal E}\) \(\newcommand{\coords}[2]{\left\{#1\right\}_{#2}}\) \(\newcommand{\gray}[1]{\color{gray}{#1}}\) \(\newcommand{\lgray}[1]{\color{lightgray}{#1}}\) \(\newcommand{\rank}{\operatorname{rank}}\) \(\newcommand{\row}{\text{Row}}\) \(\newcommand{\col}{\text{Col}}\) \(\renewcommand{\row}{\text{Row}}\) \(\newcommand{\nul}{\text{Nul}}\) \(\newcommand{\var}{\text{Var}}\) \(\newcommand{\corr}{\text{corr}}\) \(\newcommand{\len}[1]{\left|#1\right|}\) \(\newcommand{\bbar}{\overline{\bvec}}\) \(\newcommand{\bhat}{\widehat{\bvec}}\) \(\newcommand{\bperp}{\bvec^\perp}\) \(\newcommand{\xhat}{\widehat{\xvec}}\) \(\newcommand{\vhat}{\widehat{\vvec}}\) \(\newcommand{\uhat}{\widehat{\uvec}}\) \(\newcommand{\what}{\widehat{\wvec}}\) \(\newcommand{\Sighat}{\widehat{\Sigma}}\) \(\newcommand{\lt}{<}\) \(\newcommand{\gt}{>}\) \(\newcommand{\amp}{&}\) \(\definecolor{fillinmathshade}{gray}{0.9}\)Introduction to Climate Change
- Please read and watch the following Learning Resources
- Reading the material for understanding, and taking notes during videos, will take approximately 1 hour.
- Optional Activities are embedded.
- To navigate to the next section, use the Contents menu at the top of the page OR the right arrow on the side of the page.
- If on a mobile device, use the Contents menu at the top of the page OR the links at the bottom of the page.
- Define global climate change
- Summarize the effects of the Industrial Revolution on global atmospheric carbon dioxide concentration
- Describe three natural factors affecting long-term global climate
- List two or more greenhouse gases and describe their role in the greenhouse effect
Introduction
Remember from Unit 4 that all biomes are universally affected by global conditions, such as climate. These conditions ultimately shape each biome’s environment. Scientists who study climate have noted a series of marked changes that have become increasingly evident over the last 70 years.
Climate change refers to the complete set of climate characteristics—temperature, precipitation, pressure systems, wind patterns, and oceanic currents—changing locally, regionally, and globally over time due to human influences.
It is closely related to global warming, also called global heating, which describes the general trend of increasing global temperatures we see under climate change. However, climate change includes all of the effects of a warming planet, not just rising global temperatures, and is a more appropriate term for what this Unit examines.
Climate and Weather
A common misconception about global climate change is that a specific weather event occurring in a particular region (for example, a very cool week in June in central Nebraska) is evidence of global climate change. However, a cold week in June in Nebraska is a weather-related event and not a climate-related one. If the trend in summer temperatures in Nebraska indicated cooling over time, that would mean it was a change in climate.
These misconceptions often arise because of confusion over the terms climate and weather.
Discover the real reason we confuse weather and climate in this 5-minute video from Hot Mess (US PBS).
Question after watching: How does our personal experience of weather have an effect on how we view climate change?
Climate refers to the long-term, predictable atmospheric conditions of a specific area. A biome's climate is characterized by consistent temperature and annual rainfall ranges. Climate does not address the amount of rain that fell on one particular day in a biome or the colder-than-average temperatures that occurred one season.
In contrast, weather refers to the conditions of the atmosphere during a short period of time. Weather forecasts are usually made for 48-hour cycles. Long-range weather forecasts are available but can be unreliable.
To better understand the difference between climate and weather, imagine that you are planning an outdoor event in Boston, MA. You would be thinking about climate when you plan the event in the summer rather than the winter because you have long-term knowledge that any Saturday in May through August would be a better choice for an outdoor event in Boston than a Saturday in January. However, you cannot determine the specific day on which that event should be held because it is difficult to accurately predict the weather. Climate can be considered “average” weather.
Global Climate Change
Climate change can be understood through three areas of study:
- current and past global climate change
- causes of past and present-day global climate change
- ancient and current results of climate change
When reading or viewing media about global climate change, it is helpful to clearly separate these three aspects of climate change.
Standard climate change reporting often confuses the data and suffers from a misguided approach of presenting "both sides" as equally valid. While balanced reporting is appropriate for political and economic topics, it is misleading in scientific contexts. Traditional media (cable news, newspapers, official news social media, etc.) frequently provide climate change skeptics a platform whose views do not align with scientific consensus. Social media influencers make this even worse.
Pseudoscience, misinformation, and/or disinformation practices create confusion and allow personal opinions to be valued and legitimized on the same level as the scientific consensus.
- Misinformation is false or inaccurate information—getting the facts wrong.
- Disinformation is false information that is deliberately intended to mislead, intentionally misstating the facts.
By presenting these unsubstantiated opinions alongside scientific research, these practices undermine the integrity of climate science.
As you learned in Unit 1, scientific theories are based on evidence, not opinion, and require rigorous peer review to be considered credible.
The Greenhouse Effect
When heat energy from the sun strikes the Earth, greenhouse gases (carbon dioxide, methane, water vapor, nitrous oxide, and chlorofluorocarbons (CFCs)) trap the heat in the atmosphere, just as the glass panes of a greenhouse keep heat from escaping.
Approximately half of the sun's radiation passes through these gases in the atmosphere and strikes the Earth. This radiation is converted into thermal (heat) radiation on the Earth’s surface, and a portion of the thermal energy is re-radiated back into the atmosphere.
Greenhouse gases, however, reflect much of the thermal energy back to the Earth’s surface. The more greenhouse gases in the atmosphere, the more thermal energy is reflected back to the Earth’s surface. Greenhouse gases absorb and emit radiation and are an important factor in the greenhouse effect, the warming of Earth due to carbon dioxide and other greenhouse gases in the atmosphere. Without the greenhouse effect, Earth would be a cold planet like Mars. However, too much of a greenhouse effect causes surface and ocean temperatures that many organisms are not adapted to.
Discover the intricacies of Earth's greenhouse effect in this 3-minute video.
Question after watching: How do the so-called greenhouse gases act to insulate the Earth? Why do more greenhouse gases lead to a warmer planet?
What is the greenhouse effect?
- Certain gases in the atmosphere trap heat and warm the Earth
- Life on Earth 'exhales' gas that warms up the atmosphere
- The tilt of the Earth changes the amount of solar energy the Earth receives
- The Sun is putting out more radiant energy over time
- Answer
-
A. Certain gases in the atmosphere trap heat and warm the Earth.
Evidence for Past Global Climate Change
Since scientists cannot go back in time to directly measure climatic variables, such as average temperature and precipitation, they must instead indirectly measure temperature. To do this, scientists rely on historical evidence of Earth’s past climate. Indirect evidence includes data from boreholes (a narrow shaft bored into the ground), tree rings, glacier lengths, pollen remains, and ocean sediments.
The primary sources of evidence, however, are ice cores. Ice cores are samples of ice from ice sheets or high mountain glaciers. In 2025, the deepest core was drilled yet: nearly 2 miles. The ice cores are like traveling backwards through time; the deeper the sample, the earlier the time period. This 2025 core is providing 1.2 million years of trapped bubbles of air and other biological evidence that can reveal temperature and carbon dioxide (CO2) data.
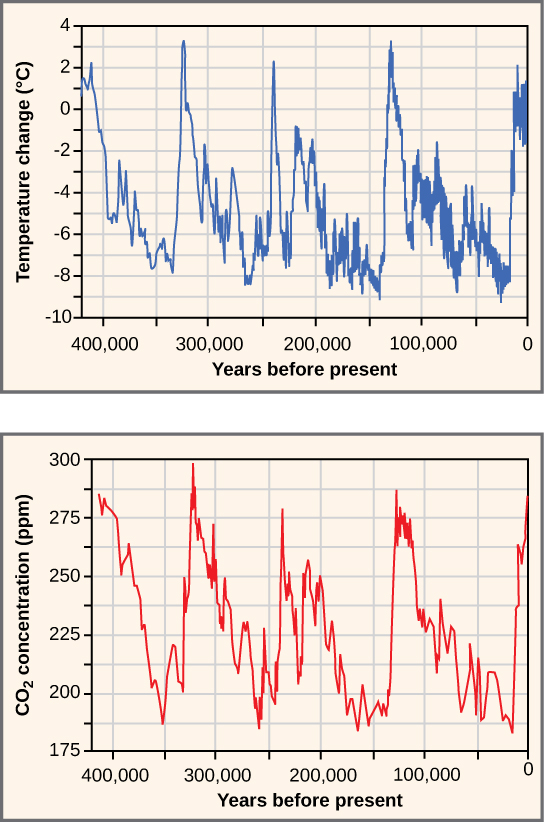
The most famous ice core is the Vostok core from Antarctica that provided evidence from the last 400,000 years (Figure \(\PageIndex{1}\)a). The 0°C on this graph refers to the long-term, modern-day average. Temperatures that are greater than 0°C exceed Earth’s long-term average temperature. Conversely, temperatures that are less than 0°C are less than Earth’s average temperature. This figure shows that there have been increasing and decreasing temperatures over approximately 100,000-year cycles.
When thinking about past climates, it is important to keep scales in mind.
Time:
In the distant past, the Earth was as much as 9°C/16°F cooler and as much as 3°C/5.4°F warmer, and most of the past 400,000 years have been colder than today. Most of the past warming and cooling periods happened over long enough time scales (tens of thousands to millions of years) that the majority of organisms were able to adapt and evolve with the changing climate. Agriculture and permanent settlements have developed during a relatively stable climate over the last 10,000 years, which was very fortunate for humans.
However, current climate changes have happened within the last 100 years, much too rapidly for many organisms to adapt, and faster than in the last 1.2 million years.
Greenhouse Gas Concentrations:
The graph in Figure \(\PageIndex{1}\)b shows that the atmospheric concentration of carbon dioxide has also risen and fallen in periodic cycles over ~100,000-year cycles. Figure \(\PageIndex{1}\)b shows that CO2 levels in the atmosphere have historically cycled between 180 and 300 parts per million (ppm) by volume.
Notice the relationship between temperature (Figure \(\PageIndex{1}\)a) and carbon dioxide concentrations (Figure \(\PageIndex{1}\)b). Simply, the greater the greenhouse gas concentration (in this case, CO2), the higher the temperatures. This is followed by a cooling phase after CO2 concentrations reach ~300 ppm.
Recent Climate Variability
Figure \(\PageIndex{1}\) does not show the last 2,000 years with enough detail to compare the changes in Earth’s temperature during the last 400,000 years with the temperature change that has occurred in the more recent past. Three significant temperature anomalies, or irregularities, have occurred in the last 2000 years. The first two are the Medieval Climate Anomaly (or the Medieval Warm Period) and the Little Ice Age. A third temperature anomaly aligns with the Industrial Era.
The Medieval Climate Anomaly occurred between 900 and 1300 of the Current Era (CE). During this time period, many climate scientists think that slightly warmer weather conditions prevailed in many parts of the world; the higher-than-average temperature changes varied between 0.10 °C and 0.20 °C above normal. Although 0.10°C/0.18oF does not seem large enough to produce any noticeable change, it did free seas of ice. Remember, these temperatures are global averages. Some areas became much warmer, especially at higher latitudes, and some areas remained at their same averages. Because of the warming in the higher latitudes and lack of sea ice, the Vikings were able to colonize Greenland.
The Little Ice Age was a cold period that occurred between 1550 AD and 1850 CE. During this time, a slight cooling of a little less than 1°C/~2oF was observed in North America, Europe, and possibly other areas of the Earth. This 1°C change in global temperature is a seemingly small deviation in temperature (as was observed during the Medieval Climate Anomaly); however, it also resulted in noticeable changes. Historical accounts reveal a time of exceptionally harsh winters with much snow and frost. These years have been immortalized in the art of Europe and colonial America, including works by Vermeer.
The Industrial Revolution/Era, which began around 1750, was characterized by changes in much of human society. Advances in agriculture increased the food supply, which improved the standard of living for people in Europe and North America. New technologies were invented and provided jobs and cheaper goods. These new technologies were powered by fossil fuels, especially coal. When a fossil fuel (coal, oil, or natural gas) is burned, CO2 is released. With the Industrial Revolution, atmospheric CO2 began to rise noticeably by the mid-1800s (Figure \(\PageIndex{2}\)) and is currently at 427 ppm and rising (as compared to the average maximum of 300 ppm in the past)
The resulting rise in global temperatures has happened within the last 150 years, much too rapidly for many organisms to adapt, and faster than in the last 1.2 million years.

Causes of Past Climate Change
Data from the scientific evidence above indicates a strong correlation between the timing of temperature changes and drivers, or causes, of climate change. Before the Industrial Revolution/Era (pre-1780), there were three primary drivers of climate change not related to human activity.
- Milankovitch cycles. Milankovitch cycles describe the effects of slight changes in the Earth’s orbit on Earth’s climate and range between 19,000 and 100,000 years. In other words, scientists expect to see predictable changes in the Earth’s climate associated with changes in the Earth’s orbit within this range in the indirect evidence they gather. Note that the cycles in Figure \(\PageIndex{1}\) are approximately 100,000 years long!
- Solar intensity: Variation in solar (the sun’s) intensity is the second natural factor responsible for climate change. The amount of solar power or energy the sun emits in a given amount of time directly impacts Earth's temperature. As solar intensity increases (or decreases), the Earth’s temperature correspondingly increases (or decreases). Changes in solar intensity have been proposed as one of several possible explanations for the Little Ice Age.
- Volcanic eruptions: Volcanic eruptions generally last only a few days, but the solids and gases released can influence the climate for years, causing short-term climate changes. The gases and solids released include greenhouse gases and aerosols, among others. Generally, volcanic eruptions cool the climate due to the immense amount of aerosols, water vapor, and other gases that reflect light back into space. In 1783, Icelandic volcanoes erupted and released large volumes of sulfuric oxide. This led to haze-effect cooling, a global phenomenon that occurs when dust, ash, or other suspended particles block out sunlight and trigger lower global temperatures for 1+ years. In Europe and North America, haze-effect cooling produced some of the lowest average winter temperatures on record in 1783 and 1784. It is thought that increased global eruptions and decreased solar intensity may have been the drivers of the Little Ice Age.
Results of Past Climate Change
Climate change is not a new phenomenon. Scientists have geological evidence of the consequences of long-ago climate change. Increased global temperatures and greenhouse gases have been associated with at least one planet-wide extinction event during the geological past. The Permian extinction event occurred about 251 million years ago toward the end of the roughly 50-million-year-long geological time span known as the Permian period. This geologic time period was one of the three warmest periods in Earth’s geologic history. Scientists estimate that more than 90 percent of all life became extinct near the end of the Permian period. Organisms that had adapted to wet and warm climatic conditions, such as annual rainfall of 300–400 cm and 20 °C–30 °C in the tropical wet forest, may not have been able to survive the Permian climate change.
During the past 2 million years, there have been at least 10 cycles of natural warming and cooling on a planetary scale. When the polar ice caps melted during warming periods, sea levels rose to well above their earlier levels, and a larger portion of Earth experienced tropical climates. During cooling periods, the polar ice caps expanded, sea levels dropped, and tropical species’ ranges contracted. Sometimes these changes occurred gradually, which enabled the affected species to adapt. But the onset of some climate change periods was abrupt, causing major ecosystem disruptions and global mass extinction events. Yet, nature recovered every time; many of the species we see today are survivors of previous climate change events. It is thus fair to ask why today’s climate change is of such concern to us.
A look at the history of climate change on Earth can give us some much-needed perspective on our current climate dilemma because, the surprising truth is, what we are experiencing now is different than anything this planet has encountered before. This 11-minute video gives an overview of Earth's prior climates.
Question after watching: In what way is the current climate change different than historical climate changes?
Climate Change’s Impact on Humans (Past and Present)
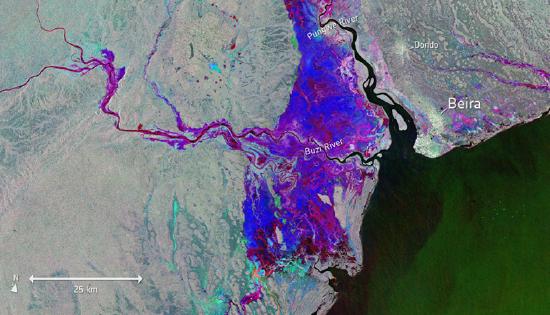
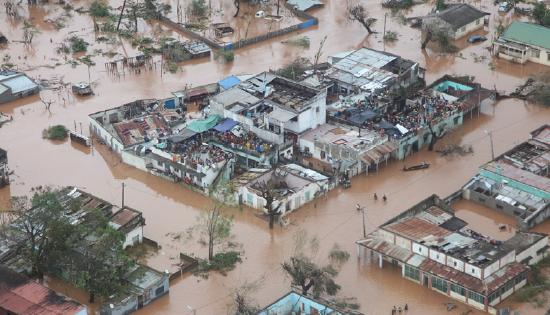
History provides us with many lessons to illustrate the impact of climate change on human societies. These lessons start with the earliest well-documented example of a societal collapse—that of the Middle East’s Natufian communities roughly 10,000 years ago—which has been attributed to climatic changes. Since then, climate change has regularly contributed to the collapse of complex human societies across the world. Notable examples of such collapses include the Akkadian Empire (the world’s first empire) of the Middle East, Egypt’s Old Kingdom (the builders of the pyramids), Central America’s Classic Mayan civilization, the first English colony in America, several Chinese dynasties, and the Late Bronze Age societies along the Mediterranean Sea. Also, in Southern Africa, the fall of the Mapungubwe Kingdom has been attributed to crop failures and declining grazing lands due to regional droughts and warming cycles.
Similar patterns hold true today, only on a global scale. Because of humans' collective lack of response in addressing the drivers of climate change, more people will suffer the consequences than will not. Prominently, many parts of the world are already seeing higher temperatures and longer droughts. These conditions are compromising our quality of life by leading to more intense wildfires, increased incidences of vector-borne disease, increased crop failures, and increased competition for water. Many coastal areas are also seeing storms increasing in intensity and frequency, exposing people living near large rivers, deltas, and estuaries to more frequent flooding and storm surges. For example, the impacts from Cyclone Idai, one of the worst storms on record to have hit Africa, led to the deaths of more than 1,000 people (Figure \(\PageIndex{3}\)). While no single flooding event can be attributed to climate change, it is undeniable that warmer oceans create conditions for hurricanes and cyclones to be stronger, bigger, and more frequent. Sea level rise is expected to leave many low-lying oceanic islands uninhabitable within a few decades. With all these impacts expected to increase the competition for space under an increasing human population, it would be wise for the world’s governments to start preparing for millions of climate refugees that need to be relocated soon.