
Investigation: Properties of Water with Stats
- Page ID
- 26994
This page is a draft and is under active development.
\( \newcommand{\vecs}[1]{\overset { \scriptstyle \rightharpoonup} {\mathbf{#1}} } \)
\( \newcommand{\vecd}[1]{\overset{-\!-\!\rightharpoonup}{\vphantom{a}\smash {#1}}} \)
\( \newcommand{\dsum}{\displaystyle\sum\limits} \)
\( \newcommand{\dint}{\displaystyle\int\limits} \)
\( \newcommand{\dlim}{\displaystyle\lim\limits} \)
\( \newcommand{\id}{\mathrm{id}}\) \( \newcommand{\Span}{\mathrm{span}}\)
( \newcommand{\kernel}{\mathrm{null}\,}\) \( \newcommand{\range}{\mathrm{range}\,}\)
\( \newcommand{\RealPart}{\mathrm{Re}}\) \( \newcommand{\ImaginaryPart}{\mathrm{Im}}\)
\( \newcommand{\Argument}{\mathrm{Arg}}\) \( \newcommand{\norm}[1]{\| #1 \|}\)
\( \newcommand{\inner}[2]{\langle #1, #2 \rangle}\)
\( \newcommand{\Span}{\mathrm{span}}\)
\( \newcommand{\id}{\mathrm{id}}\)
\( \newcommand{\Span}{\mathrm{span}}\)
\( \newcommand{\kernel}{\mathrm{null}\,}\)
\( \newcommand{\range}{\mathrm{range}\,}\)
\( \newcommand{\RealPart}{\mathrm{Re}}\)
\( \newcommand{\ImaginaryPart}{\mathrm{Im}}\)
\( \newcommand{\Argument}{\mathrm{Arg}}\)
\( \newcommand{\norm}[1]{\| #1 \|}\)
\( \newcommand{\inner}[2]{\langle #1, #2 \rangle}\)
\( \newcommand{\Span}{\mathrm{span}}\) \( \newcommand{\AA}{\unicode[.8,0]{x212B}}\)
\( \newcommand{\vectorA}[1]{\vec{#1}} % arrow\)
\( \newcommand{\vectorAt}[1]{\vec{\text{#1}}} % arrow\)
\( \newcommand{\vectorB}[1]{\overset { \scriptstyle \rightharpoonup} {\mathbf{#1}} } \)
\( \newcommand{\vectorC}[1]{\textbf{#1}} \)
\( \newcommand{\vectorD}[1]{\overrightarrow{#1}} \)
\( \newcommand{\vectorDt}[1]{\overrightarrow{\text{#1}}} \)
\( \newcommand{\vectE}[1]{\overset{-\!-\!\rightharpoonup}{\vphantom{a}\smash{\mathbf {#1}}}} \)
\( \newcommand{\vecs}[1]{\overset { \scriptstyle \rightharpoonup} {\mathbf{#1}} } \)
\(\newcommand{\longvect}{\overrightarrow}\)
\( \newcommand{\vecd}[1]{\overset{-\!-\!\rightharpoonup}{\vphantom{a}\smash {#1}}} \)
\(\newcommand{\avec}{\mathbf a}\) \(\newcommand{\bvec}{\mathbf b}\) \(\newcommand{\cvec}{\mathbf c}\) \(\newcommand{\dvec}{\mathbf d}\) \(\newcommand{\dtil}{\widetilde{\mathbf d}}\) \(\newcommand{\evec}{\mathbf e}\) \(\newcommand{\fvec}{\mathbf f}\) \(\newcommand{\nvec}{\mathbf n}\) \(\newcommand{\pvec}{\mathbf p}\) \(\newcommand{\qvec}{\mathbf q}\) \(\newcommand{\svec}{\mathbf s}\) \(\newcommand{\tvec}{\mathbf t}\) \(\newcommand{\uvec}{\mathbf u}\) \(\newcommand{\vvec}{\mathbf v}\) \(\newcommand{\wvec}{\mathbf w}\) \(\newcommand{\xvec}{\mathbf x}\) \(\newcommand{\yvec}{\mathbf y}\) \(\newcommand{\zvec}{\mathbf z}\) \(\newcommand{\rvec}{\mathbf r}\) \(\newcommand{\mvec}{\mathbf m}\) \(\newcommand{\zerovec}{\mathbf 0}\) \(\newcommand{\onevec}{\mathbf 1}\) \(\newcommand{\real}{\mathbb R}\) \(\newcommand{\twovec}[2]{\left[\begin{array}{r}#1 \\ #2 \end{array}\right]}\) \(\newcommand{\ctwovec}[2]{\left[\begin{array}{c}#1 \\ #2 \end{array}\right]}\) \(\newcommand{\threevec}[3]{\left[\begin{array}{r}#1 \\ #2 \\ #3 \end{array}\right]}\) \(\newcommand{\cthreevec}[3]{\left[\begin{array}{c}#1 \\ #2 \\ #3 \end{array}\right]}\) \(\newcommand{\fourvec}[4]{\left[\begin{array}{r}#1 \\ #2 \\ #3 \\ #4 \end{array}\right]}\) \(\newcommand{\cfourvec}[4]{\left[\begin{array}{c}#1 \\ #2 \\ #3 \\ #4 \end{array}\right]}\) \(\newcommand{\fivevec}[5]{\left[\begin{array}{r}#1 \\ #2 \\ #3 \\ #4 \\ #5 \\ \end{array}\right]}\) \(\newcommand{\cfivevec}[5]{\left[\begin{array}{c}#1 \\ #2 \\ #3 \\ #4 \\ #5 \\ \end{array}\right]}\) \(\newcommand{\mattwo}[4]{\left[\begin{array}{rr}#1 \amp #2 \\ #3 \amp #4 \\ \end{array}\right]}\) \(\newcommand{\laspan}[1]{\text{Span}\{#1\}}\) \(\newcommand{\bcal}{\cal B}\) \(\newcommand{\ccal}{\cal C}\) \(\newcommand{\scal}{\cal S}\) \(\newcommand{\wcal}{\cal W}\) \(\newcommand{\ecal}{\cal E}\) \(\newcommand{\coords}[2]{\left\{#1\right\}_{#2}}\) \(\newcommand{\gray}[1]{\color{gray}{#1}}\) \(\newcommand{\lgray}[1]{\color{lightgray}{#1}}\) \(\newcommand{\rank}{\operatorname{rank}}\) \(\newcommand{\row}{\text{Row}}\) \(\newcommand{\col}{\text{Col}}\) \(\renewcommand{\row}{\text{Row}}\) \(\newcommand{\nul}{\text{Nul}}\) \(\newcommand{\var}{\text{Var}}\) \(\newcommand{\corr}{\text{corr}}\) \(\newcommand{\len}[1]{\left|#1\right|}\) \(\newcommand{\bbar}{\overline{\bvec}}\) \(\newcommand{\bhat}{\widehat{\bvec}}\) \(\newcommand{\bperp}{\bvec^\perp}\) \(\newcommand{\xhat}{\widehat{\xvec}}\) \(\newcommand{\vhat}{\widehat{\vvec}}\) \(\newcommand{\uhat}{\widehat{\uvec}}\) \(\newcommand{\what}{\widehat{\wvec}}\) \(\newcommand{\Sighat}{\widehat{\Sigma}}\) \(\newcommand{\lt}{<}\) \(\newcommand{\gt}{>}\) \(\newcommand{\amp}{&}\) \(\definecolor{fillinmathshade}{gray}{0.9}\)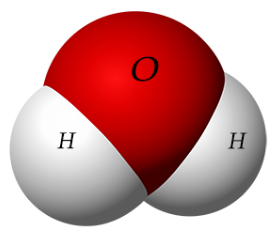 Water is a polar molecule. The oxygen atom in water has a greater electronegativity, or a stronger “pull,” on the electrons that it shares with the two hydrogens it is covalently bonded to. As a result, the molecule ends up having a partially negatively charged end, near the oxygen, and a partially positively charged end near the hydrogens. Much like a magnet, opposite charges will attract and similar ones will repel so that the slightly negatively charged oxygen of one water molecule will be attracted to the slightly positively charged hydrogen of a neighboring water molecule. This weak attraction and “sticking together” of polar molecules is called hydrogen bonding.
All life depends upon the unique features of water which result from its polar nature and ‘stickiness.’ Some of the unique properties of water that allow life to exist are:
-
It is less dense as a solid than as a liquid (ice floats)
-
It sticks to itself –cohesion– cohesion is also related to surface tension.
-
It sticks to other polar or charged molecules –adhesion– adhesion results in phenomena such as capillary action.
-
It is a great solvent for other polar or charged molecules.
-
It has a very high specific heat – it can absorb a great deal of heat energy without increasing in temperature
-
It has a neutral pH of 7, which means the concentrations of H+ and OH- ions are equal.
Introduction to Statistics:
Statistical analysis is used to collect a sample size of data which can infer what is occurring in the general population. Standard deviation (often reported as +/-) shows how much variation there is from the average (mean).
If data points are close together, the standard deviation with be small. If data points are spread out, the standard deviation will be larger. Typical data will show a normal distribution (bell-shaped curve). In normal distribution, about 68% of values are within one standard deviation of the mean, 95% of values are within two standard deviations of the mean, and 99% of the values are within three standard deviations of the mean x̄.
The formula for standard deviation is shown to the below, where is the mean, xi is any given data value, and n is the sample size. Consider the following sample problem.
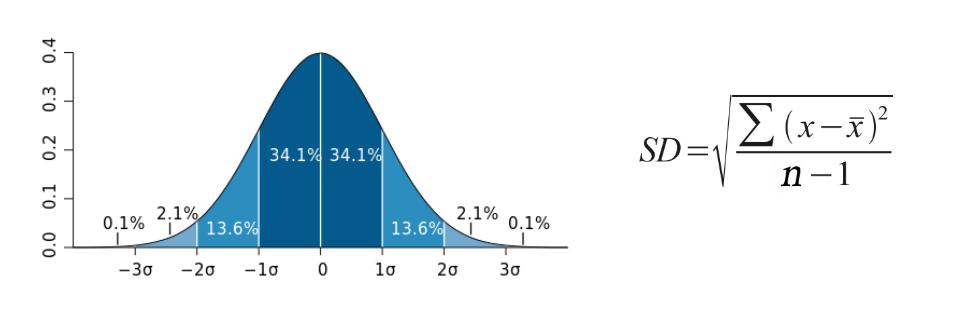
Quickcheck: On a normal distribution curve, what percentage of data points will be within 1 standard deviation of the mean? ___________ How many will be within 2 standard deviations of the mean? __________
Practice Problem: The length in millimeters of 6 worms were: 96, 88, 86, 84, 80, 70.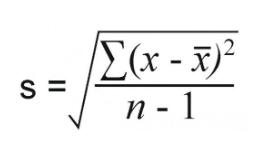
Step 1: Find the Mean (x̄). _____________
Step 2: Determine the Deviation (xi - x̄ )2 from the mean for each value and square it, then add up all of the total values.
Step 3: Calculate the Degrees of Freedom (n-1). ______________
Step 4: Put it all together to find s. _______________
Step 5: Determine the data range for one standard deviation: _________________ two standard deviations: _________________
Standard error of the mean is used to represent uncertainty in an estimation of mean and accounts for both sa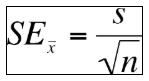 mple size and variability. The formula used to calculate standard error of the mean is shown below. As standard error grows smaller, the likelihood that the sample mean is an accurate estimation of the population increases.
Using the data from the standard deviation example above, the mean is 84 and the standard deviation is 9. What is the SE? _____
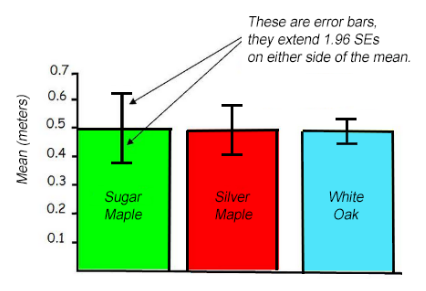 It is common practice to add standard error bars to graphs, marking one or two standard error(s) above and below the sample mean (see figure to the right). Such bars give an impression of the precision of estimation of the mean in each sample. Typically, the length of the bars above and below the mean and the overlap of the bars as compared to one another is analyzed (see figures to the right). The length of the bars shows the spread around the mean. Shorter bars indicate less variability from the mean. If two or more error bars are the same size, they have similar spreads around their means. If a bar is longer than others, it has a larger spread around its mean. In the graph shown, the white oak data shows the least amount of variation around its mean.
 When the range of bars overlaps, this indicates that there is NOT a significant difference in averages and data sets. If the range of bars does not overlap, there may be a significant difference in averages and data sets.
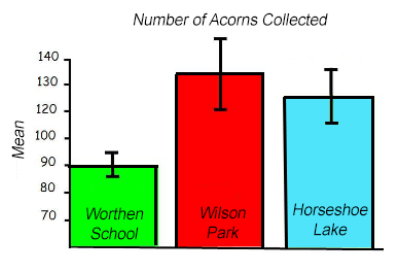
Notice that in the last image, the error bars tell us that we can be 95% confident (2 SEM) that the number of acorns collected at Worthen School is significantly different from the Wilson Park and Horseshoe Lake sites. Things are not as clear-cut between Wilson Park and Horseshoe Lake because the error bars overlap.
Pre-Lab Questions: Use the above background information and your textbook to answer the following questions.
1. Why is water considered to be polar?
2. Sketch a molecule of water (include the partial charges).
3. Which type of bonds form between the oxygen and hydrogen atoms of TWO DIFFERENT water molecules?
4. Which type of bonds form between the oxygen and hydrogen atoms of WITHIN a water molecule?
5. Explain what shorter error bars mean when you are analyzing data from a graph.
Question: How will soap or alcohol affect the hydrogen bonds between different water molecules? 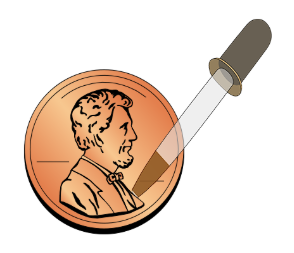
Hypothesis:
Materials: Penny, water, soap, pipette, paper towel, 70% rubbing alcohol
Procedure:
-
Obtain a DRY penny and place it on a DRY paper towel.
-
Using a clean pipette, add water to the penny drop by drop until it overflows. Be sure to count the drops! Record the number of drops for Trial 1 in Data Table 1 below.
-
Repeat steps 1-2 for a total of five trials.
-
Place 1 ml of soap in 50 ml of water to create a solution. Test this number of drops of the soap and water can fit onto the penny.
-
Repeat the experiment using 70% rubbing alcohol. You do not need to dilute it with water, it is already diluted.
Data Collection:
Data Table 1: Number of Drops of Distilled Water Contained on the Surface of a Penny
|
Trial |
# Drops Water |
# Drops Water + Soap |
# Drops 70% Alcohol |
|
1 |
|||
|
2 |
|||
|
3 |
|||
|
4 |
|||
|
5 |
|||
|
Average |
Data Table 2: Statistical Analysis of the Number of Drops of Distilled Water Contained on the Surface of a Penny
|
Calculation |
# Drops Water |
# Drops Water + Soap |
# Drops 70% Alcohol |
|
Mean |
|||
|
Standard Deviation |
|||
|
+/- 1 std dev |
|||
|
+/- 2 std dev |
|||
|
Standard Error |
|||
|
+/- 2 SEM |
Graph Data
Create an appropriately labeled bar graph to illustrate the sample means for the penny within 95% confidence (+/- 2 SEM). Don’t forget a title that includes the independent and dependent variables and axes labels with units.
1. Make a Claim about how soap and alcohol affects hydrogen bonds between water molecules. This can be written as two separate claims.
2. Using data from this experiment, provide Evidence from your investigation that supports the claim(s).
3. Using background knowledge and data from this lab, provide Reasoning that uses the evidence to justify the claim and comment on how confident you are in your conclusions. Here, you may want to include deductive reasoning that uses the properties of water to explain why you obtained the results.
4. Suggest another experiment that you could perform that deals with surface tension. Write your question/hypothesis below and a brief description of how you would conduct the experiment.