
Microevolution
- Page ID
- 23994

\( \newcommand{\vecs}[1]{\overset { \scriptstyle \rightharpoonup} {\mathbf{#1}} } \)
\( \newcommand{\vecd}[1]{\overset{-\!-\!\rightharpoonup}{\vphantom{a}\smash {#1}}} \)
\( \newcommand{\dsum}{\displaystyle\sum\limits} \)
\( \newcommand{\dint}{\displaystyle\int\limits} \)
\( \newcommand{\dlim}{\displaystyle\lim\limits} \)
\( \newcommand{\id}{\mathrm{id}}\) \( \newcommand{\Span}{\mathrm{span}}\)
( \newcommand{\kernel}{\mathrm{null}\,}\) \( \newcommand{\range}{\mathrm{range}\,}\)
\( \newcommand{\RealPart}{\mathrm{Re}}\) \( \newcommand{\ImaginaryPart}{\mathrm{Im}}\)
\( \newcommand{\Argument}{\mathrm{Arg}}\) \( \newcommand{\norm}[1]{\| #1 \|}\)
\( \newcommand{\inner}[2]{\langle #1, #2 \rangle}\)
\( \newcommand{\Span}{\mathrm{span}}\)
\( \newcommand{\id}{\mathrm{id}}\)
\( \newcommand{\Span}{\mathrm{span}}\)
\( \newcommand{\kernel}{\mathrm{null}\,}\)
\( \newcommand{\range}{\mathrm{range}\,}\)
\( \newcommand{\RealPart}{\mathrm{Re}}\)
\( \newcommand{\ImaginaryPart}{\mathrm{Im}}\)
\( \newcommand{\Argument}{\mathrm{Arg}}\)
\( \newcommand{\norm}[1]{\| #1 \|}\)
\( \newcommand{\inner}[2]{\langle #1, #2 \rangle}\)
\( \newcommand{\Span}{\mathrm{span}}\) \( \newcommand{\AA}{\unicode[.8,0]{x212B}}\)
\( \newcommand{\vectorA}[1]{\vec{#1}} % arrow\)
\( \newcommand{\vectorAt}[1]{\vec{\text{#1}}} % arrow\)
\( \newcommand{\vectorB}[1]{\overset { \scriptstyle \rightharpoonup} {\mathbf{#1}} } \)
\( \newcommand{\vectorC}[1]{\textbf{#1}} \)
\( \newcommand{\vectorD}[1]{\overrightarrow{#1}} \)
\( \newcommand{\vectorDt}[1]{\overrightarrow{\text{#1}}} \)
\( \newcommand{\vectE}[1]{\overset{-\!-\!\rightharpoonup}{\vphantom{a}\smash{\mathbf {#1}}}} \)
\( \newcommand{\vecs}[1]{\overset { \scriptstyle \rightharpoonup} {\mathbf{#1}} } \)
\(\newcommand{\longvect}{\overrightarrow}\)
\( \newcommand{\vecd}[1]{\overset{-\!-\!\rightharpoonup}{\vphantom{a}\smash {#1}}} \)
\(\newcommand{\avec}{\mathbf a}\) \(\newcommand{\bvec}{\mathbf b}\) \(\newcommand{\cvec}{\mathbf c}\) \(\newcommand{\dvec}{\mathbf d}\) \(\newcommand{\dtil}{\widetilde{\mathbf d}}\) \(\newcommand{\evec}{\mathbf e}\) \(\newcommand{\fvec}{\mathbf f}\) \(\newcommand{\nvec}{\mathbf n}\) \(\newcommand{\pvec}{\mathbf p}\) \(\newcommand{\qvec}{\mathbf q}\) \(\newcommand{\svec}{\mathbf s}\) \(\newcommand{\tvec}{\mathbf t}\) \(\newcommand{\uvec}{\mathbf u}\) \(\newcommand{\vvec}{\mathbf v}\) \(\newcommand{\wvec}{\mathbf w}\) \(\newcommand{\xvec}{\mathbf x}\) \(\newcommand{\yvec}{\mathbf y}\) \(\newcommand{\zvec}{\mathbf z}\) \(\newcommand{\rvec}{\mathbf r}\) \(\newcommand{\mvec}{\mathbf m}\) \(\newcommand{\zerovec}{\mathbf 0}\) \(\newcommand{\onevec}{\mathbf 1}\) \(\newcommand{\real}{\mathbb R}\) \(\newcommand{\twovec}[2]{\left[\begin{array}{r}#1 \\ #2 \end{array}\right]}\) \(\newcommand{\ctwovec}[2]{\left[\begin{array}{c}#1 \\ #2 \end{array}\right]}\) \(\newcommand{\threevec}[3]{\left[\begin{array}{r}#1 \\ #2 \\ #3 \end{array}\right]}\) \(\newcommand{\cthreevec}[3]{\left[\begin{array}{c}#1 \\ #2 \\ #3 \end{array}\right]}\) \(\newcommand{\fourvec}[4]{\left[\begin{array}{r}#1 \\ #2 \\ #3 \\ #4 \end{array}\right]}\) \(\newcommand{\cfourvec}[4]{\left[\begin{array}{c}#1 \\ #2 \\ #3 \\ #4 \end{array}\right]}\) \(\newcommand{\fivevec}[5]{\left[\begin{array}{r}#1 \\ #2 \\ #3 \\ #4 \\ #5 \\ \end{array}\right]}\) \(\newcommand{\cfivevec}[5]{\left[\begin{array}{c}#1 \\ #2 \\ #3 \\ #4 \\ #5 \\ \end{array}\right]}\) \(\newcommand{\mattwo}[4]{\left[\begin{array}{rr}#1 \amp #2 \\ #3 \amp #4 \\ \end{array}\right]}\) \(\newcommand{\laspan}[1]{\text{Span}\{#1\}}\) \(\newcommand{\bcal}{\cal B}\) \(\newcommand{\ccal}{\cal C}\) \(\newcommand{\scal}{\cal S}\) \(\newcommand{\wcal}{\cal W}\) \(\newcommand{\ecal}{\cal E}\) \(\newcommand{\coords}[2]{\left\{#1\right\}_{#2}}\) \(\newcommand{\gray}[1]{\color{gray}{#1}}\) \(\newcommand{\lgray}[1]{\color{lightgray}{#1}}\) \(\newcommand{\rank}{\operatorname{rank}}\) \(\newcommand{\row}{\text{Row}}\) \(\newcommand{\col}{\text{Col}}\) \(\renewcommand{\row}{\text{Row}}\) \(\newcommand{\nul}{\text{Nul}}\) \(\newcommand{\var}{\text{Var}}\) \(\newcommand{\corr}{\text{corr}}\) \(\newcommand{\len}[1]{\left|#1\right|}\) \(\newcommand{\bbar}{\overline{\bvec}}\) \(\newcommand{\bhat}{\widehat{\bvec}}\) \(\newcommand{\bperp}{\bvec^\perp}\) \(\newcommand{\xhat}{\widehat{\xvec}}\) \(\newcommand{\vhat}{\widehat{\vvec}}\) \(\newcommand{\uhat}{\widehat{\uvec}}\) \(\newcommand{\what}{\widehat{\wvec}}\) \(\newcommand{\Sighat}{\widehat{\Sigma}}\) \(\newcommand{\lt}{<}\) \(\newcommand{\gt}{>}\) \(\newcommand{\amp}{&}\) \(\definecolor{fillinmathshade}{gray}{0.9}\)Evolution– includes all of the changes in the characteristics and diversity of life that occur throughout time.
Evolution can occur on both large and small scales.
Macroevolution – Evolution on a Large Scale
Macroevolution– evolutionary change on a grand scale: Origin of novel designs; Evolutionary trends; Adaptive radiation
Microevolution – Evolution on a Small Scale
Microevolution- a change in the genetic composition of a population over time. A change in the frequency of certain alleles in a population over several generations.
Polymorphism
Polymorphism occurs when there are different allelic forms of a gene in a population.
Mojave (left) and Lesser (middle) are different alleles of the same gene. Wild type ball python is shown on the right.
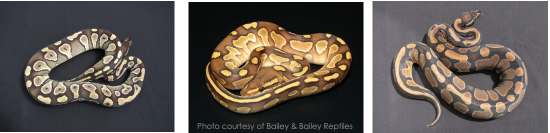
Figure \(\PageIndex{1}\). Lesser ball python (CC BY-NC-SA; Bailey & Bailey Reptiles.)
Gene Pool
All of the alleles of all of the genes possessed by all of the members of the population are contained in the gene poolof the population. ›We can measure the relative frequency of a particular allele in a population: Allelic frequency.
Population Genetics
Population Genetics– the study of how populations change over time. ›Dependent on both Darwin’s theory of natural selection and Mendel’s laws of inheritance. ›All heritable traits have a genetic basis, some are controlled by multiple genes – not as simple as in Mendel’s studies.
Genetic Equilibrium
According to Hardy-Weinberg equilibrium, the hereditary process alone does not produce evolutionary change. Allelic frequency will remain constant generation to generation unless disturbed by mutation, natural selection, migration, nonrandom mating, or genetic drift. These are sources of microevolutionary change.
Frequency of Alleles
Each allele has a frequency(proportion) in the population. ›Example population of 500 wildflowers.
\(C^RC^R\)= red; \(C^RC^W\)= pink; \(C^WC^W\)= white
250 red, 100 pink, 200 white
Frequency of \(C^R\)= (250 x 2) + 100 / 1000 = 600/1000 =.6 = 60%
p is the frequency of the most common allele (CRin this case).
p = 0.6 or 60%
q is the frequency of the less common allele (CWin this case).
p + q = 1
q = 1- p = 1 – 0.6 = 0.4 or 40%
Hardy-Weinberg Theorem
Populations that are not evolving are said to be in Hardy-Weinberg equilibrium. As long as Mendel’s laws are at work, the frequency of alleles will remain unchanged.
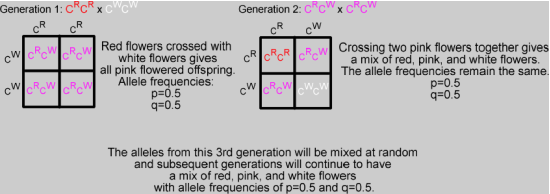
Figure \(\PageIndex{2}\). (CC BY-NC-SA; N. Wheat)
The Hardy-Weinberg theorem assumes random mating. Generation after generation allele frequencies are the same.
Conditions required for Hardy-Weinberg equilibrium to hold true:
- Very large population
- No gene flow into or out of the population
- No mutations
- Random mating
- No natural selection
Departure from these conditions results in a change in allele frequencies in the population. ›Evolution has occurred!
Practice with Hardy Weinberg
Frequency– the proportion of individuals in a category in relation to the total number of individuals.
100 cats, 75 black, 25 white – frequency of black = 75/100 = 0.75, white =0.25.
Two alleles: p is common, q is less common.
p+q= 1
At a locus with two alleles, the three genotypes will appear in the following proportions:
(p + q) x (p + q) = \(p^2+ 2pq + q^2\)= 1
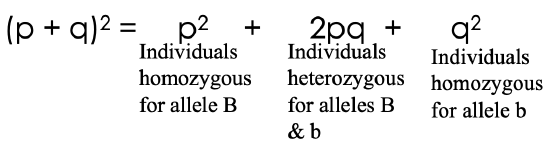
Figure \(\PageIndex{3}\). (CC BY-NC-SA; N. Wheat)
We will use a population of 100 cats as a practice example: ›84 of the 100 cats are black; ›16 are white.
We can use the equation and our color observations to calculate allele frequencies in our population of 100 cats.
\(p^2+ 2pq + q^2\)= 1; 100 = population size
84 of our 100 cats are black.
Black is the dominant phenotype.
Cats with the genotype Bb or BB will be black.
The frequency of black cats is 84/100, but we can’t yet say anything about the B allele.
16 of our 100 cats are white. White is recessive (bb) and is represented by q2in our equation: p2+ 2pq + q2= 1. So, q2 = 16/100 = 0.16
q =square root of 0.16 = 0.40. Since p + q = 1; p =1 – q = 0.60.
\(p^2\)= 0.36. \(p^2\) represents the proportion of individuals in the population with the homozygous dominant phenotype (BB).
Remember population size = 100. Now we know how many of our cats have the BB genotype and the bb genotype. We can find the number of Bb cats using our equation: \(p^2+ 2pq + q^2\)= 1.
2pq represents the proportion of cats with Bb. 2 x 0.6(p) x 0.4(q) = 0.48; 0.48 x 100 = 48 cats with Bb genotype.

This tutorial was funded by the Title V-STEM Grant #P031S090007.