
16.2: Measures of Biodiversity Loss
- Page ID
- 69519

\( \newcommand{\vecs}[1]{\overset { \scriptstyle \rightharpoonup} {\mathbf{#1}} } \)
\( \newcommand{\vecd}[1]{\overset{-\!-\!\rightharpoonup}{\vphantom{a}\smash {#1}}} \)
\( \newcommand{\dsum}{\displaystyle\sum\limits} \)
\( \newcommand{\dint}{\displaystyle\int\limits} \)
\( \newcommand{\dlim}{\displaystyle\lim\limits} \)
\( \newcommand{\id}{\mathrm{id}}\) \( \newcommand{\Span}{\mathrm{span}}\)
( \newcommand{\kernel}{\mathrm{null}\,}\) \( \newcommand{\range}{\mathrm{range}\,}\)
\( \newcommand{\RealPart}{\mathrm{Re}}\) \( \newcommand{\ImaginaryPart}{\mathrm{Im}}\)
\( \newcommand{\Argument}{\mathrm{Arg}}\) \( \newcommand{\norm}[1]{\| #1 \|}\)
\( \newcommand{\inner}[2]{\langle #1, #2 \rangle}\)
\( \newcommand{\Span}{\mathrm{span}}\)
\( \newcommand{\id}{\mathrm{id}}\)
\( \newcommand{\Span}{\mathrm{span}}\)
\( \newcommand{\kernel}{\mathrm{null}\,}\)
\( \newcommand{\range}{\mathrm{range}\,}\)
\( \newcommand{\RealPart}{\mathrm{Re}}\)
\( \newcommand{\ImaginaryPart}{\mathrm{Im}}\)
\( \newcommand{\Argument}{\mathrm{Arg}}\)
\( \newcommand{\norm}[1]{\| #1 \|}\)
\( \newcommand{\inner}[2]{\langle #1, #2 \rangle}\)
\( \newcommand{\Span}{\mathrm{span}}\) \( \newcommand{\AA}{\unicode[.8,0]{x212B}}\)
\( \newcommand{\vectorA}[1]{\vec{#1}} % arrow\)
\( \newcommand{\vectorAt}[1]{\vec{\text{#1}}} % arrow\)
\( \newcommand{\vectorB}[1]{\overset { \scriptstyle \rightharpoonup} {\mathbf{#1}} } \)
\( \newcommand{\vectorC}[1]{\textbf{#1}} \)
\( \newcommand{\vectorD}[1]{\overrightarrow{#1}} \)
\( \newcommand{\vectorDt}[1]{\overrightarrow{\text{#1}}} \)
\( \newcommand{\vectE}[1]{\overset{-\!-\!\rightharpoonup}{\vphantom{a}\smash{\mathbf {#1}}}} \)
\( \newcommand{\vecs}[1]{\overset { \scriptstyle \rightharpoonup} {\mathbf{#1}} } \)
\(\newcommand{\longvect}{\overrightarrow}\)
\( \newcommand{\vecd}[1]{\overset{-\!-\!\rightharpoonup}{\vphantom{a}\smash {#1}}} \)
\(\newcommand{\avec}{\mathbf a}\) \(\newcommand{\bvec}{\mathbf b}\) \(\newcommand{\cvec}{\mathbf c}\) \(\newcommand{\dvec}{\mathbf d}\) \(\newcommand{\dtil}{\widetilde{\mathbf d}}\) \(\newcommand{\evec}{\mathbf e}\) \(\newcommand{\fvec}{\mathbf f}\) \(\newcommand{\nvec}{\mathbf n}\) \(\newcommand{\pvec}{\mathbf p}\) \(\newcommand{\qvec}{\mathbf q}\) \(\newcommand{\svec}{\mathbf s}\) \(\newcommand{\tvec}{\mathbf t}\) \(\newcommand{\uvec}{\mathbf u}\) \(\newcommand{\vvec}{\mathbf v}\) \(\newcommand{\wvec}{\mathbf w}\) \(\newcommand{\xvec}{\mathbf x}\) \(\newcommand{\yvec}{\mathbf y}\) \(\newcommand{\zvec}{\mathbf z}\) \(\newcommand{\rvec}{\mathbf r}\) \(\newcommand{\mvec}{\mathbf m}\) \(\newcommand{\zerovec}{\mathbf 0}\) \(\newcommand{\onevec}{\mathbf 1}\) \(\newcommand{\real}{\mathbb R}\) \(\newcommand{\twovec}[2]{\left[\begin{array}{r}#1 \\ #2 \end{array}\right]}\) \(\newcommand{\ctwovec}[2]{\left[\begin{array}{c}#1 \\ #2 \end{array}\right]}\) \(\newcommand{\threevec}[3]{\left[\begin{array}{r}#1 \\ #2 \\ #3 \end{array}\right]}\) \(\newcommand{\cthreevec}[3]{\left[\begin{array}{c}#1 \\ #2 \\ #3 \end{array}\right]}\) \(\newcommand{\fourvec}[4]{\left[\begin{array}{r}#1 \\ #2 \\ #3 \\ #4 \end{array}\right]}\) \(\newcommand{\cfourvec}[4]{\left[\begin{array}{c}#1 \\ #2 \\ #3 \\ #4 \end{array}\right]}\) \(\newcommand{\fivevec}[5]{\left[\begin{array}{r}#1 \\ #2 \\ #3 \\ #4 \\ #5 \\ \end{array}\right]}\) \(\newcommand{\cfivevec}[5]{\left[\begin{array}{c}#1 \\ #2 \\ #3 \\ #4 \\ #5 \\ \end{array}\right]}\) \(\newcommand{\mattwo}[4]{\left[\begin{array}{rr}#1 \amp #2 \\ #3 \amp #4 \\ \end{array}\right]}\) \(\newcommand{\laspan}[1]{\text{Span}\{#1\}}\) \(\newcommand{\bcal}{\cal B}\) \(\newcommand{\ccal}{\cal C}\) \(\newcommand{\scal}{\cal S}\) \(\newcommand{\wcal}{\cal W}\) \(\newcommand{\ecal}{\cal E}\) \(\newcommand{\coords}[2]{\left\{#1\right\}_{#2}}\) \(\newcommand{\gray}[1]{\color{gray}{#1}}\) \(\newcommand{\lgray}[1]{\color{lightgray}{#1}}\) \(\newcommand{\rank}{\operatorname{rank}}\) \(\newcommand{\row}{\text{Row}}\) \(\newcommand{\col}{\text{Col}}\) \(\renewcommand{\row}{\text{Row}}\) \(\newcommand{\nul}{\text{Nul}}\) \(\newcommand{\var}{\text{Var}}\) \(\newcommand{\corr}{\text{corr}}\) \(\newcommand{\len}[1]{\left|#1\right|}\) \(\newcommand{\bbar}{\overline{\bvec}}\) \(\newcommand{\bhat}{\widehat{\bvec}}\) \(\newcommand{\bperp}{\bvec^\perp}\) \(\newcommand{\xhat}{\widehat{\xvec}}\) \(\newcommand{\vhat}{\widehat{\vvec}}\) \(\newcommand{\uhat}{\widehat{\uvec}}\) \(\newcommand{\what}{\widehat{\wvec}}\) \(\newcommand{\Sighat}{\widehat{\Sigma}}\) \(\newcommand{\lt}{<}\) \(\newcommand{\gt}{>}\) \(\newcommand{\amp}{&}\) \(\definecolor{fillinmathshade}{gray}{0.9}\)Extinct and Threatened Animals
The International Union for the Conservation of Nature (IUCN) coordinates efforts to catalog and preserve biodiversity worldwide. One way scientists gauge trends in biodiversity is by monitoring the fate of individual species. Since 1964, the IUCN has compiled information in the Red List of Threatened Species, which includes plants, animals, fungi, and selected brown algae species. The Red List is supported by scientific research. In 2011, the list contained 61,000 species, all with supporting documentation. Updates to the Red List are released every four years.
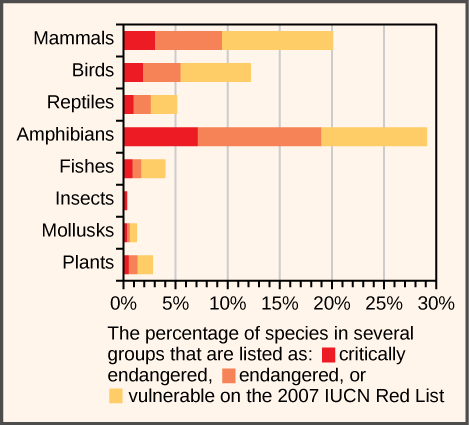
Figure \(\PageIndex{1}\): This chart shows the percentage of various animal species, by group, on the IUCN Red List as of 2007.
Species can be classified into nine Red List categories based on their extinction risk. Firstly, there are species that are already extinct and those that are extinct in the wild, meaning that the remaining individuals are only found in captivity.

Figure \(\PageIndex{2}\): North American passenger pigeons lived in enormous flocks and were once the most numerous birds on earth. Market hunting on a massive scale and habitat destruction combined to extinguish them as a species in the early twentieth century.
Species at risk of extinction are called threatened. Species that are at risk of becoming threatened are called near threatened. The Emperor Penguin (Aptenodytes forsteri) is an example a near threatened species, mainly due to habitat loss and climate change (figure \(\PageIndex{3}\)).
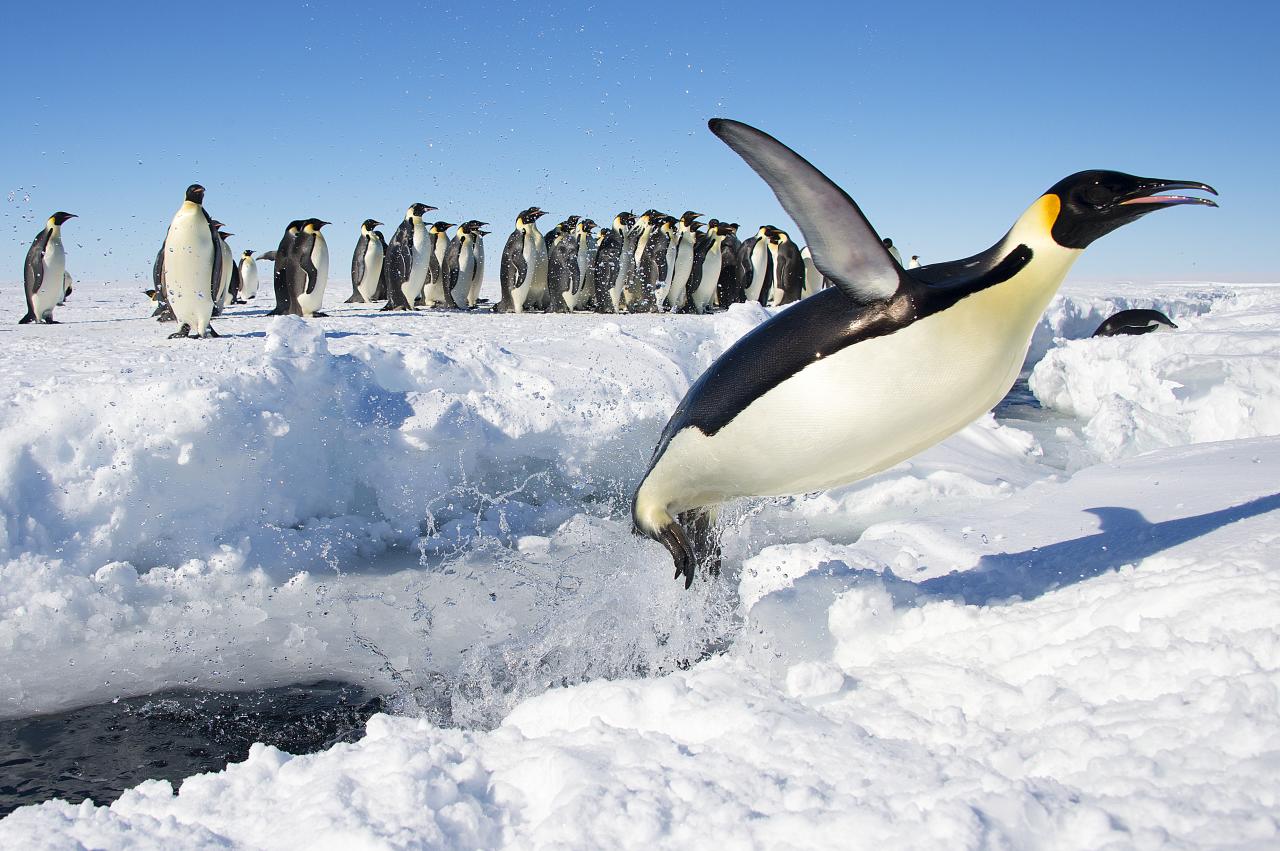
Figure \(\PageIndex{3}\): The Emperor Penguin is an example of near threatened species. Image by Christopher Michel (CC-BY).
Those with little risk of extinction are designated least concern. Note that only a fraction of the 8-11 million species on Earth are identified (see The Number of Species on Earth). For many of the species that are identified, data still needs to be gathered before they can be assigned to a Red List category (data deficient). Less than 10% of the approximately 1.5 million identified species have been assessed for the Red List at all. Species that have not been assessed are deemed not evaluated.
There are three categories of threatened species: vulnerable, endangered, and critically endangered. Of these, critically endangered species have the greatest risk while vulnerable species are at the least risk out of the threatened categories. The African elephant (Loxodonta africana) is listed vulnerable species due to poaching and habitat loss (figure \(\PageIndex{4}\)). Interestingly, the forest subspecies (L. africana cylotis) is at much greater risk than the savanna subspecies (L. africana africana), but the Red List category is assigned at the species level in this case. The blue whale (Balaenoptera musculus) is endangered due to pollution, climate change, and poaching (figure \(\PageIndex{5}\)). Fortunately, blue whale population size is increasing. Several species of pitcher plants, which trap insects as a source of nitrogen, are critically endangered due to overexploitation and habitat loss (figure \(\PageIndex{6}\)).
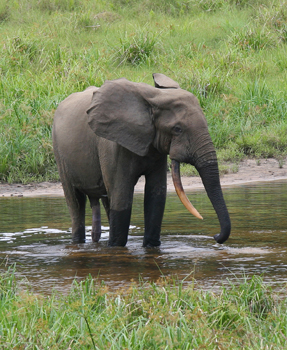
Figure \(\PageIndex{4}\): The African forest elephant (Loxodonta africana cylotis) is at greater risk of extinction than the savanna subspecies. When both subspecies are grouped together, African elephants are considered vulnerable. Image by Peter H. Wrege (CC-BY-SA).
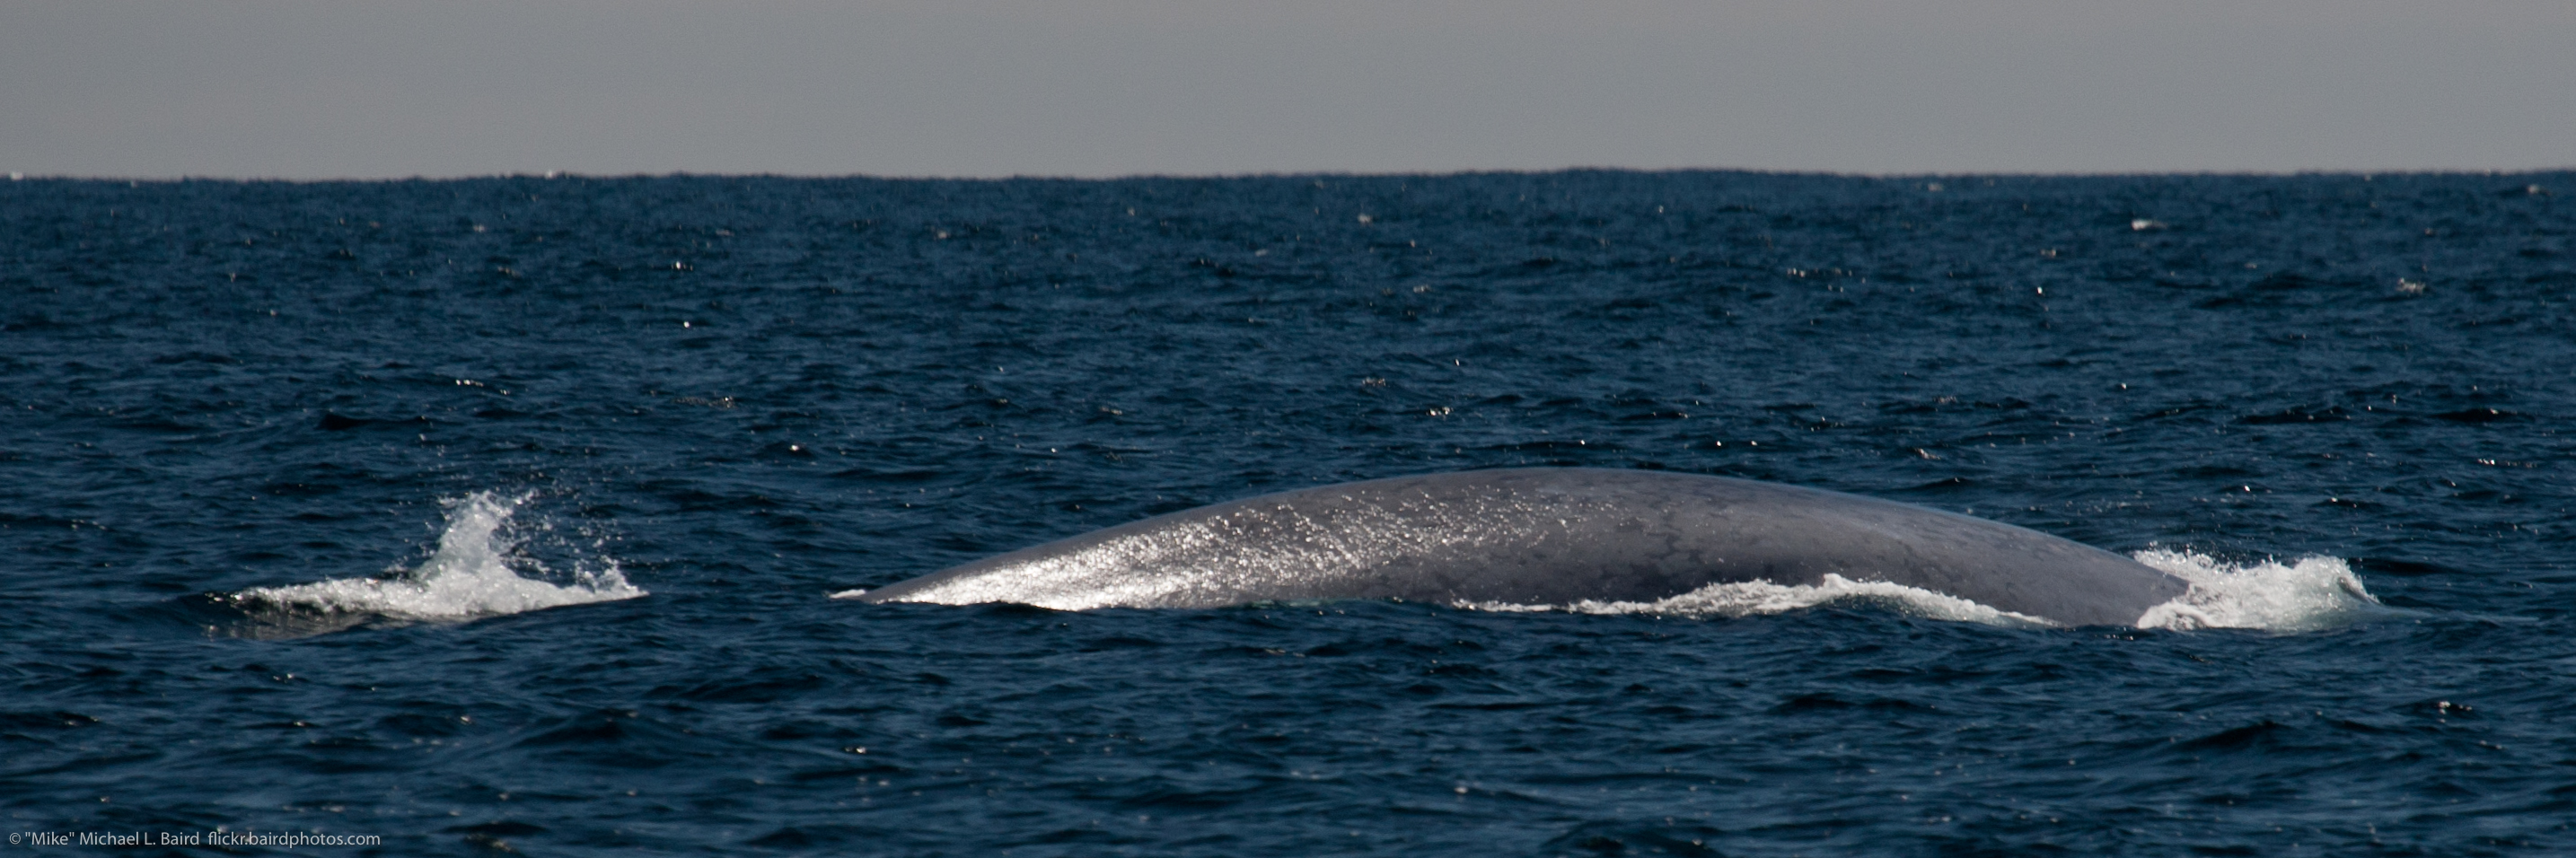
Figure \(\PageIndex{5}\): The blue whale (Balaenoptera musculus) is categorized as endangered according to the IUCN Red List. Image by Mike Baird (CC-BY).
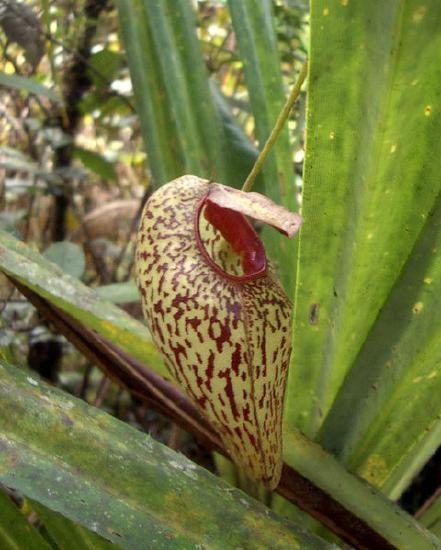
Figure \(\PageIndex{6}\): Nepenthes aristolochioides is a critically endangered pitcher plant. Image by Alfindra Primaldhi (CC-BY).
Scientists know much more about the state of vertebrates—especially mammals, birds, and amphibians—than they do about other forms of animal life. Every one of the 5,488 species of mammals that have been described, for example, has been evaluated for purposes of the Red List. Of them, 76 species have become extinct since 1500, and two, Pere David's deer, which is native to China, and the scimitar oryx from Africa survive only in managed facilities. Another 29 of the mammal species listed as critically endangered are also tagged as "possibly extinct;" they are very likely gone, but the sort of exhaustive surveys required to confirm that fact have not been conducted. Overall, approximately 22% of mammal species worldwide are known to be threatened or extinct.
The Red List categorizes a smaller proportion of the world's 9,990 described bird species—14%—as threatened or extinct. But the raw number of species lost since 1500 is at least 134, and four more species persist only in zoos. Another 15 species of birds are considered possibly extinct. The fact that 86% of bird species are categorized as "not threatened" is good news in the context of the Red List.
Among the well-studied vertebrates, amphibians are faring especially poorly. Of the more than 6,000 known species of amphibians, 38 have become extinct worldwide since 1500, and another one, the Wyoming toad, survives only in captivity. Another 120 species are considered possibly extinct. Overall, 2,030, or one-third of the world's amphibian species are known to be threatened or extinct. More troubling still, many amphibian species—42.5%—are reported to be declining, and that number is probably low, since trend information is unavailable for 30.4% of species.

Figure \(\PageIndex{7}\): The extinct golden toad of Monteverde, Costa Rica, was last seen in 1989. Its extinction is attributed to fungal infection combined with especially hot, dry weather. Source: U.S. Fish and Wildlife Service via Wikimedia Commons
Only small proportions of the world's species of reptiles and fish have been evaluated for purposes of the Red List. Among those, 34% of selected reptiles and 8% of selected bony fishes are threatented. Among those, the numbers of species that fall into the threatened category are very high: 1,275 of the 3,481 evaluated species, or 37%, for fish; and 423 of 1,385 evaluated species, or 31%, for reptiles. It should be noted, however, that these percentages are likely overestimates, since species of concern are more likely to be selected for evaluation than others.
The category "invertebrates" lumps together the vast majority of multi-cellular animals, an estimated 97% of all species. They include everything from insects and arachnids, to mollusks, crustaceans, corals, and more. Few of these groups have been assessed in a comprehensive way, but assessments within some groups call attention to disturbing, large-scale trends. For example, 33% of the world's reef-building corals are already considered threatened, and many more of them are experiencing rates of decline that move them toward threatened status (figure \(\PageIndex{8}\)). The demise of reef-building corals has magnified ecological impacts, since so much other marine life depends on them.

Figure \(\PageIndex{8}\): Reef-formal corals, such this pink soft coral, are at high risk of extinction. Source: Linda Wade via National Oceanic & Atmospheric Administration (NOAA)
It should be understood that information about familiar creatures such as amphibians, mammals, and birds is just a beginning, and that even with the inclusion of some invertebrates the Red List does not provide a comprehensive picture of life on Earth. Scientists have described fewer than 2 million of the 8-9 million species of organisms thought to exist, most of which are insects. And of those 2 million, the status of only 44,838 has been assessed by IUCN.
In addition, it should be understood that among the species that have been assessed so far, there is a strong bias toward terrestrial vertebrates and plants, especially the ones that occur where biologists have visited frequently. Red List assessments also tend to focus on species that are likely to be threatened, since the effort also has the aim of enabling people to conserve species.
Whereas extinction is the global loss of a species, the elimination of species at a local level–known as extirpation – also poses threats to the integrity and sustainability of ecosystems. Widespread extirpation obviously leads to threatened or endangered status, but absence of species, even at a local scale, can affect ecosystem function. For example, by the mid-1920s wolves had been extirpated from Yellowstone National Park, although they continued to thrive elsewhere. When wolves were reintroduced to the park in the mid-1990s, numbers of elk (a main prey item) decreased significantly. This, in turn, reduced browsing pressure and had a significant effect on the vegetation and plant communities. What mattered for ecosystem function in Yellowstone was whether wolves were present there, not just whether the species survived somewhere.
Biodiversity Change through Geological Time
The number of species on the planet, or in any geographical area, is the result of an equilibrium of two evolutionary processes that are ongoing: speciation and extinction. Both are natural “birth” and “death” processes of macroevolution. When speciation rates begin to outstrip extinction rates, the number of species will increase; likewise, the number of species will decrease when extinction rates begin to overtake speciation rates. Throughout Earth’s history, these two processes have fluctuated—sometimes leading to dramatic changes in the number of species on Earth as reflected in the fossil record (Figure \(\PageIndex{9}\)).
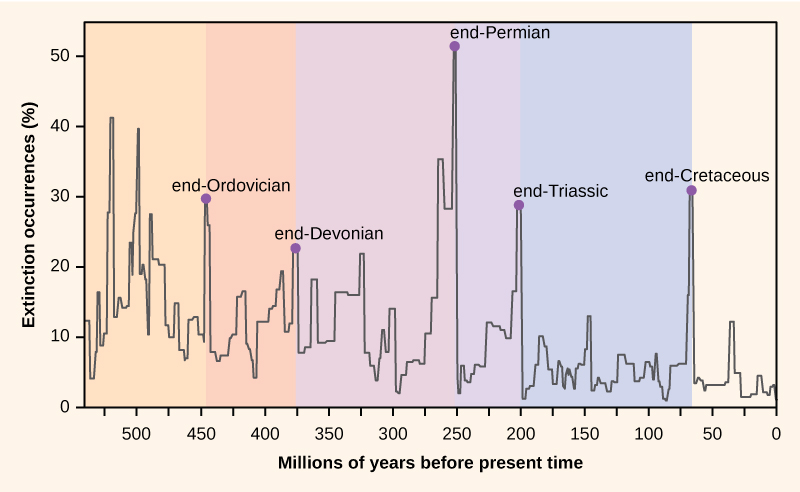
Paleontologists have identified five strata in the fossil record that appear to show sudden and dramatic (greater than half of all extant species disappearing from the fossil record) losses in biodiversity. These are called mass extinctions. There are many lesser, yet still dramatic, extinction events, but the five mass extinctions have attracted the most research. An argument can be made that the five mass extinctions are only the five most extreme events in a continuous series of large extinction events throughout the Phanerozoic (since 542 million years ago). In most cases, the hypothesized causes are still controversial; however, the most recent event seems clear.
The fossil record of the mass extinctions was the basis for defining periods of geological history, so they typically occur at the transition point between geological periods. The transition in fossils from one period to another reflects the dramatic loss of species and the gradual origin of new species. These transitions can be seen in the rock strata. Table \(\PageIndex{2}\) provides data on the five mass extinctions.
| Geological Period | Mass Extinction Name | Time (millions of years ago) |
|---|---|---|
| Ordovician–Silurian | end-Ordovician O–S | 450–440 |
| Late Devonian | end-Devonian | 375–360 |
| Permian–Triassic | end-Permian | 251 |
| Triassic–Jurassic | end-Triassic | 205 |
| Cretaceous–Paleogene | end-Cretaceous K–Pg (K–T) | 65.5 |
The Ordovician-Silurian extinction event is the first recorded mass extinction and the second largest. During this period, about 85 percent of marine species (few species lived outside the oceans) became extinct. The main hypothesis for its cause is a period of glaciation and then warming. The extinction event actually consists of two extinction events separated by about 1 million years. The first event was caused by cooling, and the second event was due to the subsequent warming. The climate changes affected temperatures and sea levels. Some researchers have suggested that a gamma-ray burst, caused by a nearby supernova, is a possible cause of the Ordovician-Silurian extinction. The gamma-ray burst would have stripped away the Earth’s ozone layer causing intense ultraviolet radiation from the sun and may account for climate changes observed at the time. The hypothesis is speculative, but extraterrestrial influences on Earth’s history are an active line of research. Recovery of biodiversity after the mass extinction took from 5 to 20 million years, depending on the location.
The late Devonian extinction may have occurred over a relatively long period of time. It appears to have affected marine species and not the plants or animals inhabiting terrestrial habitats. The causes of this extinction are poorly understood.
The end-Permian extinction was the largest in the history of life. Indeed, an argument could be made that Earth nearly became devoid of life during this extinction event. The planet looked very different before and after this event. Estimates are that 96 percent of all marine species and 70 percent of all terrestrial species were lost. It was at this time, for example, that the trilobites, a group that survived the Ordovician–Silurian extinction, became extinct. The causes for this mass extinction are not clear, but the leading suspect is extended and widespread volcanic activity that led to a runaway global-warming event. The oceans became largely anoxic, suffocating marine life. Terrestrial tetrapod diversity took 30 million years to recover after the end-Permian extinction. The Permian extinction dramatically altered Earth’s biodiversity makeup and the course of evolution.
The causes of the Triassic–Jurassic extinction event are not clear and hypotheses of climate change, asteroid impact, and volcanic eruptions have been argued. The extinction event occurred just before the breakup of the supercontinent Pangaea, although recent scholarship suggests that the extinctions may have occurred more gradually throughout the Triassic.
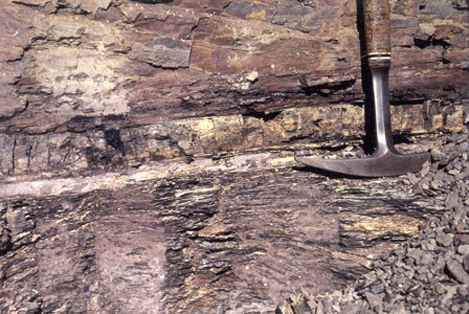
The causes of the end-Cretaceous extinction event are the ones that are best understood. It was during this extinction event about 65 million years ago that the dinosaurs, the dominant vertebrate group for millions of years, disappeared from the planet (with the exception of a theropod clade that gave rise to birds). Indeed, every land animal that weighed more then 25 kg became extinct. The cause of this extinction is now understood to be the result of a cataclysmic impact of a large meteorite, or asteroid, off the coast of what is now the Yucatán Peninsula. This hypothesis, proposed first in 1980, was a radical explanation based on a sharp spike in the levels of iridium (which rains down from space in meteors at a fairly constant rate but is otherwise absent on Earth’s surface) at the rock stratum that marks the boundary between the Cretaceous and Paleogene periods (Figure \(\PageIndex{10}\)). This boundary marked the disappearance of the dinosaurs in fossils as well as many other taxa. The researchers who discovered the iridium spike interpreted it as a rapid influx of iridium from space to the atmosphere (in the form of a large asteroid) rather than a slowing in the deposition of sediments during that period. It was a radical explanation, but the report of an appropriately aged and sized impact crater in 1991 made the hypothesis more believable. Now an abundance of geological evidence supports the theory. Recovery times for biodiversity after the end-Cretaceous extinction are shorter, in geological time, than for the end-Permian extinction, on the order of 10 million years.
Art Connection

The Pleistocene Extinction
The Pleistocene Extinction is one of the lesser extinctions, and a recent one. It is well known that the North American, and to some degree Eurasian, megafauna, or large animals, disappeared toward the end of the last glaciation period. The extinction appears to have happened in a relatively restricted time period of 10,000–12,000 years ago. In North America, the losses were quite dramatic and included the woolly mammoths (last dated about 4,000 years ago in an isolated population), mastodon, giant beavers, giant ground sloths, saber-toothed cats, and the North American camel, just to name a few. The possibility that the rapid extinction of these large animals was caused by over-hunting was first suggested in the 1900s. Research into this hypothesis continues today. It seems likely that over-hunting caused many pre-written history extinctions in many regions of the world.
In general, the timing of the Pleistocene extinctions correlated with the arrival of humans and not with climate-change events, which is the main competing hypothesis for these extinctions. The extinctions began in Australia about 40,000 to 50,000 years ago, just after the arrival of humans in the area: a marsupial lion, a giant one-ton wombat, and several giant kangaroo species disappeared. In North America, the extinctions of almost all of the large mammals occurred 10,000–12,000 years ago. All that are left are the smaller mammals such as bears, elk, moose, and cougars. Finally, on many remote oceanic islands, the extinctions of many species occurred coincident with human arrivals. Not all of the islands had large animals, but when there were large animals, they were lost. Madagascar was colonized about 2,000 years ago and the large mammals that lived there became extinct. Eurasia and Africa do not show this pattern, but they also did not experience a recent arrival of humans. Humans arrived in Eurasia hundreds of thousands of years ago after the origin of the species in Africa. This topic remains an area of active research and hypothesizing. It seems clear that even if climate played a role, in most cases human hunting precipitated the extinctions.
Present-Time Extinctions
The sixth, or Holocene, mass extinction appears to have begun earlier than previously believed and has mostly to do with the activities of Homo sapiens. Since the beginning of the Holocene period, there are numerous recent extinctions of individual species that are recorded in human writings. Most of these are coincident with the expansion of the European colonies since the 1500s.
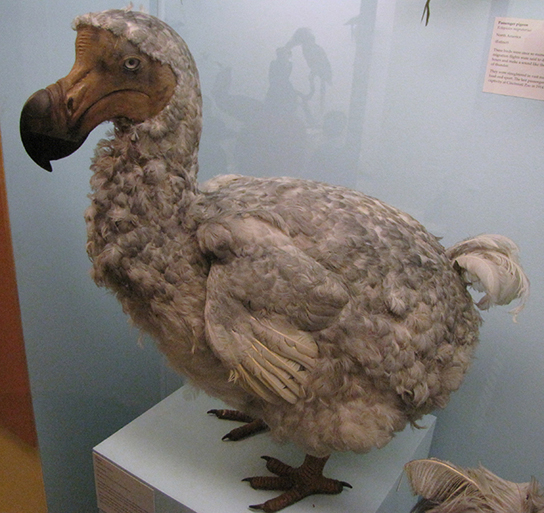
One of the earlier and popularly known examples is the dodo bird. The dodo bird lived in the forests of Mauritius, an island in the Indian Ocean. The dodo bird became extinct around 1662. It was hunted for its meat by sailors and was easy prey because the dodo, which did not evolve with humans, would approach people without fear. Introduced pigs, rats, and dogs brought to the island by European ships also killed dodo young and eggs (Figure \(\PageIndex{11}\)).
Steller's sea cow became extinct in 1768; it was related to the manatee and probably once lived along the northwest coast of North America. Steller's sea cow was first discovered by Europeans in 1741 and was hunted for meat and oil. The last sea cow was killed in 1768. That amounts to 27 years between the sea cow’s first contact with Europeans and extinction of the species.
In 1914, the last living passenger pigeon died in a zoo in Cincinnati, Ohio. This species had once darkened the skies of North America during its migrations, but it was hunted and suffered from habitat loss through the clearing of forests for farmland. In 1918, the last living Carolina parakeet died in captivity. This species was once common in the eastern United States, but it suffered from habitat loss. The species was also hunted because it ate orchard fruit when its native foods were destroyed to make way for farmland. The Japanese sea lion, which inhabited a broad area around Japan and the coast of Korea, became extinct in the 1950s due to fishermen. The Caribbean monk seal was distributed throughout the Caribbean Sea but was driven to extinction via hunting by 1952.
These are only a few of the recorded extinctions in the past 500 years. The International Union for Conservation of Nature (IUCN) keeps a list of extinct and endangered species called the Red List. The list is not complete, but it describes 380 extinct species of vertebrates after 1500 AD, 86 of which were driven extinct by overhunting or overfishing.
Estimates of Present-Time Extinction Rates
Estimates of extinction rates are hampered by the fact that most extinctions are probably happening without observation. The extinction of a bird or mammal is likely to be noticed by humans, especially if it has been hunted or used in some other way. But there are many organisms that are of less interest to humans (not necessarily of less value) and many that are undescribed.
The background extinction rate is estimated to be about one per million species per year (E/MSY). For example, assuming there are about ten million species in existence, the expectation is that ten species would become extinct each year (each year represents ten million species per year).
One contemporary extinction rate estimate uses the extinctions in the written record since the year 1500. For birds alone this method yields an estimate of 26 E/MSY. However, this value may be underestimated for three reasons. First, many species would not have been described until much later in the time period, so their loss would have gone unnoticed. Second, the number of recently extinct species is increasing because extinct species now are being described from skeletal remains. And third, some species are probably already extinct even though conservationists are reluctant to name them as such. Taking these factors into account raises the estimated extinction rate closer to 100 E/MSY. The predicted rate by the end of the century is 1500 E/MSY.
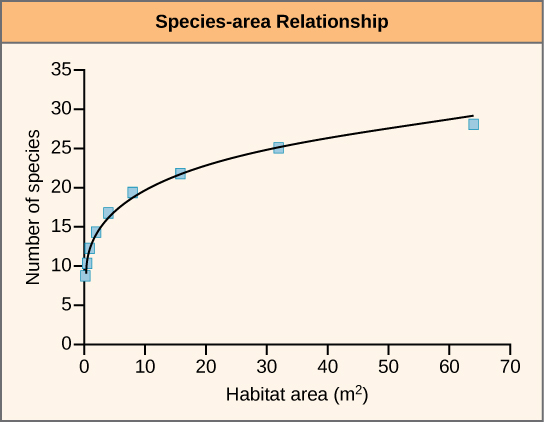
A second approach to estimating present-time extinction rates is to correlate species loss with habitat loss by measuring forest-area loss and understanding species-area relationships. The species-area relationship is the rate at which new species are seen when the area surveyed is increased. Studies have shown that the number of species present increases as the size of the island increases. This phenomenon has also been shown to hold true in other habitats as well. Turning this relationship around, if the habitat area is reduced, the number of species living there will also decline. Estimates of extinction rates based on habitat loss and species-area relationships have suggested that with about 90 percent habitat loss an expected 50 percent of species would become extinct. Species-area estimates have led to species extinction rate calculations of about 1000 E/MSY and higher. In general, actual observations do not show this amount of loss and suggestions have been made that there is a delay in extinction. Recent work has also called into question the applicability of the species-area relationship when estimating the loss of species. This work argues that the species-area relationship leads to an overestimate of extinction rates. A better relationship to use may be the endemics-area relationship. Using this method would bring estimates down to around 500 E/MSY in the coming century. Note that this value is still 500 times the background rate.
References
Birds of the World. 2020. The Cornell Lab of Ornithology. Accessed 2020-07-29.
The IUCN Red List of Threatened Species. 2020. IUCN. Accessed 2020-07-29.
Mammal Diversity Database. 2020. American Society of Mammalogists. Accessed 2020-07-29.
- 1 Mora Camilo et al., “How Many Species Are There on Earth and in the Ocean?” PLoS Biology (2011), doi:10.1371/journal.pbio.1001127.
- 2 Arthur D. Chapman, Numbers of Living Species in Australia and the World, 2nd ed. (Canberra, AU: Australian Biological Resources Study, 2009). www.environment.gov.au/biodiv...d-complete.pdf.
- 3 Brian Groombridge and Martin D. Jenkins. World Atlas of Biodiversity: Earth’s Living Resources in the 21st Century. Berkeley: University of California Press, 2002.
- 4 International Institute for Species Exploration (IISE), 2011 State of Observed Species (SOS). Tempe, AZ: IISE, 2011. Accessed May, 20, 2012. species.asu.edu/SOS.
- Brendan B. Larsen, Elizabeth C. Miller, Matthew K. Rhodes, and John J. Wiens, "Inordinate Fondness Multiplied and Redistributed: the Number of Species on Earth and the New Pie of Life," The Quarterly Review of Biology 92, no. 3 (September 2017): 229-265. DOI
-
Barnosky, A.D., Matzke, N., Tomiya, S., Wogan, G.O.U., Swartz, B., Quental, T.B., et al. (2011, March). Has the Earth's sixth mass extinction already arrived? Nature, 471, 51-57. doi:10.1038/nature09678
Vie, J-C, Hilton-Taylor, C. & Stuart S.N. (Eds.). (2009). Wildlife in a Changing World: An Analysis of the 2008 IUCN Red List of Threatened Species™. Gland, Switzerland: IUCN. Retrieved from http://data.iucn.org/dbtw-wpd/edocs/RL-2009-001.pdf.
Contributors and Attributions
Modified by Kyle Whittinghill and Melissa Ha from the following sources:
- 5.5: Preserving Biodiversity, Community Ecology and Importance of Biodiversity from Environmental Biology by Matthew R. Fisher (licensed under CC-BY)
- Preserving Biodiversity and 47.1: The Biodiversity Crisis by OpenStax, is licensed CC BY by
Connie Rye (East Mississippi Community College), Robert Wise (University of Wisconsin, Oshkosh), Vladimir Jurukovski (Suffolk County Community College), Jean DeSaix (University of North Carolina at Chapel Hill), Jung Choi (Georgia Institute of Technology), Yael Avissar (Rhode Island College) among other contributing authors. Original content by OpenStax (CC BY 4.0; Download for free at http://cnx.org/contents/185cbf87-c72...f21b5eabd@9.87).
- Biodiversity, Species Loss, and Ecosystem Function and The Industrialization of Nature: A Modern History (1500 to the present) from Sustainability: A Comprehensive Foundation by Tom Theis and Jonathan Tomkin, Editors. Download for free at CNX. (licensed under CC-BY)