
16.1: Introduction to Biodiversity
- Page ID
- 69514

\( \newcommand{\vecs}[1]{\overset { \scriptstyle \rightharpoonup} {\mathbf{#1}} } \)
\( \newcommand{\vecd}[1]{\overset{-\!-\!\rightharpoonup}{\vphantom{a}\smash {#1}}} \)
\( \newcommand{\dsum}{\displaystyle\sum\limits} \)
\( \newcommand{\dint}{\displaystyle\int\limits} \)
\( \newcommand{\dlim}{\displaystyle\lim\limits} \)
\( \newcommand{\id}{\mathrm{id}}\) \( \newcommand{\Span}{\mathrm{span}}\)
( \newcommand{\kernel}{\mathrm{null}\,}\) \( \newcommand{\range}{\mathrm{range}\,}\)
\( \newcommand{\RealPart}{\mathrm{Re}}\) \( \newcommand{\ImaginaryPart}{\mathrm{Im}}\)
\( \newcommand{\Argument}{\mathrm{Arg}}\) \( \newcommand{\norm}[1]{\| #1 \|}\)
\( \newcommand{\inner}[2]{\langle #1, #2 \rangle}\)
\( \newcommand{\Span}{\mathrm{span}}\)
\( \newcommand{\id}{\mathrm{id}}\)
\( \newcommand{\Span}{\mathrm{span}}\)
\( \newcommand{\kernel}{\mathrm{null}\,}\)
\( \newcommand{\range}{\mathrm{range}\,}\)
\( \newcommand{\RealPart}{\mathrm{Re}}\)
\( \newcommand{\ImaginaryPart}{\mathrm{Im}}\)
\( \newcommand{\Argument}{\mathrm{Arg}}\)
\( \newcommand{\norm}[1]{\| #1 \|}\)
\( \newcommand{\inner}[2]{\langle #1, #2 \rangle}\)
\( \newcommand{\Span}{\mathrm{span}}\) \( \newcommand{\AA}{\unicode[.8,0]{x212B}}\)
\( \newcommand{\vectorA}[1]{\vec{#1}} % arrow\)
\( \newcommand{\vectorAt}[1]{\vec{\text{#1}}} % arrow\)
\( \newcommand{\vectorB}[1]{\overset { \scriptstyle \rightharpoonup} {\mathbf{#1}} } \)
\( \newcommand{\vectorC}[1]{\textbf{#1}} \)
\( \newcommand{\vectorD}[1]{\overrightarrow{#1}} \)
\( \newcommand{\vectorDt}[1]{\overrightarrow{\text{#1}}} \)
\( \newcommand{\vectE}[1]{\overset{-\!-\!\rightharpoonup}{\vphantom{a}\smash{\mathbf {#1}}}} \)
\( \newcommand{\vecs}[1]{\overset { \scriptstyle \rightharpoonup} {\mathbf{#1}} } \)
\(\newcommand{\longvect}{\overrightarrow}\)
\( \newcommand{\vecd}[1]{\overset{-\!-\!\rightharpoonup}{\vphantom{a}\smash {#1}}} \)
\(\newcommand{\avec}{\mathbf a}\) \(\newcommand{\bvec}{\mathbf b}\) \(\newcommand{\cvec}{\mathbf c}\) \(\newcommand{\dvec}{\mathbf d}\) \(\newcommand{\dtil}{\widetilde{\mathbf d}}\) \(\newcommand{\evec}{\mathbf e}\) \(\newcommand{\fvec}{\mathbf f}\) \(\newcommand{\nvec}{\mathbf n}\) \(\newcommand{\pvec}{\mathbf p}\) \(\newcommand{\qvec}{\mathbf q}\) \(\newcommand{\svec}{\mathbf s}\) \(\newcommand{\tvec}{\mathbf t}\) \(\newcommand{\uvec}{\mathbf u}\) \(\newcommand{\vvec}{\mathbf v}\) \(\newcommand{\wvec}{\mathbf w}\) \(\newcommand{\xvec}{\mathbf x}\) \(\newcommand{\yvec}{\mathbf y}\) \(\newcommand{\zvec}{\mathbf z}\) \(\newcommand{\rvec}{\mathbf r}\) \(\newcommand{\mvec}{\mathbf m}\) \(\newcommand{\zerovec}{\mathbf 0}\) \(\newcommand{\onevec}{\mathbf 1}\) \(\newcommand{\real}{\mathbb R}\) \(\newcommand{\twovec}[2]{\left[\begin{array}{r}#1 \\ #2 \end{array}\right]}\) \(\newcommand{\ctwovec}[2]{\left[\begin{array}{c}#1 \\ #2 \end{array}\right]}\) \(\newcommand{\threevec}[3]{\left[\begin{array}{r}#1 \\ #2 \\ #3 \end{array}\right]}\) \(\newcommand{\cthreevec}[3]{\left[\begin{array}{c}#1 \\ #2 \\ #3 \end{array}\right]}\) \(\newcommand{\fourvec}[4]{\left[\begin{array}{r}#1 \\ #2 \\ #3 \\ #4 \end{array}\right]}\) \(\newcommand{\cfourvec}[4]{\left[\begin{array}{c}#1 \\ #2 \\ #3 \\ #4 \end{array}\right]}\) \(\newcommand{\fivevec}[5]{\left[\begin{array}{r}#1 \\ #2 \\ #3 \\ #4 \\ #5 \\ \end{array}\right]}\) \(\newcommand{\cfivevec}[5]{\left[\begin{array}{c}#1 \\ #2 \\ #3 \\ #4 \\ #5 \\ \end{array}\right]}\) \(\newcommand{\mattwo}[4]{\left[\begin{array}{rr}#1 \amp #2 \\ #3 \amp #4 \\ \end{array}\right]}\) \(\newcommand{\laspan}[1]{\text{Span}\{#1\}}\) \(\newcommand{\bcal}{\cal B}\) \(\newcommand{\ccal}{\cal C}\) \(\newcommand{\scal}{\cal S}\) \(\newcommand{\wcal}{\cal W}\) \(\newcommand{\ecal}{\cal E}\) \(\newcommand{\coords}[2]{\left\{#1\right\}_{#2}}\) \(\newcommand{\gray}[1]{\color{gray}{#1}}\) \(\newcommand{\lgray}[1]{\color{lightgray}{#1}}\) \(\newcommand{\rank}{\operatorname{rank}}\) \(\newcommand{\row}{\text{Row}}\) \(\newcommand{\col}{\text{Col}}\) \(\renewcommand{\row}{\text{Row}}\) \(\newcommand{\nul}{\text{Nul}}\) \(\newcommand{\var}{\text{Var}}\) \(\newcommand{\corr}{\text{corr}}\) \(\newcommand{\len}[1]{\left|#1\right|}\) \(\newcommand{\bbar}{\overline{\bvec}}\) \(\newcommand{\bhat}{\widehat{\bvec}}\) \(\newcommand{\bperp}{\bvec^\perp}\) \(\newcommand{\xhat}{\widehat{\xvec}}\) \(\newcommand{\vhat}{\widehat{\vvec}}\) \(\newcommand{\uhat}{\widehat{\uvec}}\) \(\newcommand{\what}{\widehat{\wvec}}\) \(\newcommand{\Sighat}{\widehat{\Sigma}}\) \(\newcommand{\lt}{<}\) \(\newcommand{\gt}{>}\) \(\newcommand{\amp}{&}\) \(\definecolor{fillinmathshade}{gray}{0.9}\)Biodiversity is a broad term for biological variety, and it can be measured at a number of organizational levels. A common meaning of biodiversity is simply the number of species in a location or on Earth; for example, the American Ornithologists’ Union lists 2078 species of birds in North and Central America. This is one measure of the bird biodiversity on the continent. More sophisticated measures or of diversity (diversity indexes) take into account the relative abundances of species (i.e. both the number of species and the number of individuals in each of those species). For example, a forest with 10 equally common species of trees is more diverse than a forest that has 10 species of trees wherein just one of those species makes up 95 percent of the trees rather than them being equally distributed. These estimation indexes, which came from information theory, are most useful as a first step in quantifying biodiversity between and within ecosystems; they are less useful when the main concern among conservation biologists is simply the loss of biodiversity. However, biologists recognize that measures of biodiversity, in terms of species diversity, may help focus efforts to preserve the biologically or technologically important elements of biodiversity. Biologists are also now using measures of biodiversity at other levels of biological organization (including genes, populations, and ecosystems).
The Lake Victoria cichlids provide an example through which we can begin to understand biodiversity (Figure \(\PageIndex{1}\)). The biologists studying cichlids in the 1980s discovered hundreds of cichlid species representing a variety of specializations to particular habitat types and specific feeding strategies: eating plankton floating in the water, scraping and then eating algae from rocks, eating insect larvae from the bottom, and eating the eggs of other species of cichlid. The cichlids of Lake Victoria are the product of an adaptive radiation. An adaptive radiation is a rapid (less than three million years in the case of the Lake Victoria cichlids) branching through speciation of a phylogenetic tree into many closely related species; typically, the species “radiate” into different habitats and niches. The Galápagos finches are an example of a modest adaptive radiation with 15 species. The cichlids of Lake Victoria are an example of a spectacular adaptive radiation that includes about 500 species.
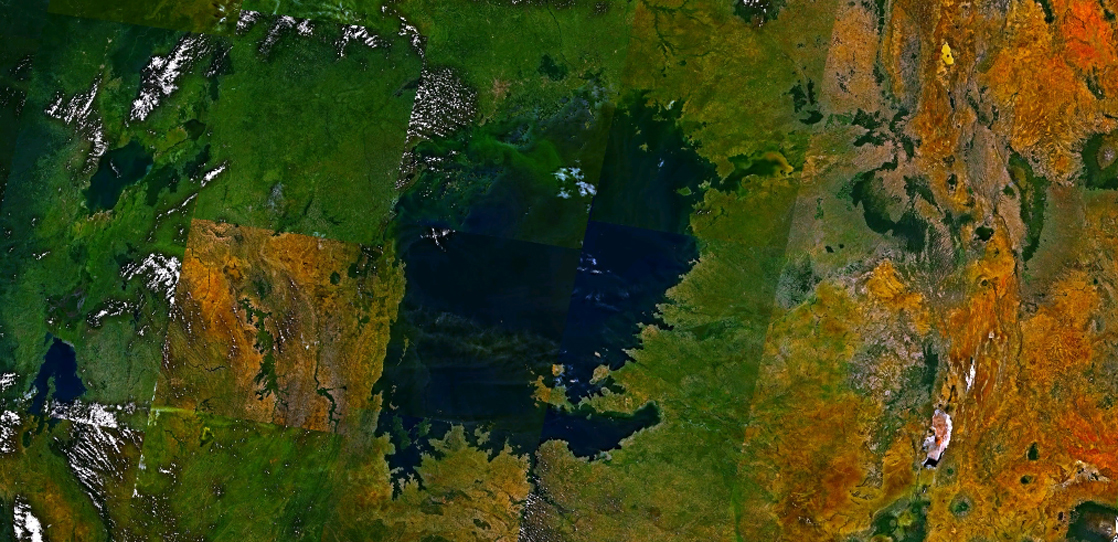
Figure \(\PageIndex{1}\): Lake Victoria in Africa, shown in this satellite image, was the site of one of the most extraordinary evolutionary findings on the planet, as well as a casualty of devastating biodiversity loss. (credit: modification of work by Rishabh Tatiraju, using NASA World Wind software)
t the time biologists were making this discovery, some species began to quickly disappear. A culprit in these declines was a species of large fish that was introduced to Lake Victoria by fisheries to feed the people living around the lake. The Nile perch was introduced in 1963, but lay low until the 1980's when its populations began to surge. The Nile perch population grew by consuming cichlids, driving species after species to the point of extinction (the disappearance of a species). In fact, there were several factors that played a role in the extinction of perhaps 200 cichlid species in Lake Victoria: the Nile perch, declining lake water quality due to agriculture and land clearing on the shores of Lake Victoria, and increased fishing pressure. Scientists had not even cataloged all of the species present—so many were lost that were never named. The diversity is now a shadow of what it once was.
The cichlids of Lake Victoria are a thumbnail sketch of contemporary rapid species loss that occurs all over Earth and is caused by human activity. Extinction is a natural process of macroevolution that occurs at the rate of about one out of 1 million species becoming extinct per year. The fossil record reveals that there have been five periods of mass extinction in history with much higher rates of species loss, and the rate of species loss today is comparable to those periods of mass extinction. However, there is a major difference between the previous mass extinctions and the current extinction we are experiencing: human activity. Specifically, three human activities have a major impact: destruction of habitat, introduction of exotic species, and over-harvesting. Predictions of species loss within the next century, a tiny amount of time on geological timescales, range from 10 percent to 50 percent. Extinctions on this scale have only happened five other times in the history of the planet, and they have been caused by cataclysmic events that changed the course of the history of life in each instance. Earth is now in one of those times.
Species Diversity
Species diversity is the number of different species in a particular area and their relative abundance. The area in question could be a habitat, a biome, or the entire biosphere. Areas with low species diversity, such as the glaciers of Antarctica, still contain a wide variety of living organisms, whereas the diversity of tropical rainforests is so great that it cannot be accurately assessed. Species richness, the number of species living in a habitat or other unit, is one component of biodiversity. Species evenness is a component of species diversity based on relative abundance (the number individuals in a species relative to the total number of individuals in all species within a system). Foundation species often have the highest relative abundance of species. Two locations with the same richness do not necessarily have the same species evenness. For example, both communities in figure \(\PageIndex{2}\) have three different trees species and thus a species richness of three. However, there is a dominant species (represented by six individuals) in community #1. In community #2, there are three of individuals of each species. Therefore, community #2 has a greater species evenness and greater species diversity overall.
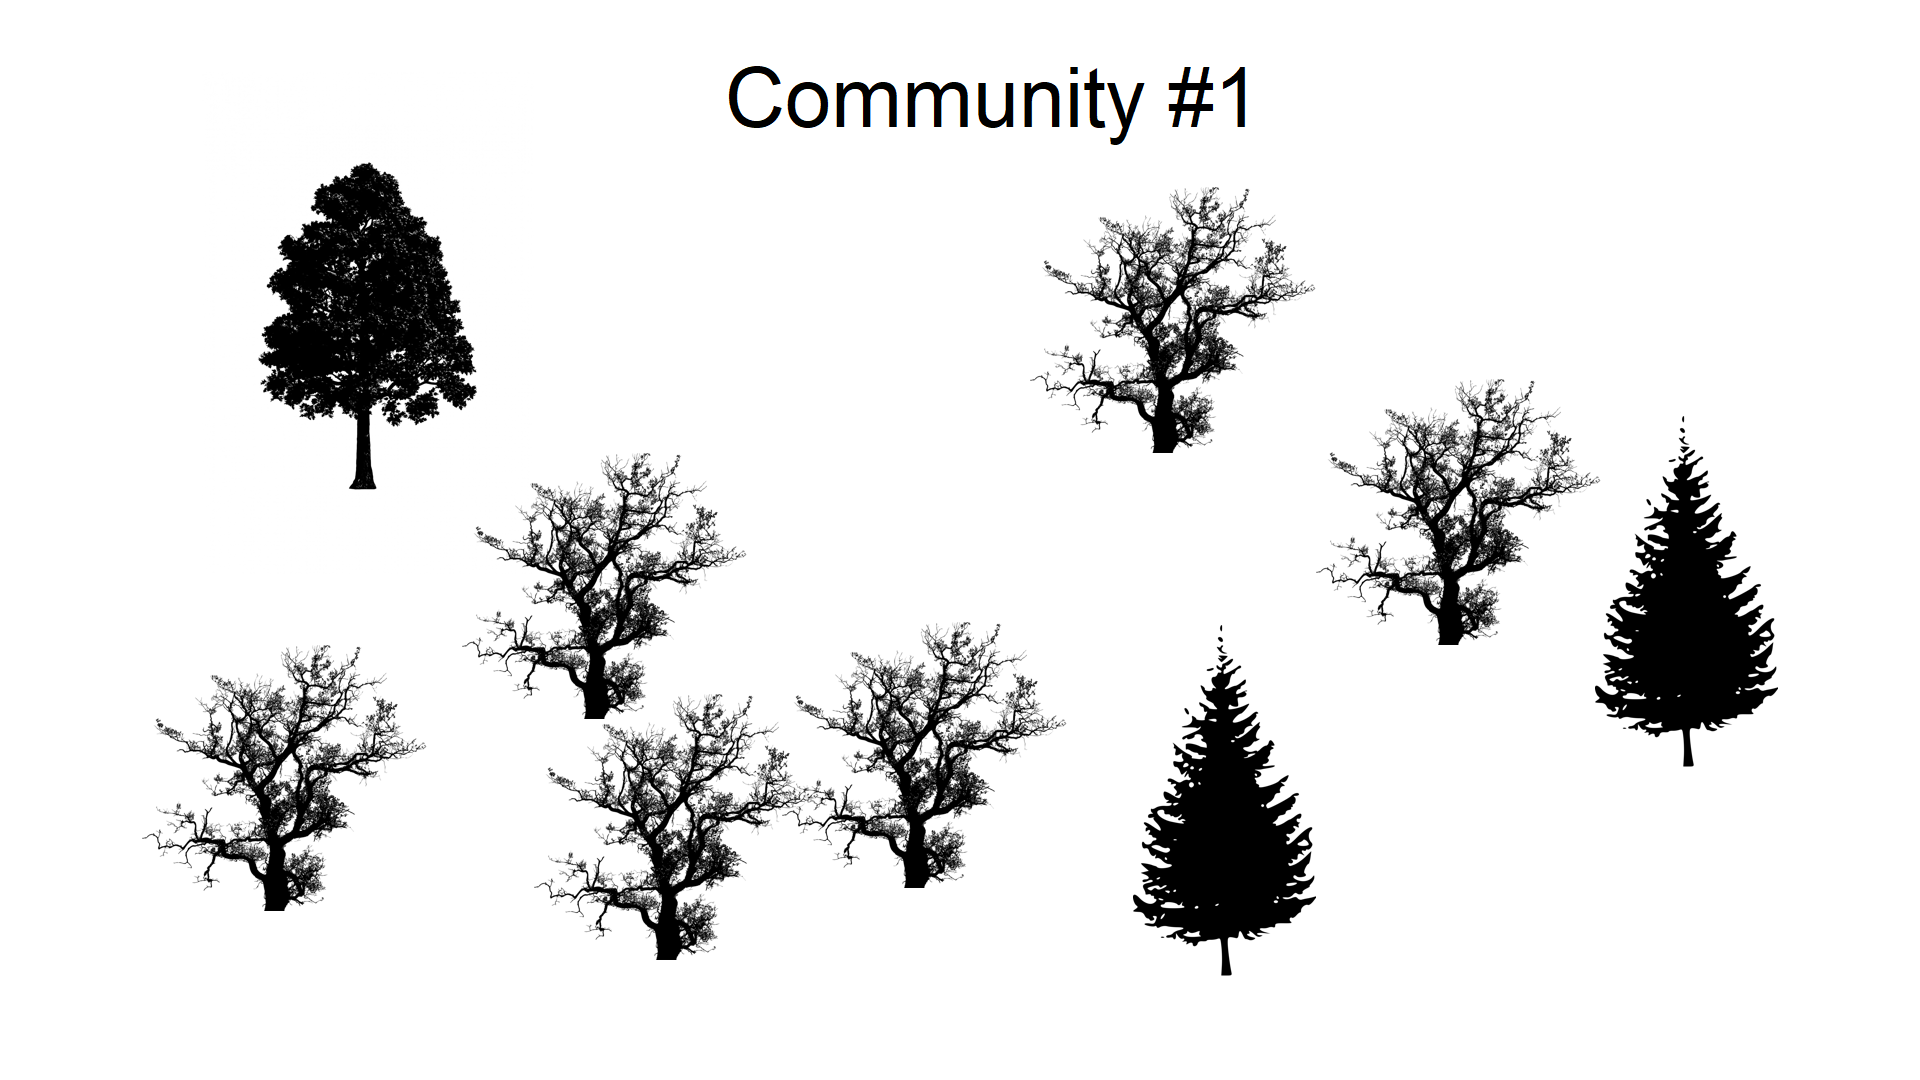
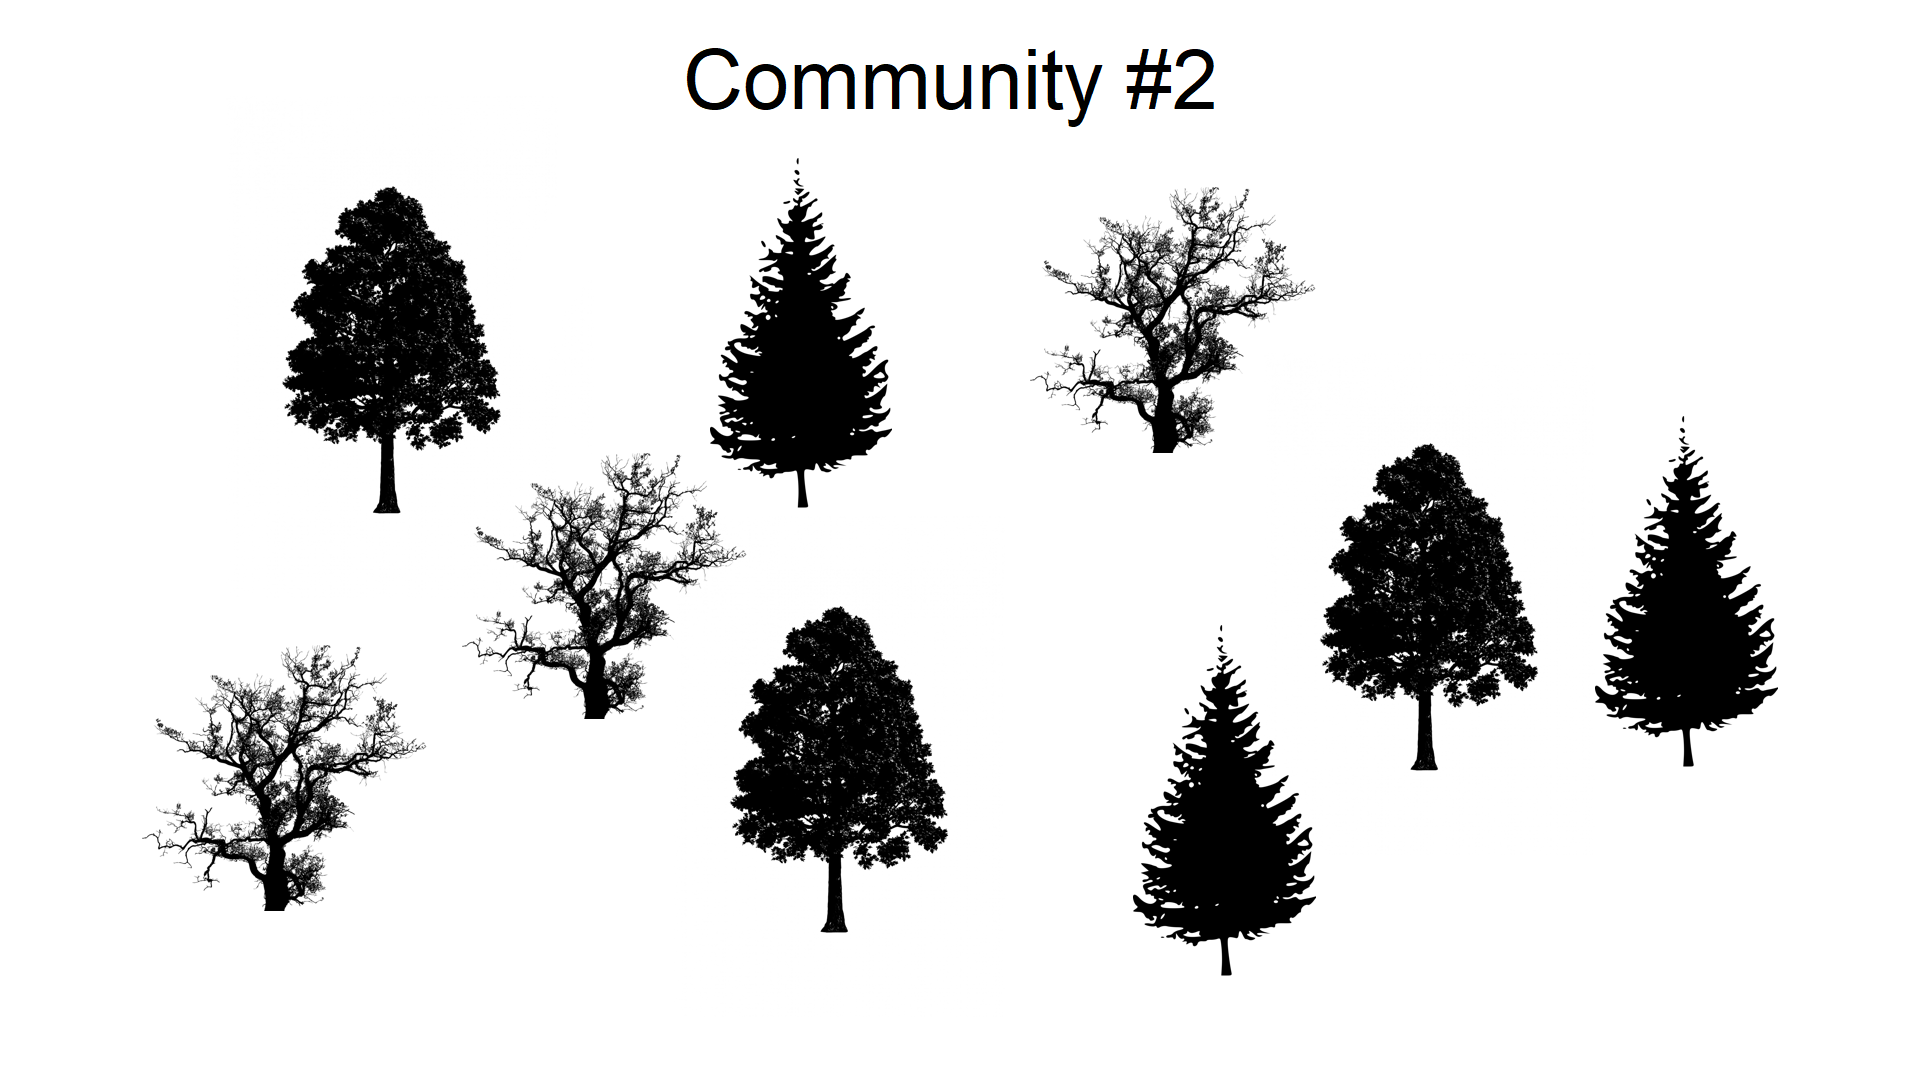
Figure \(\PageIndex{2}\): Two hypothetical tree communities have the same species richness, but community #2 (bottom) has a greater species evenness. Both communities have nine trees and three tree species. In community #1, one species is dominant, represented by six individuals. There are two individuals of a conifer species, and only one individual of the final species. In community #2, there are three individuals from each species. Images compiled by Melissa Ha from Alone tree George Hodan, Old Tree Silhouette, and Tree (all public domain).
Other Types of Biodiversity
Scientists generally accept that the term biodiversity describes the number and kinds of species in a location or on the planet. Species can be difficult to define, but most biologists still feel comfortable with the concept and are able to identify and count eukaryotic species in most contexts. Biologists have also identified alternate measures of biodiversity, some of which are important for planning how to preserve biodiversity.
Genetic diversity is one of those alternate concepts. Genetic diversity (or variation) is the raw material for adaptation in a species. A species’ future potential for adaptation depends on the genetic diversity held in the genomes of the individuals in populations that make up the species. The same is true for higher taxonomic categories. A genus with very different types of species will have more genetic diversity than a genus with species that look alike and have similar ecologies. If there were a choice between one of these genera of species being preserved, the one with the greatest potential for subsequent evolution is the most genetically diverse one. It would be ideal not to have to make such choices, but increasingly this may be the norm.
Most genes code for proteins, which in turn carry out the metabolic processes that keep organisms alive and reproducing. Genetic diversity can be measured as chemical diversity in that different species produce a variety of chemicals in their cells, both the proteins as well as the products and byproducts of metabolism. This chemical diversity is important for humans because of the potential uses for these chemicals, such as medications. For example, the drug eptifibatide is derived from rattlesnake venom and is used to prevent heart attacks in individuals with certain heart conditions. At present, it is far cheaper to discover compounds made by an organism than to imagine them and then synthesize them in a laboratory. Chemical diversity is one way to measure diversity that is important to human health and welfare.
Humans have generated diversity in domestic animals, plants, and fungi through selective breeding. But even this diversity is suffering losses because of market forces and increasing globalism in human agriculture and migration, especially in heavily populated regions such as China, India, and Japan. For example, international seed companies produce only a very few varieties of a given crop and provide incentives around the world for farmers to buy these few varieties while abandoning their traditional varieties, which are far more diverse. The human population depends on crop diversity directly as a stable food source and its decline is troubling to biologists and agricultural scientists.
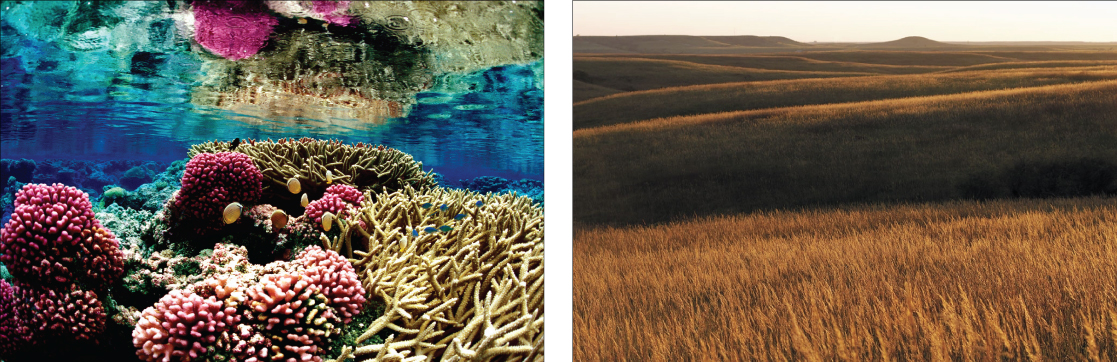
It is also useful to define ecosystem diversity, meaning the number of different ecosystems on the planet or in a given geographic area. Whole ecosystems can disappear even if some of the species might survive by adapting to other ecosystems. The loss of an ecosystem means the loss of interactions between species, the loss of unique features of coadaptation, and the loss of biological productivity that an ecosystem is able to create. An example of a largely extinct ecosystem in North America is the prairie ecosystem (Figure \(\PageIndex{3}\)). Prairies once spanned central North America from the boreal forest in northern Canada down into Mexico. They are now all but gone, replaced by crop fields, pasture lands, and suburban sprawl. Many of the species survive, but the hugely productive ecosystem that was responsible for creating the most productive agricultural soils is now gone. As a consequence, soils are disappearing or must be maintained at greater expense. The decline in soil productivity occurs because the interactions in the original ecosystem have been lost; this was a far more important loss to humans than the relatively few species that were driven extinct when the prairie ecosystem was destroyed.
Current Species Diversity
Despite considerable effort, knowledge of the species that inhabit the planet is limited. About 1.5 million species have been described, but many more species are yet to be identified. Estimates of the total number of species on Earth range from 3 million to 100 million, with more recent estimates commonly ranging from 8 to 11 million species. A 2011 study suggests that only 13% of eukaryotic species (such as plants, animals, fungi, and algae) have been named (Table \(\PageIndex{1}\) . Estimates of numbers of prokaryotic species (such as bacteria) are largely guesses, but biologists agree that science has only just begun to catalog their diversity. In fact, a 2017 study by Brendan Larsen and colleagues estimated that there are actually 1-6 billion species on Earth with at least 70% of them being bacteria. Given that Earth is losing species at an accelerating pace, science knows little about what is being lost.
Table \(\PageIndex{1}\): Estimates of the described and predicted species by Taxonomic group
| Mora et al. 20111 | Chapman 20092 | Groombridge & Jenkins 20023 | ||||
|---|---|---|---|---|---|---|
| Described | Predicted | Described | Predicted | Described | Predicted | |
| Animalia | 1,124,516 | 9,920,000 | 1,424,153 | 6,836,330 | 1,225,500 | 10,820,000 |
| Chromista | 17,892 | 34,900 | 25,044 | 200,500 | — | — |
| Fungi | 44,368 | 616,320 | 98,998 | 1,500,000 | 72,000 | 1,500,000 |
| Plantae | 224,244 | 314,600 | 310,129 | 390,800 | 270,000 | 320,000 |
| Protozoa | 16,236 | 72,800 | 28,871 | 1,000,000 | 80,000 | 600,000 |
| Prokaryotes | — | — | 10,307 | 1,000,000 | 10,175 | — |
| Total | 1,438,769 | 10,960,000 | 1,897,502 | 10,897,630 | 1,657,675 | 13,240,000 |
There are various initiatives to catalog described species in accessible and more organized ways, and the internet is facilitating that effort. Nevertheless, at the current rate of species description, which according to the State of Observed Species reports is 17,000–20,000 new species a year, it would take close to 500 years to describe all of the species currently in existence. The task, however, is becoming increasingly impossible over time as extinction removes species from Earth faster than they can be described.
Naming and counting species may seem an unimportant pursuit given the other needs of humanity, but it is not simply an accounting. Describing species is a complex process by which biologists determine an organism’s unique characteristics and whether or not that organism belongs to any other described species. It allows biologists to find and recognize the species after the initial discovery to follow up on questions about its biology. In addition, the unique characteristics of each species make it potentially valuable to humans or other species on which humans depend. Understanding these characteristics is the value of finding and naming species.
DNA Barcoding
The technology of molecular genetics and data processing and storage are maturing to the point where cataloging the planet’s species in an accessible way is close to feasible. DNA barcoding is one molecular genetic method, which takes advantage of a specialized structures inside of some cells called mitochondria (figure \(\PageIndex{4}\)). Mitochondria contain DNA that is separate from the rest of the cell, and one of the genes in mitochondrial DNA changes more quickly through the process of evolution than regular DNA. While plants contain mitochondria, DNA from their chloroplasts, the specialized structures in which photosynthesis occurs, are more often barcoded. Rapid DNA sequencing technology make the molecular genetics portion of the work relatively inexpensive and quick. Computer resources store and make available the large volumes of data. Projects are currently underway to use DNA barcoding to catalog museum specimens, which have already been named and studied, as well as testing the method on less studied groups. As of mid 2012, close to 150,000 named species had been barcoded. Early studies suggest there are significant numbers of undescribed species that looked too much like sibling species to previously be recognized as different. These now can be identified with DNA barcoding.
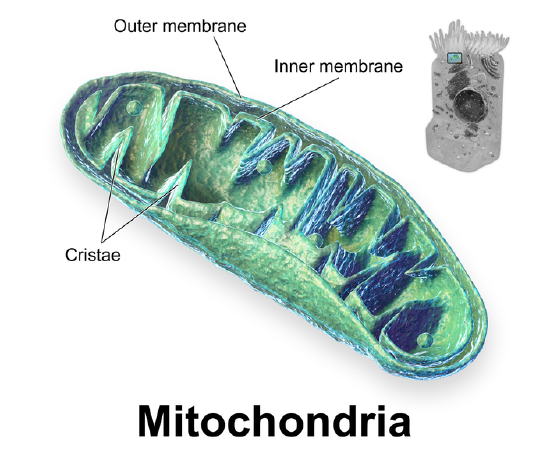
Figure \(\PageIndex{4}\): Mitochondria are specialized structures inside of eukaryotic cells. They contain separate DNA, and mitochondrial DNA contains a rapidly evolving gene used for DNA barcoding. Image by Blausen.com staff (2014). "Medical gallery of Blausen Medical 2014". WikiJournal of Medicine 1 (2). DOI:10.15347/wjm/2014.010. ISSN 2002-4436. (CC-BY)
Patterns of Biodiversity
Biodiversity is not evenly distributed on Earth. Lake Victoria contained almost 500 species of cichlids alone, ignoring the other fish families present in the lake. All of these species were found only in Lake Victoria; therefore, the 500 species of cichlids were endemic. Endemic species are found in only one location. For example, the blue jay is endemic to North America, while the Barton Springs salamander is endemic to the mouth of one spring in Austin, Texas. Endemics with highly restricted distributions, like the Barton Springs salamander, are particularly vulnerable to extinction. Higher taxonomic levels, such as genera and families, can also be endemic. Lake Huron contains about 79 species of fish, all of which are found in many other lakes in North America. What accounts for the difference in fish diversity in these two lakes? Lake Victoria is a tropical lake, while Lake Huron is a temperate lake. Lake Huron in its present form is only about 7,000 years old, while Lake Victoria in its present form is about 15,000 years old. Biogeographers have suggested these two factors, latitude and age, are two of several hypotheses to explain biodiversity patterns on the planet.
Career Connection: Biogeographer
Biogeography is the study of the distribution of the world’s species—both in the past and in the present. The work of biogeographers is critical to understanding our physical environment, how the environment affects species, and how environmental changes impact the distribution of a species; it has also been critical to developing evolutionary theory. Biogeographers need to understand both biology and ecology. They also need to be well-versed in evolutionary studies, soil science, and climatology.
There are three main fields of study under the heading of biogeography: ecological biogeography, historical biogeography (called paleobiogeography), and conservation biogeography. Ecological biogeography studies the current factors affecting the distribution of plants and animals. Historical biogeography, as the name implies, studies the past distribution of species. Conservation biogeography, on the other hand, is focused on the protection and restoration of species based upon known historical and current ecological information. Each of these fields considers both zoogeography and phytogeography—the past and present distribution of animals and plants.
One of the oldest observed patterns in ecology is that species biodiversity in almost every taxonomic group increases as latitude declines. In other words, biodiversity increases closer to the equator (Figure \(\PageIndex{5}\)).
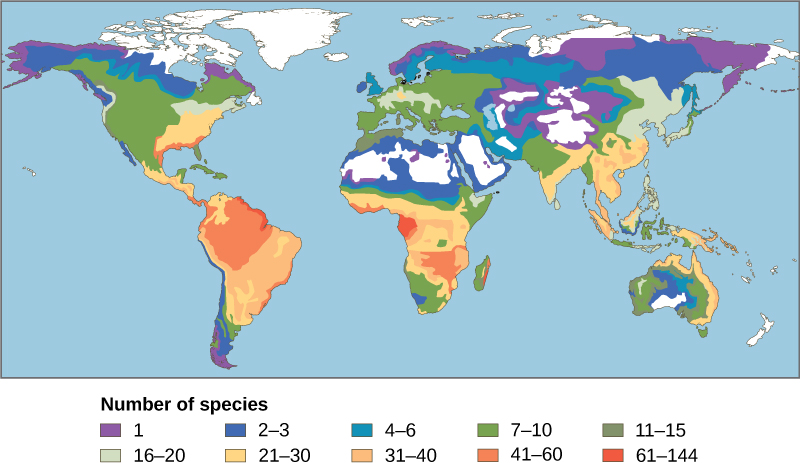
It is not yet clear why biodiversity increases closer to the equator, but hypotheses include the greater age of the ecosystems in the tropics versus temperate regions that were largely devoid of life or drastically impoverished during the last glaciation. The idea is that greater age provides more time for speciation. Another possible explanation is the increased energy the tropics receive from the sun versus the decreased energy that temperate and polar regions receive. It is not entirely clear how greater energy input could translate into more species. The complexity of tropical ecosystems may promote speciation by increasing the heterogeneity, or number of ecological niches, in the tropics relative to higher latitudes. The greater heterogeneity provides more opportunities for coevolution, specialization, and perhaps greater selection pressures leading to population differentiation. However, this hypothesis suffers from some circularity—ecosystems with more species encourage speciation, but how did they get more species to begin with? The tropics have been perceived as being more stable than temperate regions, which have a pronounced climate and day-length seasonality. The tropics have their own forms of seasonality, such as rainfall, but they are generally assumed to be more stable environments and this stability might promote speciation.
Regardless of the mechanisms, it is certainly true that biodiversity is greatest in the tropics. The number of endemic species is higher in the tropics. The tropics also contain more biodiversity hotspots. At the same time, our knowledge of the species living in the tropics is lowest and because of recent, heavy human activity the potential for biodiversity loss is greatest.
Biodiversity Hotspots
In 1988, British environmentalist Norman Myers developed a conservation concept to identify geographical areas rich in species and at significant risk for species loss: biodiversity hotspots. Biodiversity hotspots are geographical areas that contain high numbers of endemic species. Endemic species are found in only one location. For example, all of cichlid species found in Lake Victoria only occurred there. The blue jay is endemic to North America, while the Barton Springs salamander is endemic to the mouth of one spring in Austin, Texas. Endemic species with highly restricted distributions, like the Barton Springs salamander, are particularly vulnerable to extinction. If a population of a widespread species declines in one region, individuals from another region may be able to recolonize the first location, but this is not possible for endemic species. Endemic species are particularly common in isolated regions, such as mountaintops or islands. Endemism is especially likely on islands that are large and far from the mainland.
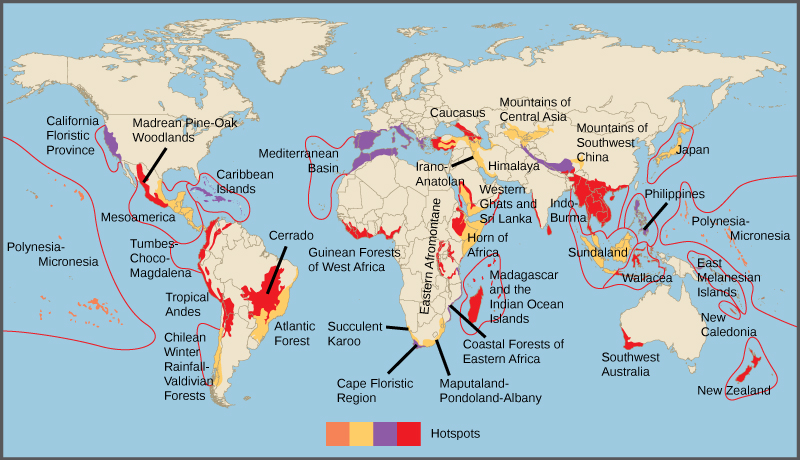
The purpose of the biodiversity hotspot concept was to identify important locations on the planet for conservation efforts, a kind of conservation triage. By protecting hotspots, governments are able to protect a larger number of species. The original criteria for a hotspot included the presence of 1500 or more endemic plant species and 70 percent of the area disturbed by human activity. There are now 34 biodiversity hotspots (Figure \(\PageIndex{6}\)) containing large numbers of endemic species, which include half of Earth’s endemic plants.
Case Study: Biodiversity Hotspots in South Africa
A rich species diversity is found in South Africa. With a land surface of approximately 148,000 km2 (about 57,000 square miles), representing approximately 1% of the Earth's total surface, South Africa contains 10% of the world's total known bird, fish and plant species, and 6% of the world's mammal and reptile species.
This natural wealth is threatened by the expansion of the human population and the increasing demand this places on the environment. The Karoo (figure \(\PageIndex{7}\)) and the Cape are biodiversity hotspots in South Africa. South Africa has a wide range of climatic conditions and many variations in landscape, creating a variety of ecological niches, which can promote species diversity. These various landscapes give rise to the biomes which allow a wide variety of life to survive.
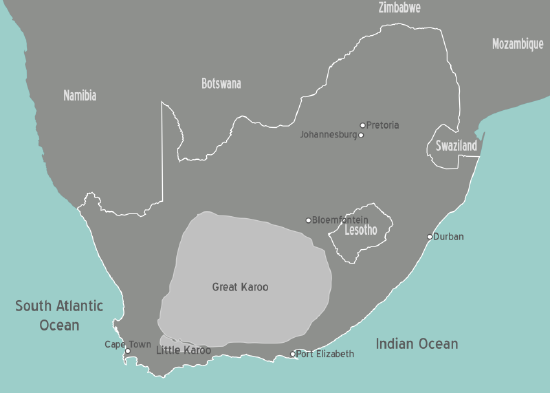
Figure \(\PageIndex{7}\): Map of South Africa, illustrating the Karoo, a dry region with hot summers and cold winters. Image by (WT-shared) NJR ZA at wts wikivoyage (CC-BY-SA).
More than 20,300 species of flowering plants occur in South Africa (figure \(\PageIndex{8}\)). One of the six most important areas of plant growth in the world is in the Western Cape. Most of the 2,000 threatened species of plants are found in the fynbos in South-West Cape (figure \(\PageIndex{9}\)).
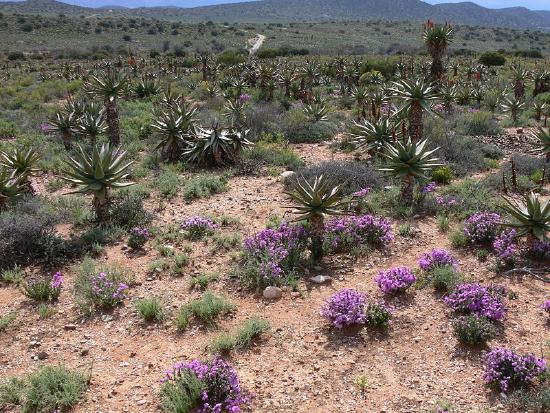
Figure \(\PageIndex{8}\): Vegetation of the Karoo in near Willowmore, Eastern Cape, South Africa. Image by Winfried Bruenken (CC-BY-SA).
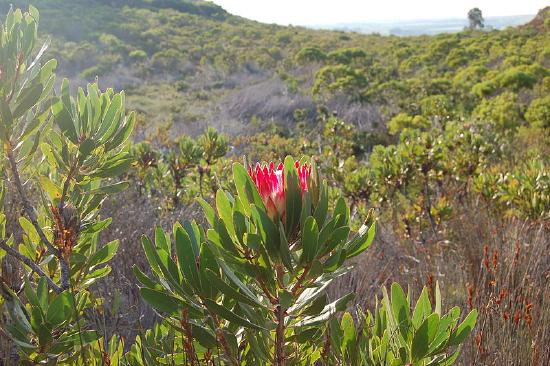
Figure \(\PageIndex{9}\): Vegetation of the fynbos in Western Cape, South Africa. Image by Joachim Huber (CC-BY-SA).
South Africa is home to 243 mammal species. Among the 17 threatened species in South Africa are the black rhino, pangolin, and giant golden mole. The blue antelope and quagga (figure \(\PageIndex{10}\)) have become extinct. Of more than 800 bird species, 26 are threatened, including the penguin, Cape vulture, martial eagle (figure \(\PageIndex{11}\)), and Cape parrot. In total 370 reptiles and amphibians occur in the region of which 21 are threatened. Six of these are endangered. Of the 220 freshwater fishes in South Africa, 21 are threatened. There are more than 2,000 marine fish species. While many insect species remain unidentified, 80,000 insects are known to occur.
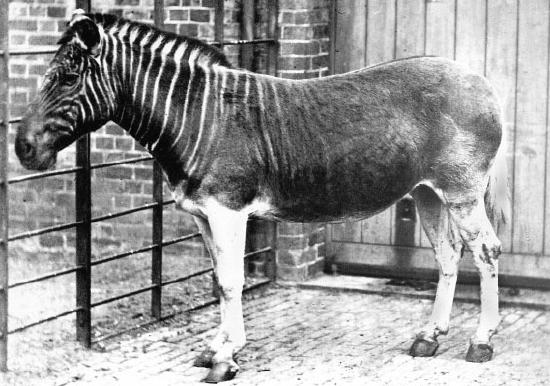
Figure \(\PageIndex{10}\): The quagga (Equus quagga quagga), now extinct, is technically a subspecies of the plains zebra. Image by Stanford Woods (public domain).
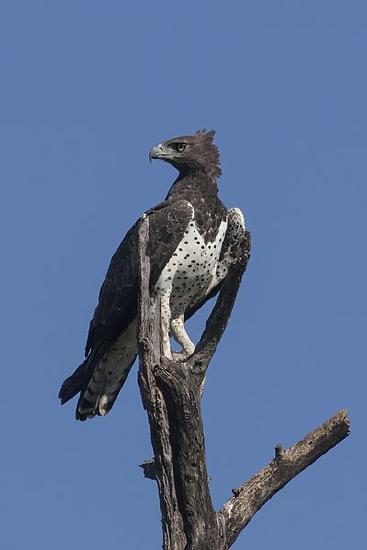
Figure \(\PageIndex{11}\): The Martial Eagle (Polemaetus bellicosus) is one of the threatened bird species found in South Africa. Image by Charles J. Sharp (CC-BY-SA).
Footnotes
- 1 Mora Camilo et al., “How Many Species Are There on Earth and in the Ocean?” PLoS Biology (2011), doi:10.1371/journal.pbio.1001127.
- 2 Arthur D. Chapman, Numbers of Living Species in Australia and the World, 2nd ed. (Canberra, AU: Australian Biological Resources Study, 2009). www.environment.gov.au/biodiv...d-complete.pdf.
- 3 Brian Groombridge and Martin D. Jenkins. World Atlas of Biodiversity: Earth’s Living Resources in the 21st Century. Berkeley: University of California Press, 2002.
- 4 International Institute for Species Exploration (IISE), 2011 State of Observed Species (SOS). Tempe, AZ: IISE, 2011. Accessed May, 20, 2012. species.asu.edu/SOS.
- Brendan B. Larsen, Elizabeth C. Miller, Matthew K. Rhodes, and John J. Wiens, "Inordinate Fondness Multiplied and Redistributed: the Number of Species on Earth and the New Pie of Life," The Quarterly Review of Biology 92, no. 3 (September 2017): 229-265. DOI
Contributors and Attributions
Modified by Kyle Whittinghill and Melissa Ha from the following sources:
- Community Ecology and Importance of Biodiversity from Environmental Biology by Matthew R. Fisher (licensed under CC-BY)
- Preserving Biodiversity and 47.1: The Biodiversity Crisis by OpenStax, is licensed CC BY by
Connie Rye (East Mississippi Community College), Robert Wise (University of Wisconsin, Oshkosh), Vladimir Jurukovski (Suffolk County Community College), Jean DeSaix (University of North Carolina at Chapel Hill), Jung Choi (Georgia Institute of Technology), Yael Avissar (Rhode Island College) among other contributing authors. Original content by OpenStax (CC BY 4.0; Download for free at http://cnx.org/contents/185cbf87-c72...f21b5eabd@9.87).
- The Biodiverisity Crisis and Prelude to Conservation Biology and Biodiversity from General Biology by OpenStax (licensed under CC-BY)
- Biodiversity and Biomes from Life Sciences Grade 10 by Siyavula (CC-BY)