
14.3: Human Population Growth
- Page ID
- 69500

\( \newcommand{\vecs}[1]{\overset { \scriptstyle \rightharpoonup} {\mathbf{#1}} } \)
\( \newcommand{\vecd}[1]{\overset{-\!-\!\rightharpoonup}{\vphantom{a}\smash {#1}}} \)
\( \newcommand{\dsum}{\displaystyle\sum\limits} \)
\( \newcommand{\dint}{\displaystyle\int\limits} \)
\( \newcommand{\dlim}{\displaystyle\lim\limits} \)
\( \newcommand{\id}{\mathrm{id}}\) \( \newcommand{\Span}{\mathrm{span}}\)
( \newcommand{\kernel}{\mathrm{null}\,}\) \( \newcommand{\range}{\mathrm{range}\,}\)
\( \newcommand{\RealPart}{\mathrm{Re}}\) \( \newcommand{\ImaginaryPart}{\mathrm{Im}}\)
\( \newcommand{\Argument}{\mathrm{Arg}}\) \( \newcommand{\norm}[1]{\| #1 \|}\)
\( \newcommand{\inner}[2]{\langle #1, #2 \rangle}\)
\( \newcommand{\Span}{\mathrm{span}}\)
\( \newcommand{\id}{\mathrm{id}}\)
\( \newcommand{\Span}{\mathrm{span}}\)
\( \newcommand{\kernel}{\mathrm{null}\,}\)
\( \newcommand{\range}{\mathrm{range}\,}\)
\( \newcommand{\RealPart}{\mathrm{Re}}\)
\( \newcommand{\ImaginaryPart}{\mathrm{Im}}\)
\( \newcommand{\Argument}{\mathrm{Arg}}\)
\( \newcommand{\norm}[1]{\| #1 \|}\)
\( \newcommand{\inner}[2]{\langle #1, #2 \rangle}\)
\( \newcommand{\Span}{\mathrm{span}}\) \( \newcommand{\AA}{\unicode[.8,0]{x212B}}\)
\( \newcommand{\vectorA}[1]{\vec{#1}} % arrow\)
\( \newcommand{\vectorAt}[1]{\vec{\text{#1}}} % arrow\)
\( \newcommand{\vectorB}[1]{\overset { \scriptstyle \rightharpoonup} {\mathbf{#1}} } \)
\( \newcommand{\vectorC}[1]{\textbf{#1}} \)
\( \newcommand{\vectorD}[1]{\overrightarrow{#1}} \)
\( \newcommand{\vectorDt}[1]{\overrightarrow{\text{#1}}} \)
\( \newcommand{\vectE}[1]{\overset{-\!-\!\rightharpoonup}{\vphantom{a}\smash{\mathbf {#1}}}} \)
\( \newcommand{\vecs}[1]{\overset { \scriptstyle \rightharpoonup} {\mathbf{#1}} } \)
\(\newcommand{\longvect}{\overrightarrow}\)
\( \newcommand{\vecd}[1]{\overset{-\!-\!\rightharpoonup}{\vphantom{a}\smash {#1}}} \)
\(\newcommand{\avec}{\mathbf a}\) \(\newcommand{\bvec}{\mathbf b}\) \(\newcommand{\cvec}{\mathbf c}\) \(\newcommand{\dvec}{\mathbf d}\) \(\newcommand{\dtil}{\widetilde{\mathbf d}}\) \(\newcommand{\evec}{\mathbf e}\) \(\newcommand{\fvec}{\mathbf f}\) \(\newcommand{\nvec}{\mathbf n}\) \(\newcommand{\pvec}{\mathbf p}\) \(\newcommand{\qvec}{\mathbf q}\) \(\newcommand{\svec}{\mathbf s}\) \(\newcommand{\tvec}{\mathbf t}\) \(\newcommand{\uvec}{\mathbf u}\) \(\newcommand{\vvec}{\mathbf v}\) \(\newcommand{\wvec}{\mathbf w}\) \(\newcommand{\xvec}{\mathbf x}\) \(\newcommand{\yvec}{\mathbf y}\) \(\newcommand{\zvec}{\mathbf z}\) \(\newcommand{\rvec}{\mathbf r}\) \(\newcommand{\mvec}{\mathbf m}\) \(\newcommand{\zerovec}{\mathbf 0}\) \(\newcommand{\onevec}{\mathbf 1}\) \(\newcommand{\real}{\mathbb R}\) \(\newcommand{\twovec}[2]{\left[\begin{array}{r}#1 \\ #2 \end{array}\right]}\) \(\newcommand{\ctwovec}[2]{\left[\begin{array}{c}#1 \\ #2 \end{array}\right]}\) \(\newcommand{\threevec}[3]{\left[\begin{array}{r}#1 \\ #2 \\ #3 \end{array}\right]}\) \(\newcommand{\cthreevec}[3]{\left[\begin{array}{c}#1 \\ #2 \\ #3 \end{array}\right]}\) \(\newcommand{\fourvec}[4]{\left[\begin{array}{r}#1 \\ #2 \\ #3 \\ #4 \end{array}\right]}\) \(\newcommand{\cfourvec}[4]{\left[\begin{array}{c}#1 \\ #2 \\ #3 \\ #4 \end{array}\right]}\) \(\newcommand{\fivevec}[5]{\left[\begin{array}{r}#1 \\ #2 \\ #3 \\ #4 \\ #5 \\ \end{array}\right]}\) \(\newcommand{\cfivevec}[5]{\left[\begin{array}{c}#1 \\ #2 \\ #3 \\ #4 \\ #5 \\ \end{array}\right]}\) \(\newcommand{\mattwo}[4]{\left[\begin{array}{rr}#1 \amp #2 \\ #3 \amp #4 \\ \end{array}\right]}\) \(\newcommand{\laspan}[1]{\text{Span}\{#1\}}\) \(\newcommand{\bcal}{\cal B}\) \(\newcommand{\ccal}{\cal C}\) \(\newcommand{\scal}{\cal S}\) \(\newcommand{\wcal}{\cal W}\) \(\newcommand{\ecal}{\cal E}\) \(\newcommand{\coords}[2]{\left\{#1\right\}_{#2}}\) \(\newcommand{\gray}[1]{\color{gray}{#1}}\) \(\newcommand{\lgray}[1]{\color{lightgray}{#1}}\) \(\newcommand{\rank}{\operatorname{rank}}\) \(\newcommand{\row}{\text{Row}}\) \(\newcommand{\col}{\text{Col}}\) \(\renewcommand{\row}{\text{Row}}\) \(\newcommand{\nul}{\text{Nul}}\) \(\newcommand{\var}{\text{Var}}\) \(\newcommand{\corr}{\text{corr}}\) \(\newcommand{\len}[1]{\left|#1\right|}\) \(\newcommand{\bbar}{\overline{\bvec}}\) \(\newcommand{\bhat}{\widehat{\bvec}}\) \(\newcommand{\bperp}{\bvec^\perp}\) \(\newcommand{\xhat}{\widehat{\xvec}}\) \(\newcommand{\vhat}{\widehat{\vvec}}\) \(\newcommand{\uhat}{\widehat{\uvec}}\) \(\newcommand{\what}{\widehat{\wvec}}\) \(\newcommand{\Sighat}{\widehat{\Sigma}}\) \(\newcommand{\lt}{<}\) \(\newcommand{\gt}{>}\) \(\newcommand{\amp}{&}\) \(\definecolor{fillinmathshade}{gray}{0.9}\)Concepts of animal population dynamics can be applied to human population growth. Humans are not unique in their ability to alter their environment. For example, beaver dams alter the stream environment where they are built. Humans, however, are unique in their ability to alter their environment with the conscious purpose of increasing its carrying capacity, sometimes to the detriment of other species (e.g., via artificial selection for crops that have a higher yield). This ability is a major factor responsible for human population growth and a way of overcoming density-dependent growth regulation. Much of this ability is related to human intelligence, society, and communication. Humans can construct shelter to protect them from the elements and have developed agriculture and domesticated animals to increase their food supplies. In addition, humans use language to communicate this technology to new generations, allowing them to improve upon previous accomplishments.
Although humans have increased the carrying capacity of their environment, the technologies used to achieve this transformation have caused unprecedented changes to Earth’s environment, altering ecosystems to the point where some may be in danger of collapse. The depletion of the ozone layer, erosion due to acid rain, and damage from global climate change are caused by human activities. The ultimate effect of these changes on our carrying capacity is unknown. As some point out, it is likely that the negative effects of increasing carrying capacity will outweigh the positive ones—the carrying capacity of the world for human beings might actually decrease.
History of Human Population Growth
The human population is growing rapidly. For most of human history, there were fewer than 1 billion people on the planet. During the time of the Agricultural Revolution, 10,000 B.C., there were only 5-10 million people on Earth - which is basically the population of New York City today. In 1800, when the Industrial Revolution began, there were approximately 1 billion people on Earth. Continued agricultural expansion and extraction of fossil fuels and minerals led to rapid global economic growth and, in turn, population growth in the 19th century. We’ve added over 6 billion people to the human population in just a little over 200 years (figure \(\PageIndex{1}\)). As of August 2020, the global human population is around 7.8 billion people.

Figure \(\PageIndex{1}\): Human population growth. Since 1700, human population size (shaded in teal) has increased. It reached 1 billion in 1803, 2 billion in 1928, 2.5 billion in 1950, 5 billion in 1987, and 7.7 billion in 2019. It is projected to reach 10.9 billion in 2100. The population growth rate (pink line) was only 0.04% on average between 10,000 BCE and 1700. The population growth rate peaked in 1968 at 2.1%, and since then, it has slowed to 1.08% in 2019 and is projected to be at 0.1% in 2100. Image by Max Roser (2013) "Future Population Growth". Published online at OurWorldInData.org. (CC-BY)
The fundamental cause of the acceleration of growth rate for humans in the past 200 years has been the reduced death rate due to changes in public health and sanitation. Clean drinking water and proper disposal sewage has drastically improved health in developed nations. Also, medical innovations such as the use of antibiotics and vaccines have decreased the ability of infectious disease to limit human population growth. In the past, diseases such as the bubonic plaque of the fourteenth century killed between 30 and 60 percent of Europe’s population and reduced the overall world population by as many as one hundred million people. Naturally, infectious disease continues to have an impact on human population growth, especially in poorer nations. For example, life expectancy in sub-Saharan Africa, which was increasing from 1950 to 1990, began to decline after 1985 largely as a result of HIV/AIDS mortality. According to a 2016 study by Marcus et al., The reduction in life expectancy caused by HIV/AIDS was estimated to be 8 years for 2016.
The world’s human population is currently experiencing exponential growth even though human reproduction is far below its biotic potential (Figure \(\PageIndex{1}\)). To reach its biotic potential, all females would have to become pregnant every nine months or so during their reproductive years. Also, resources would have to be such that the environment would support such growth. Neither of these two conditions exists. In spite of this fact, human population is still growing exponentially. A consequence of exponential human population growth is the time that it takes to add a particular number of humans to the Earth is becoming shorter. Figure \(\PageIndex{2}\) shows that 123 years were necessary to add 1 billion humans in 1930, but it only took 12 years to add 1 billion people between 1975 and 1987.

Figure \(\PageIndex{2}\): The time between the addition of each billion human beings to Earth decreases over time. (credit: modification of work by Ryan T. Cragun)
The actual growth rates in different countries are shown in Figure \(\PageIndex{3}\), with the highest rates tending to be in the less economically developed countries of Africa and Asia.

Click through this interactive view of how human populations have changed over time.
Demographic Transition
Major changes in the human population first began during the 1700s in Europe and North America. First death rates fell, followed somewhat later by birth rates. Several advances in science and technology led to lower death rates, especially in children, in 18th century Europe and North America:
- New scientific knowledge of the causes of disease led to improved water supplies, sewers, and personal hygiene.
- Better farming techniques and machines increased the food supply.
- The Industrial Revolution of the 1800s led to new sources of energy, such as coal and electricity. This increased the efficiency of the new agricultural machines. It also led to train transport, which improved the distribution of food.
Because many more children survived to adulthood, birth rates also increased. As the gap between birth and death rates widened, the human population grew faster. It wasn’t long before birth rates started to fall as well in Europe and North America. People started having fewer children because large families were no longer beneficial for several reasons.
- As child death rates fell and machines did more work, farming families no longer needed to have as many children to work in the fields.
- Laws were passed that required children to go to school. Therefore, they could no longer work and contribute to their own support. They became a drain on the family’s income.
Eventually, birth rates fell to match death rates. As a result, population growth slowed to nearly zero. These changes in population that occurred in Europe and North America have been called the demographic transition. The transition can be summarized in the following four stages, which are illustrated in Figure \(\PageIndex{4}\) below:
- Stage 1—High birth and death rates lead to slow population growth.
- Stage 2—The death rate falls but the birth rate remains high, leading to faster population growth.
- Stage 3—The birth rate starts to fall, so population growth starts to slow.
- Stage 4—The birth rate reaches the same low level as the death rate, so population growth slows to zero.
Figure \(\PageIndex{4}\): Stages of the Demographic Transition. In the demographic transition, the death rate falls first. After a lag, the birth rate also falls.
Age Structure, Population Growth, and Economic Development
The age structure of a population is an important factor in population dynamics. Age structure is the proportion of a population at different age ranges. Age structure allows better prediction of population growth, plus the ability to associate this growth with the level of economic development in the region. Countries with rapid growth have a pyramidal shape in their age structure diagrams, showing a preponderance of younger individuals, many of whom are of reproductive age or will be soon (Figure \(\PageIndex{5}\)). This pattern is most often observed in underdeveloped countries where individuals do not live to old age because of less-than-optimal living conditions. Age structures of areas with slow growth, including developed countries such as the United States, still have a pyramidal structure, but with many fewer young and reproductive-aged individuals and a greater proportion of older individuals. Other developed countries, such as Italy, have zero population growth. The age structure of these populations is more conical, with an even greater percentage of middle-aged and older individuals.
Art Connection
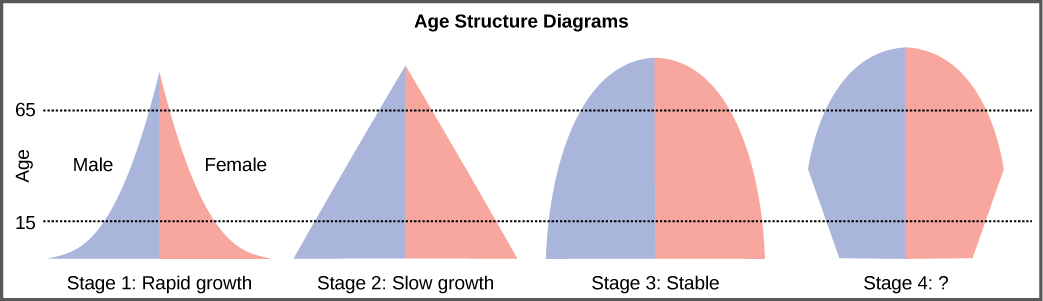
Age structure diagrams for rapidly growing, slow growing and stable populations are shown in stages 1 through 3. What type of population change do you think stage 4 represents?
Although global population size continues to increase, the rate of human population growth has decreased. This means that the population size is not increasing as quickly as it did in the past (figure \(\PageIndex{1}\)). The total fertility rate (TFR) is the average number of children that each woman will have during her lifetime. The TFR is an average because, of course, some women will have more, some fewer, and some no children at all. Theoretically, when the TFR = 2, each pair of parents just replaces itself. Actually it takes a TFR of 2.1 or 2.2 to replace each generation - this number is called the replacement fertility rate - because some children will die before they grow up to have their own two children. Figure \(\PageIndex{6}\) compares he total fertility rate in different countries. Since the early 1960's the global total fertility rate (or per capita birth rate) has fallen due to several factors:
- Modern medicine raised survival rates, making large families unnecessary.
- In many regions birth control, became more available.
- Education slowed reproduction because people got married later.
- HIV decreased population growth rates in many countries.
- China’s one-child policy had a noticeable effect on population growth in China (the country with the largest population).
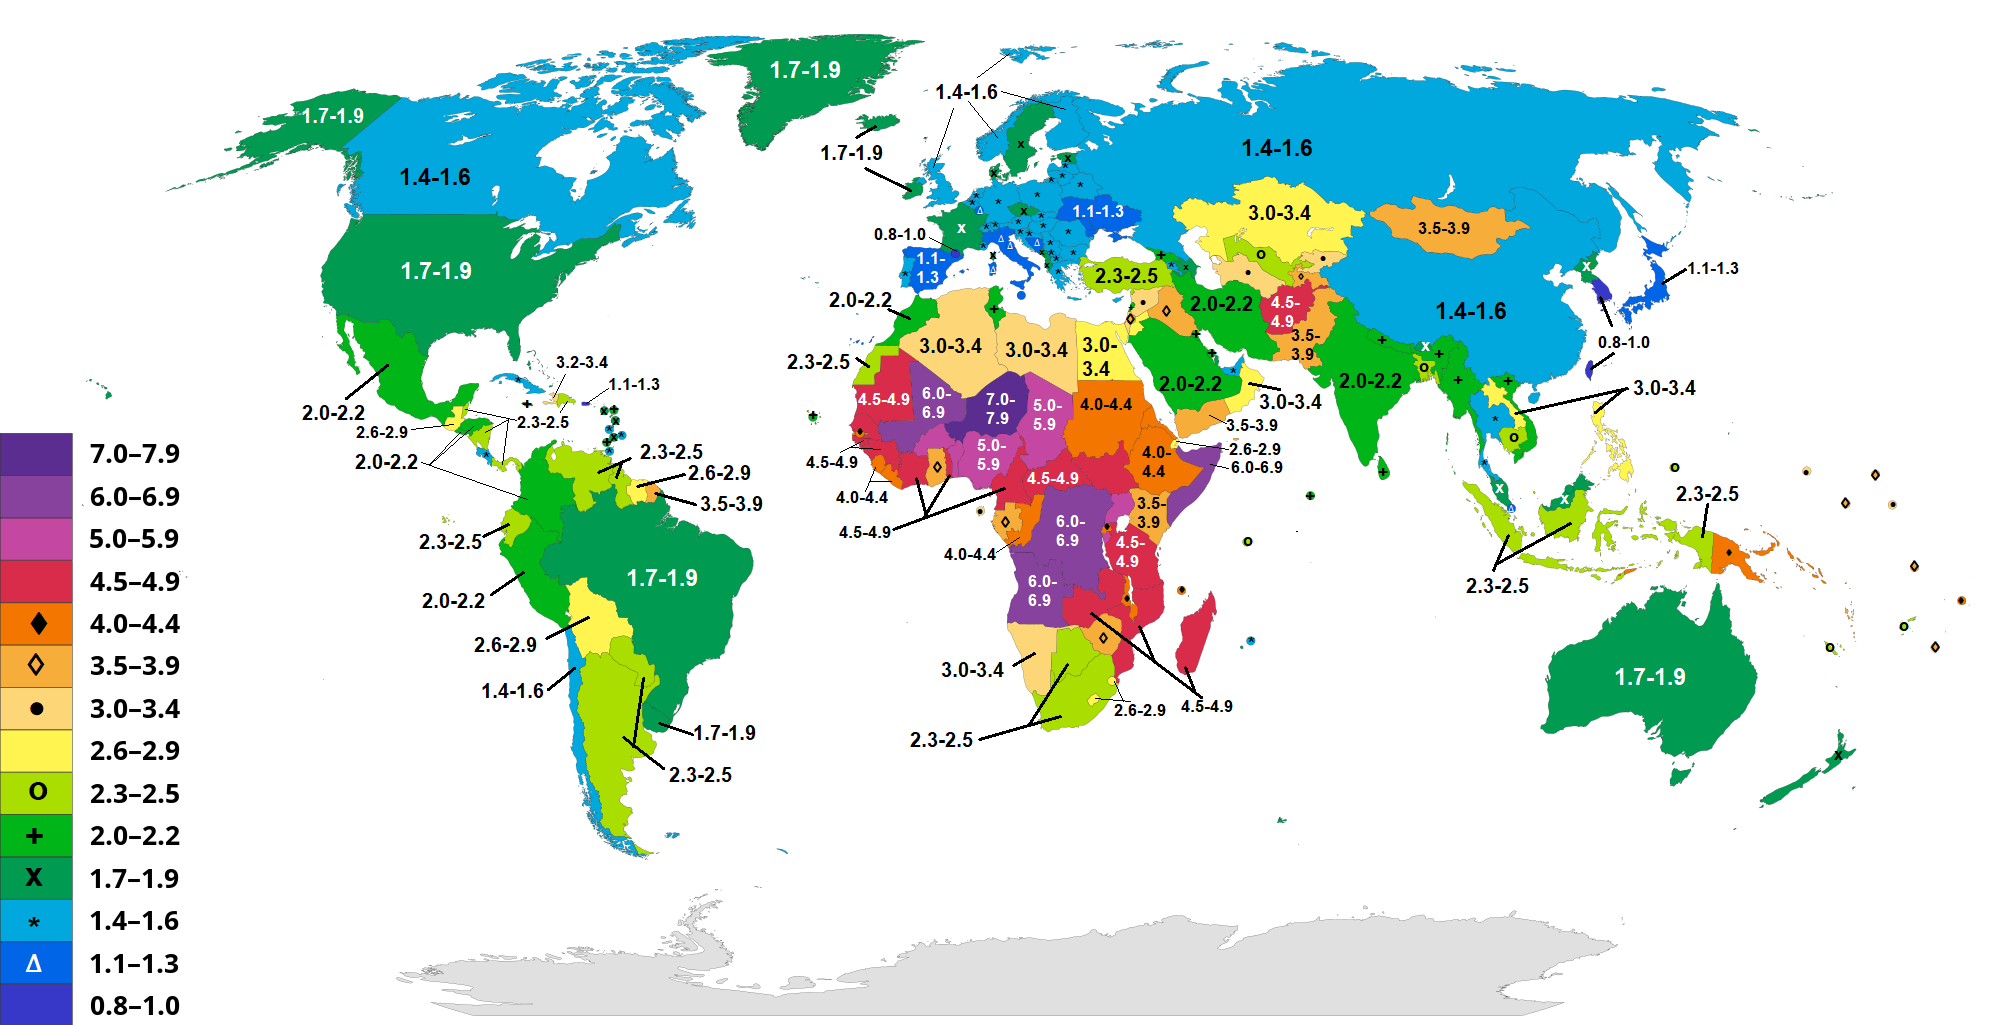
Figure \(\PageIndex{6}\): Total fertility rate by country in 2020. Most countries in North and South America have a total fertility rate of 1.7-2.5 children per woman, but fertility rates are lower (for example, Canada and Chile) or higher (for example, Guatamala and Bolivia) in a few countries. Most of Europe and northern and Eastern Asia have low fertility rates (generally 1.4-1.6 children per woman). Many Middle Eastern countries and those in southern and southeastern Asia have slightly higher fertility rates (generally 1.7-2.5 children per woman). The fertility rate in Australia is 1.7-1.9 children per woman. High fertility rates are common in African countries. For example, the fertility rate in Niger is 7.0-7.9. Image modified from Korakys (CC-BY-SA).
In many nations, birth rates are presently below replacement rates. In fact, in all nations with a gross national income above $16,000 dollars per person, the birth rate is at or below the replacement rate of 2.1 lifetime births per female (Figure \(\PageIndex{7}\)).
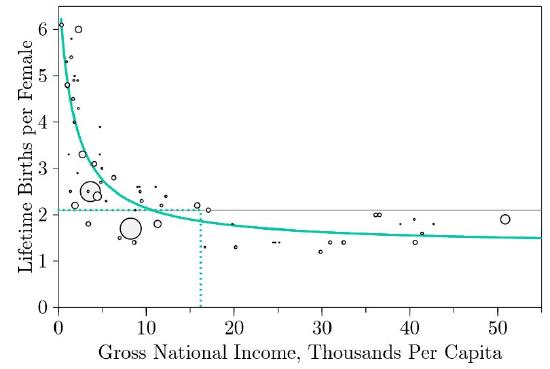
Figure \(\PageIndex{7}\): Human fecundity (births per female) as a function of national per capita income.
The TFR in the United States declined from more than 4 late in the nineteenth century to less than replacement in the early 1930s. However, when the small numbers of children born in the depression years reached adulthood, they went on a childbearing spree that produced the baby-boom generation (figure \(\PageIndex{8}\)). In 1957, more children were born in the United States than ever before (or since).
Figure \(\PageIndex{8}\): Age structure diagrams of the United States population in 1970 and 1985. The x-axis represents the percent of the population. The y-axis represents age groups in increments of five from 0-5 years all the way to 85-90 years. Blue bars to the left represent males, and red bars to the right represent females. Bars taper near the top of the diagram, showing that those in the oldest age categories represent a small percentage of the population. The 1970 age structure diagram bulges around the 10-15 age group, and this represents the baby boom (green oval). In 1985, this bulge has moved to the 25-30 age group.
Long-Term Consequences of Exponential Human Population Growth
Many dire predictions have been made about the world’s population leading to a major crisis called the “population explosion.” In the 1968 book The Population Bomb, biologist Dr. Paul R. Ehrlich wrote, “The battle to feed all of humanity is over. In the 1970s hundreds of millions of people will starve to death in spite of any crash programs embarked upon now. At this late date nothing can prevent a substantial increase in the world death rate.”1 While many critics view this statement as an exaggeration, the laws of exponential population growth are still in effect, and unchecked human population growth cannot continue indefinitely.
Reducing the population growth rate will limit the consequences of overpopulation; however, regulation of the human population is a complex issue that presents ethical considerations. Efforts to moderate population control led to the 1979 One-Child Policy in China, which imposed fines on urban couples who had more than one child (figure \(\PageIndex{9}\)). Additionally, only a couple's first child was granted educational and health care benefits. The effectiveness of the policy in limiting overall population growth is controversial, as was the policy itself. Tragically, this policy combined with the desire of many couples to have a male heir led to female infanticide. Furthermore, enforcement of the policy led to human rights abuses including forced sterilizations and forced abortions. Over the years, some restrictions associated with the One-Child Policy were lifted. For example, in 2013, an adult who was an only child was allowed to have two children. The policy ended in 2016, and as of May 2021, each couple is now permitted to have up to three children.

Figure \(\PageIndex{9}\): A poster explaining and promoting the One-Child Policy. Image by Arian Zwegers (CC-BY).
Zero population growth occurs when the birth rate equals the death rate such that the rate of population growth is zero. Logically, this would occur when total fertility rate equals replacement fertility rate, but as described in the previous section, this depends on the age structure of a population.
All else being equal, reductions in total fertility rate will slow human population growth. Total fertility rate is negatively correlated with improved standard of living, access to health care, and gender equality. As countries develop economically, individuals become increasingly dependent on urban jobs rather than the family farm for income and provisions. While a large family would be needed to tend the family farm, supporting many children in an urban area is expensive. As a result, economic development is associated with couples choosing to have fewer children.
Access to healthcare decreases childhood mortality and provides the option of birth control. While decreased infant and childhood mortality alone would increase the population growth rate, people tend to have fewer children when they can be confident that all of their children are likely to survive; thus, as childhood mortality declines, total fertility rate also declines, lowering the population growth rate.
The education of women and girls is also associated with a decreased total fertility rate. Furthermore, family planning education programs have had highly positive effects in some countries on limiting population growth rates and increasing standards of living. When women have knowledge of family planning, power to make decisions about their family size, and a variety of career options, fertility rate declines. In regions that have made recent strides in educating girls, families more often choose to have a small number of children so that they can afford to pay for their education regardless of gender.
The impact of humans on our environment depends not only on population size but also on resource use. The ecological footprint is a measure of the area of land needed to support an individual or country. This includes agricultural lands used to provide food, other lands used to provide goods (such as forests to provide timber) and fuels (such as oil fields to provide fossil fuels), and the land needed to dispose of wastes.
Countries differ in the average ecological footprint per person, and these differences are associated with region (figure \(\PageIndex{b}\)). For example, in 2017, the ecological footprint per person in the United States was 8.1 global hectares compared to only 1.2 global hectares in India. (Visit footprintnetwork.org to see ecological footprints and related metrics for all countries.) Many factors affect the size of an ecological footprint from economic development to resource conservation to individual product choice. Reducing our ecological footprints can increase our carrying capacity and decrease environmental impact. So maybe we should update the question of, "What the Earths carrying capacity for humans," to, "What is the carrying capacity of people on Earth at which we can provide a fair and decent life for all humans while causing the minimum impact on the environment?
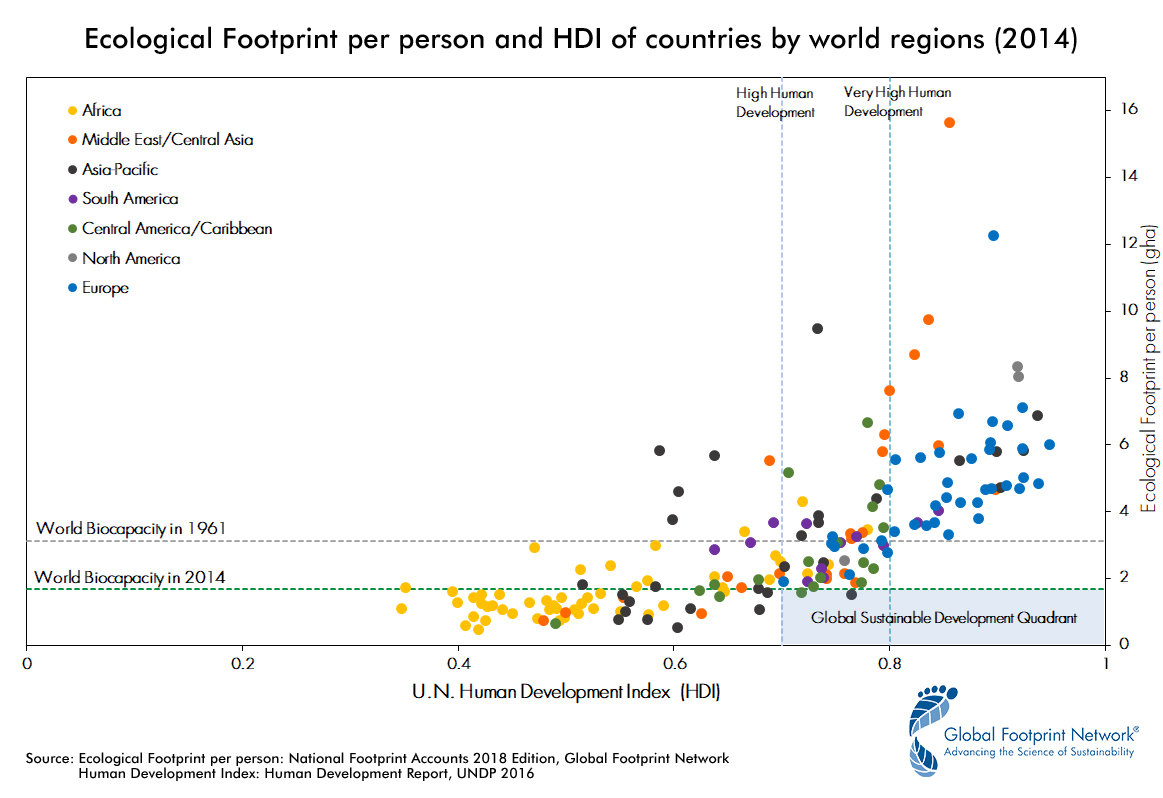
Figure \(\PageIndex{b}\): The ecological footprint per person in relation to the U.N. human development index for each country coded by region. Countries in some regions of the world have low ecological footprints per person, but this is because people are living in poverty (points in lower left of graph). This pattern is characteristic of many African countries. Other countries have large ecological footprints and live affluently (points in upper right of graph), including many European countries. To sustainably meet human needs, countries must achieve a high human development index and low ecological footprint (points in lower right of graph). Image by Footprint123 (CC-BY-SA).
Are you wondering about the size of your ecological footprint? You can estimate it here.
References
Marcus, J. L., Chao, C. R., Leyden, W. A., Xu, L., Quesenberry, C. P., Jr, Klein, D. B., Towner, W. J., Horberg, M. A., & Silverberg, M. J. (2016). Narrowing the Gap in Life Expectancy Between HIV-Infected and HIV-Uninfected Individuals With Access to Care. Journal of acquired immune deficiency syndromes (1999), 73(1), 39–46.
Population Growth (Annual %). 2019 World Bank Group. Accessed 29 August 2020.
Growing at a slower pace, world population is expected to reach 9.7 billion in 2050 and could peak at nearly 11 billion around 2100. 2019. United Nations Department of Economic and Social Affairs. Accessed 29 August 2020.
- Paul R. Erlich, prologue to The Population Bomb, (1968; repr., New York: Ballantine, 1970).
Contributors and Attributions
Modified by Kyle Whittinghill and Melissa Ha from the following sources:
- 45.5: Human Population Growth by OpenStax, is licensed CC BY by
Connie Rye (East Mississippi Community College), Robert Wise (University of Wisconsin, Oshkosh), Vladimir Jurukovski (Suffolk County Community College), Jean DeSaix (University of North Carolina at Chapel Hill), Jung Choi (Georgia Institute of Technology), Yael Avissar (Rhode Island College) among other contributing authors. Original content by OpenStax (CC BY 4.0; Download for free at http://cnx.org/contents/185cbf87-c72...f21b5eabd@9.87).
- 6.4: A global transition by Clarence Lehman, Shelby Loberg, & Adam Clark, is licensed CC BY-NC
- The Human Population from Environmental Biology by Matthew R. Fisher (licensed under CC-BY)
- Human Demography from Introduction to Environmental Science, 2nd edition by Caralyn Zehnder et al. (licensed under CC-BY-NC-SA).
- Human Population Growth from General Biology by OpenStax (licensed under CC-BY)
- The Industrialization of Nature: A Modern History (1500 to the present) from Sustainability: A Comprehensive Foundation by Tom Theis and Jonathan Tomkin, Editors. Download for free at CNX. (licensed under CC-BY)
- The Human Population from Biology by John W. Kimball (licensed under CC-BY)