
7.1: Energy from Fossil Fuels
- Page ID
- 69419

\( \newcommand{\vecs}[1]{\overset { \scriptstyle \rightharpoonup} {\mathbf{#1}} } \)
\( \newcommand{\vecd}[1]{\overset{-\!-\!\rightharpoonup}{\vphantom{a}\smash {#1}}} \)
\( \newcommand{\dsum}{\displaystyle\sum\limits} \)
\( \newcommand{\dint}{\displaystyle\int\limits} \)
\( \newcommand{\dlim}{\displaystyle\lim\limits} \)
\( \newcommand{\id}{\mathrm{id}}\) \( \newcommand{\Span}{\mathrm{span}}\)
( \newcommand{\kernel}{\mathrm{null}\,}\) \( \newcommand{\range}{\mathrm{range}\,}\)
\( \newcommand{\RealPart}{\mathrm{Re}}\) \( \newcommand{\ImaginaryPart}{\mathrm{Im}}\)
\( \newcommand{\Argument}{\mathrm{Arg}}\) \( \newcommand{\norm}[1]{\| #1 \|}\)
\( \newcommand{\inner}[2]{\langle #1, #2 \rangle}\)
\( \newcommand{\Span}{\mathrm{span}}\)
\( \newcommand{\id}{\mathrm{id}}\)
\( \newcommand{\Span}{\mathrm{span}}\)
\( \newcommand{\kernel}{\mathrm{null}\,}\)
\( \newcommand{\range}{\mathrm{range}\,}\)
\( \newcommand{\RealPart}{\mathrm{Re}}\)
\( \newcommand{\ImaginaryPart}{\mathrm{Im}}\)
\( \newcommand{\Argument}{\mathrm{Arg}}\)
\( \newcommand{\norm}[1]{\| #1 \|}\)
\( \newcommand{\inner}[2]{\langle #1, #2 \rangle}\)
\( \newcommand{\Span}{\mathrm{span}}\) \( \newcommand{\AA}{\unicode[.8,0]{x212B}}\)
\( \newcommand{\vectorA}[1]{\vec{#1}} % arrow\)
\( \newcommand{\vectorAt}[1]{\vec{\text{#1}}} % arrow\)
\( \newcommand{\vectorB}[1]{\overset { \scriptstyle \rightharpoonup} {\mathbf{#1}} } \)
\( \newcommand{\vectorC}[1]{\textbf{#1}} \)
\( \newcommand{\vectorD}[1]{\overrightarrow{#1}} \)
\( \newcommand{\vectorDt}[1]{\overrightarrow{\text{#1}}} \)
\( \newcommand{\vectE}[1]{\overset{-\!-\!\rightharpoonup}{\vphantom{a}\smash{\mathbf {#1}}}} \)
\( \newcommand{\vecs}[1]{\overset { \scriptstyle \rightharpoonup} {\mathbf{#1}} } \)
\(\newcommand{\longvect}{\overrightarrow}\)
\( \newcommand{\vecd}[1]{\overset{-\!-\!\rightharpoonup}{\vphantom{a}\smash {#1}}} \)
\(\newcommand{\avec}{\mathbf a}\) \(\newcommand{\bvec}{\mathbf b}\) \(\newcommand{\cvec}{\mathbf c}\) \(\newcommand{\dvec}{\mathbf d}\) \(\newcommand{\dtil}{\widetilde{\mathbf d}}\) \(\newcommand{\evec}{\mathbf e}\) \(\newcommand{\fvec}{\mathbf f}\) \(\newcommand{\nvec}{\mathbf n}\) \(\newcommand{\pvec}{\mathbf p}\) \(\newcommand{\qvec}{\mathbf q}\) \(\newcommand{\svec}{\mathbf s}\) \(\newcommand{\tvec}{\mathbf t}\) \(\newcommand{\uvec}{\mathbf u}\) \(\newcommand{\vvec}{\mathbf v}\) \(\newcommand{\wvec}{\mathbf w}\) \(\newcommand{\xvec}{\mathbf x}\) \(\newcommand{\yvec}{\mathbf y}\) \(\newcommand{\zvec}{\mathbf z}\) \(\newcommand{\rvec}{\mathbf r}\) \(\newcommand{\mvec}{\mathbf m}\) \(\newcommand{\zerovec}{\mathbf 0}\) \(\newcommand{\onevec}{\mathbf 1}\) \(\newcommand{\real}{\mathbb R}\) \(\newcommand{\twovec}[2]{\left[\begin{array}{r}#1 \\ #2 \end{array}\right]}\) \(\newcommand{\ctwovec}[2]{\left[\begin{array}{c}#1 \\ #2 \end{array}\right]}\) \(\newcommand{\threevec}[3]{\left[\begin{array}{r}#1 \\ #2 \\ #3 \end{array}\right]}\) \(\newcommand{\cthreevec}[3]{\left[\begin{array}{c}#1 \\ #2 \\ #3 \end{array}\right]}\) \(\newcommand{\fourvec}[4]{\left[\begin{array}{r}#1 \\ #2 \\ #3 \\ #4 \end{array}\right]}\) \(\newcommand{\cfourvec}[4]{\left[\begin{array}{c}#1 \\ #2 \\ #3 \\ #4 \end{array}\right]}\) \(\newcommand{\fivevec}[5]{\left[\begin{array}{r}#1 \\ #2 \\ #3 \\ #4 \\ #5 \\ \end{array}\right]}\) \(\newcommand{\cfivevec}[5]{\left[\begin{array}{c}#1 \\ #2 \\ #3 \\ #4 \\ #5 \\ \end{array}\right]}\) \(\newcommand{\mattwo}[4]{\left[\begin{array}{rr}#1 \amp #2 \\ #3 \amp #4 \\ \end{array}\right]}\) \(\newcommand{\laspan}[1]{\text{Span}\{#1\}}\) \(\newcommand{\bcal}{\cal B}\) \(\newcommand{\ccal}{\cal C}\) \(\newcommand{\scal}{\cal S}\) \(\newcommand{\wcal}{\cal W}\) \(\newcommand{\ecal}{\cal E}\) \(\newcommand{\coords}[2]{\left\{#1\right\}_{#2}}\) \(\newcommand{\gray}[1]{\color{gray}{#1}}\) \(\newcommand{\lgray}[1]{\color{lightgray}{#1}}\) \(\newcommand{\rank}{\operatorname{rank}}\) \(\newcommand{\row}{\text{Row}}\) \(\newcommand{\col}{\text{Col}}\) \(\renewcommand{\row}{\text{Row}}\) \(\newcommand{\nul}{\text{Nul}}\) \(\newcommand{\var}{\text{Var}}\) \(\newcommand{\corr}{\text{corr}}\) \(\newcommand{\len}[1]{\left|#1\right|}\) \(\newcommand{\bbar}{\overline{\bvec}}\) \(\newcommand{\bhat}{\widehat{\bvec}}\) \(\newcommand{\bperp}{\bvec^\perp}\) \(\newcommand{\xhat}{\widehat{\xvec}}\) \(\newcommand{\vhat}{\widehat{\vvec}}\) \(\newcommand{\uhat}{\widehat{\uvec}}\) \(\newcommand{\what}{\widehat{\wvec}}\) \(\newcommand{\Sighat}{\widehat{\Sigma}}\) \(\newcommand{\lt}{<}\) \(\newcommand{\gt}{>}\) \(\newcommand{\amp}{&}\) \(\definecolor{fillinmathshade}{gray}{0.9}\)The U.S. and the world overall heavily depend on fossil fuels. In 2019, fossil fuels contributed to 62.6% of electricity generation in the U.S. with coal contributing 23.4% and natural gas contributing 38.4% (table \(\PageIndex{1}\)). Note that oil (petroleum) is primary used for transportation and thus only contributes a fraction of a percentage to electricity generation. With respect to total energy consumption, the world continues to rely on crude oil more than any other energy source (33.1%) followed by coal (27%) and natural gas (24.3%; figure\(\PageIndex{1}\)).
|
Energy source |
Contribution to Electricity Generation (%) |
|---|---|
| Fossil fuels (total) | 62.6% |
|
Natural gas |
38.4% |
|
Coal |
23.4% |
|
Petroleum (total) |
0.4% |
|
Other gases |
0.3% |
|
Nuclear |
19.6% |
|
Renewables (total) |
17.6% |
|
Hydropower |
7.0% |
|
Wind |
7.1% |
|
Biomass (total) |
1.4% |
|
Solar (total) |
1.7% |
|
Geothermal |
0.4% |
Table modified from U.S. Energy Information Administration (public domain).
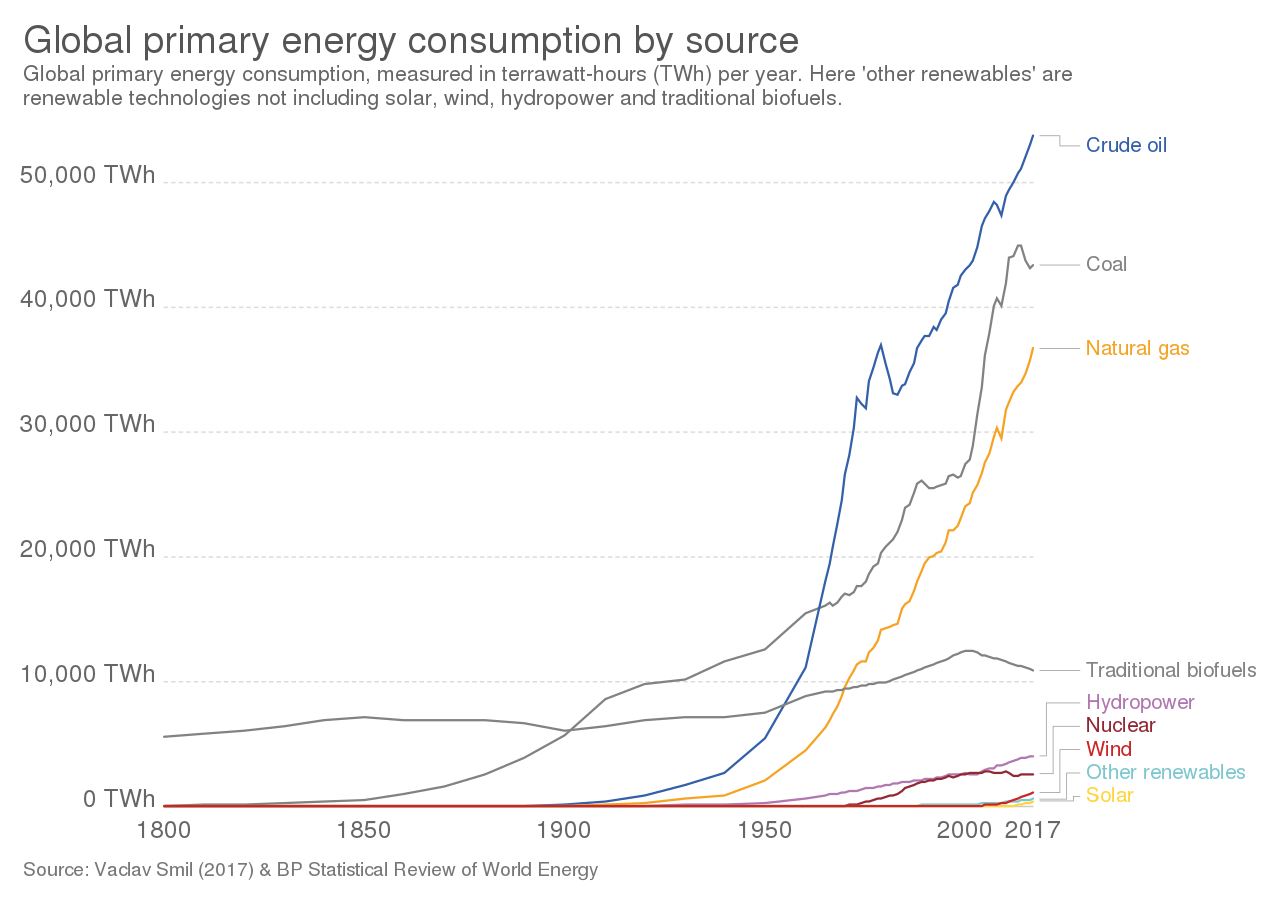
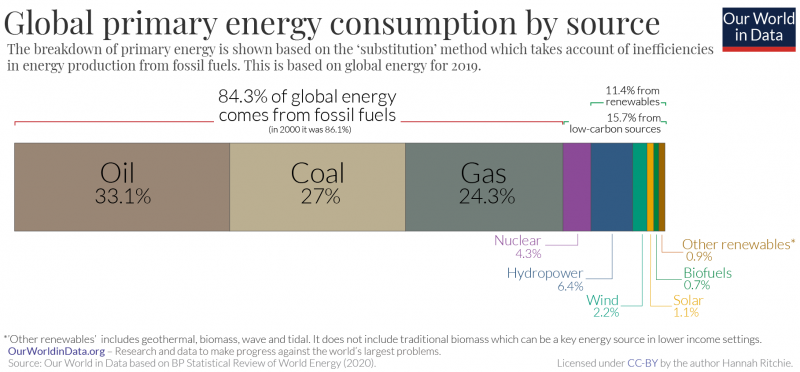
Figure \(\PageIndex{1}\): The top graph shows global energy consumption by source shows energy consumption in terrawatt-hours (TWh) on the y-axis and time in years (1800-2017) on the X-axis. The bottom graph shows the percentage that each energy source contributes to global energy consumption in 2019. Global consumption of most energy sources has increased over time. Consumption of crude oil is the highest (33.1% of global energy consumption in 2019), and it increased rapidly in the 1950s, surpassing coal consumption in the early 1960s. Coal is now the second most-consumed energy source (27%), but its global consumption has declined in recent years. Natural gas is the third most-consumed energy source (24.3%) and has also been increasing. Coal and natural gas consumption surpassed that of traditional biofuels in the early 1900s and 1970, respectively. Nuclear energy consumption has decreased recently, accounting for 4.3% of global energy consumption in 2019. Consumption of renewable energy overall (11.4%) is low compared to fossil fuels (84.3% combined), but it has generally increased in recent years. Images by Our World in Data (CC-BY).
Generating Electricity from Coal
Coal has been used by humans for at least 6000 years, mainly as a fuel source. Coal resources in Wales are often cited as a primary reason for the rise of Britain (and later, the United States) in the Industrial Revolution. Coal electricity traces its origins to the early 20th Century, when it was the natural fuel for steam engines given its abundance, high energy density and low cost. Coal is the largest domestically produced source of energy. At the end of 2018, BP estimated coal reserves at 734,903 million tonnes, with nearly 23.7% of that in the United States. It is a major fuel resource that the United States controls domestically.
Once mined, coal may go to a preparation plant located near the mining site where it is cleaned and processed to remove impurities such as rocks and dirt, ash, sulfur, and other unwanted materials. This process increases the amount of energy that can be obtained from a unit of coal, known as its heating value. Finally, the mined and processed coal must be transported. Transportation can be more expensive than mining the coal. Nearly 70% of coal delivered in the United States is transported, for at least part of its trip, by train (figure \(\PageIndex{2}\)). Coal can also be transported by barge, ship, or truck. Coal can also be crushed, mixed with water, and sent through a slurry pipeline. Sometimes, coal-fired electric power plants are built near coal mines to lower transportation costs.
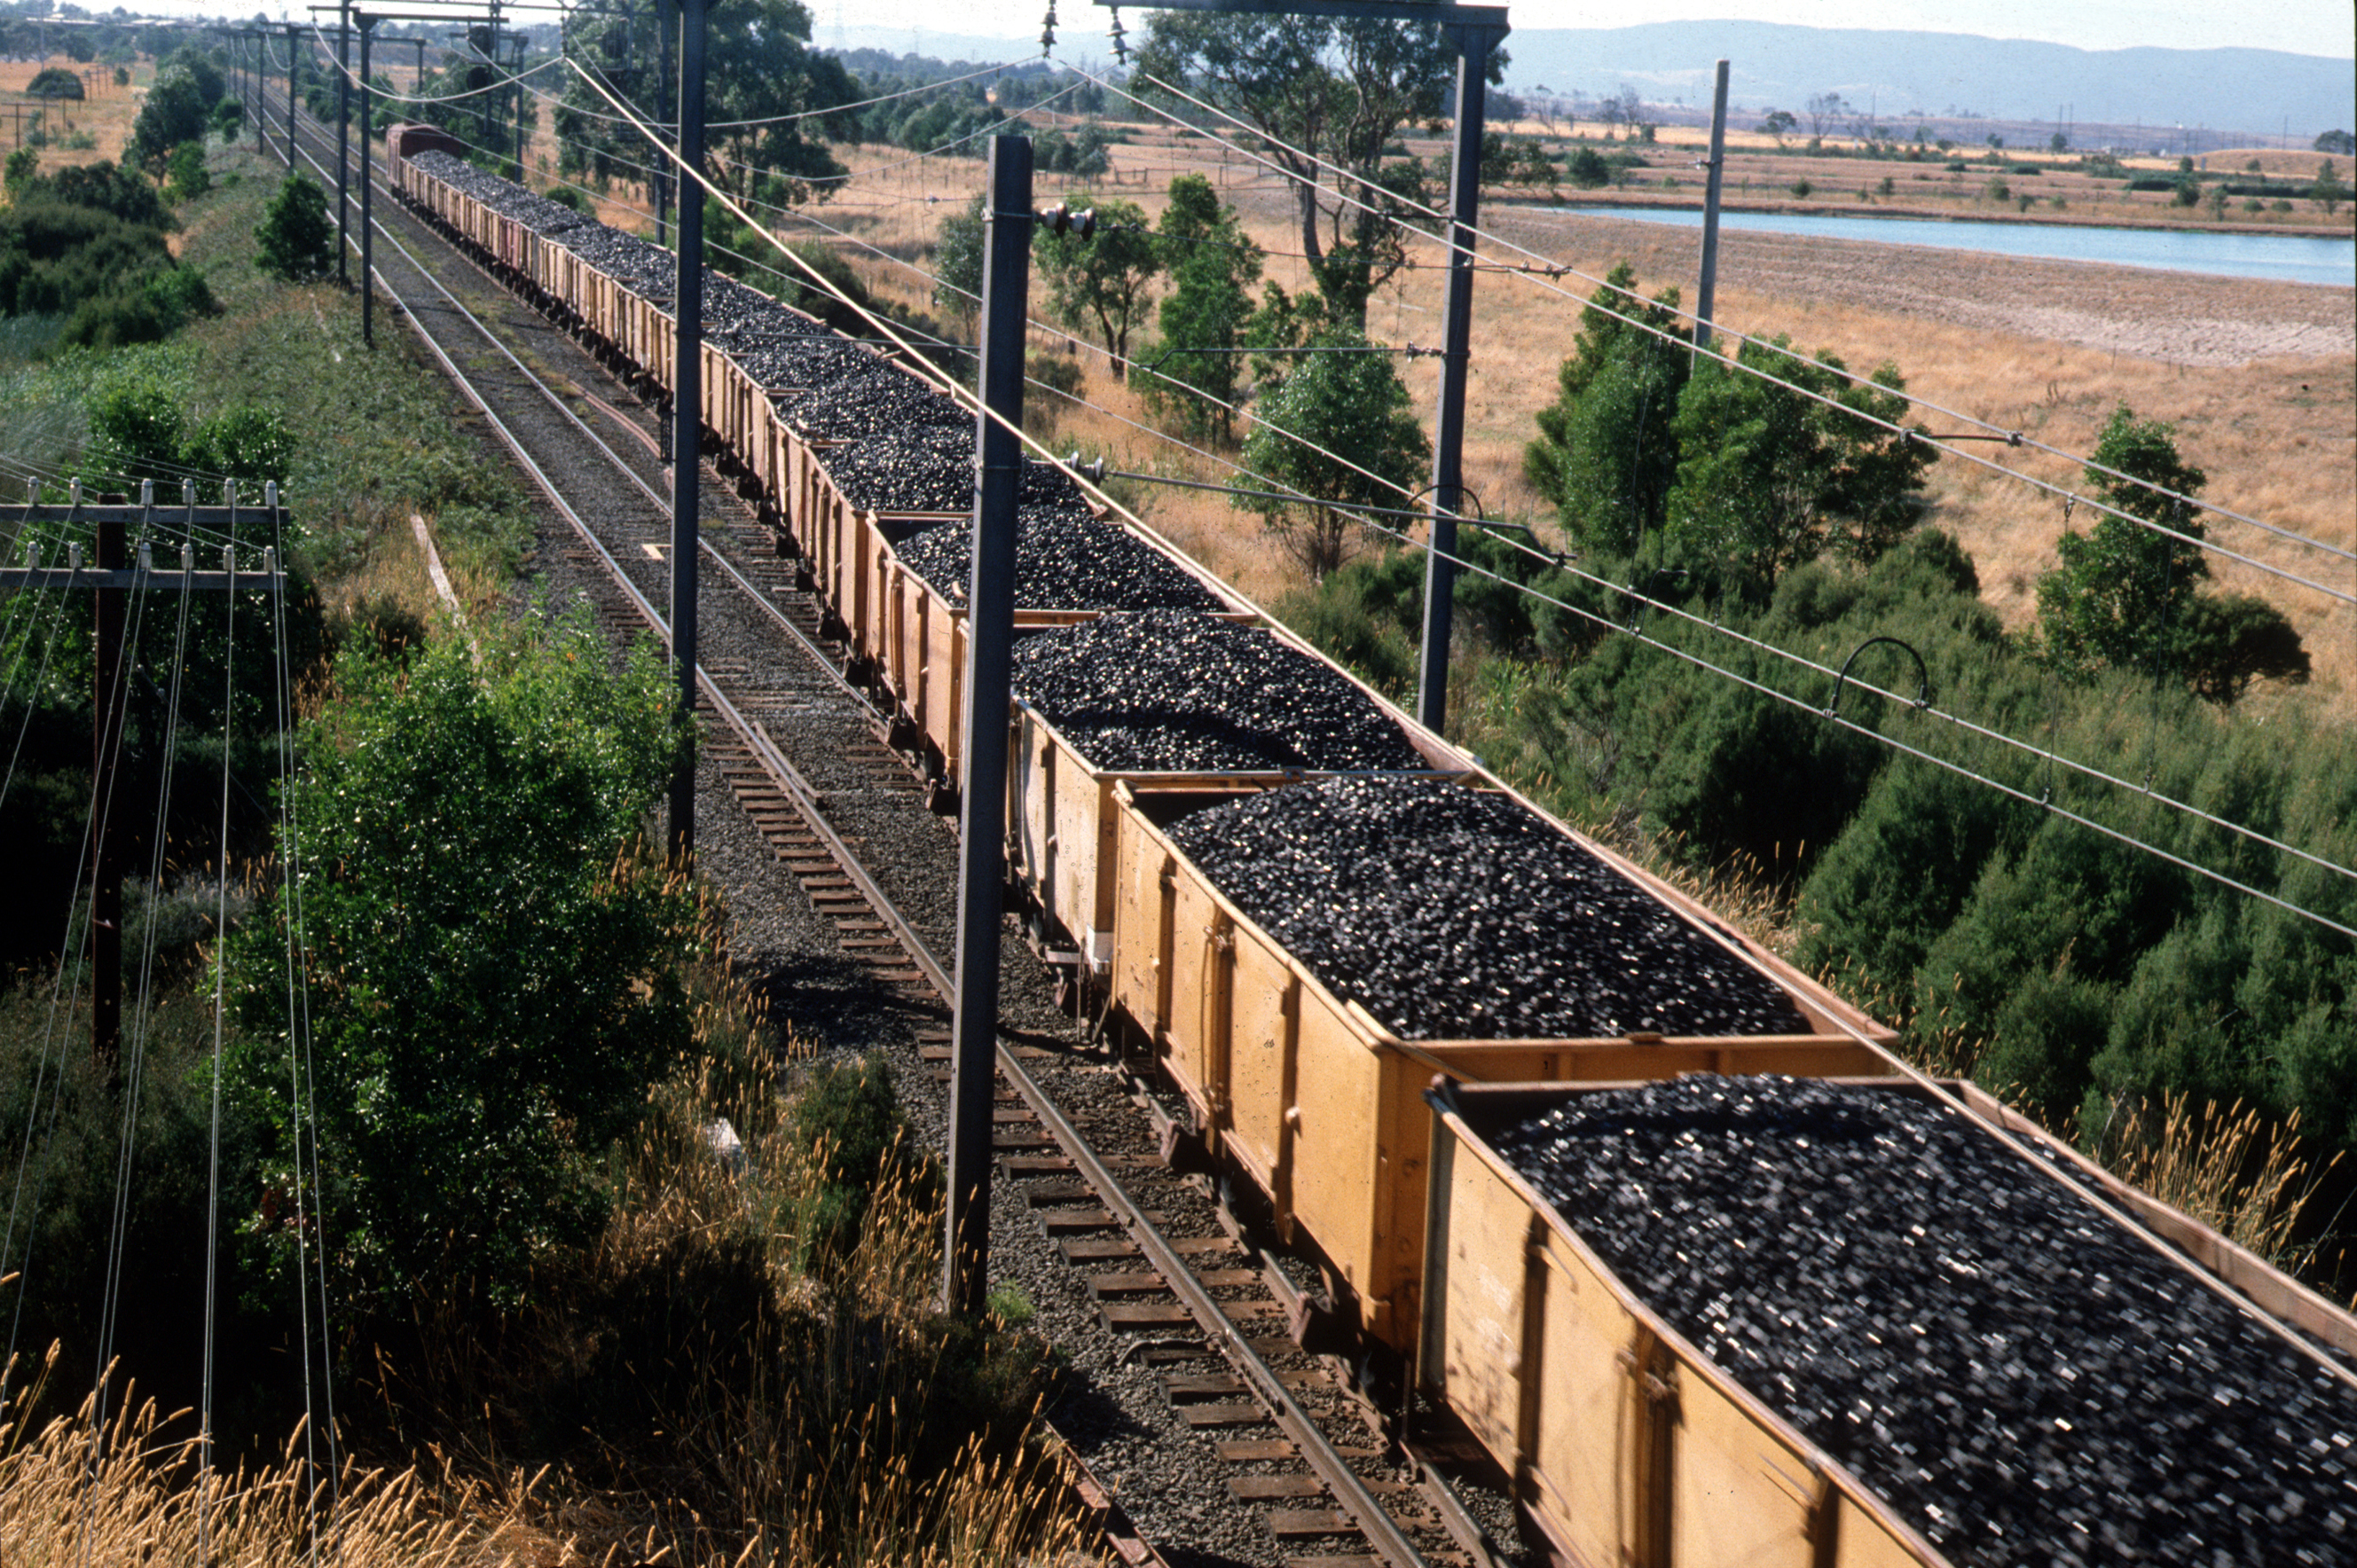
Figure \(\PageIndex{2}\): A freight train loaded with coal briquettes, formed from compressed coal dust, in Morwell, Victoria, Australia. Image and caption (modified) by CSIRO (CC-BY).
Once at the power plant, coal is first pulverized into a fine powder and then mixed with hot air and blown into a furnace (figure \(\PageIndex{3}\)). This allows for the most complete combustion (burning) and maximum heat release. Purified water, pumped through pipes inside a boiler, is turned into steam by the heat from the combustion of coal. The high pressure of the steam pushing against a series of giant turbine blades turns the turbine shaft. The turbine shaft is connected to the shaft of the generator, where magnets spin within wire coils to produce electricity. After doing its work in the turbine, the steam is drawn into a condenser, a large chamber in the basement of the power plant. In this important step, millions of gallons of cool water from a nearby source (such as a river or lake) are pumped through a network of tubes running through the condenser. The cool water in the tubes converts the steam back into water that can be used over and over again in the plant. The cooling water is returned to its source without any contamination except at a higher temperature than when first extracted from the river or lake.
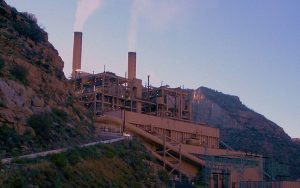
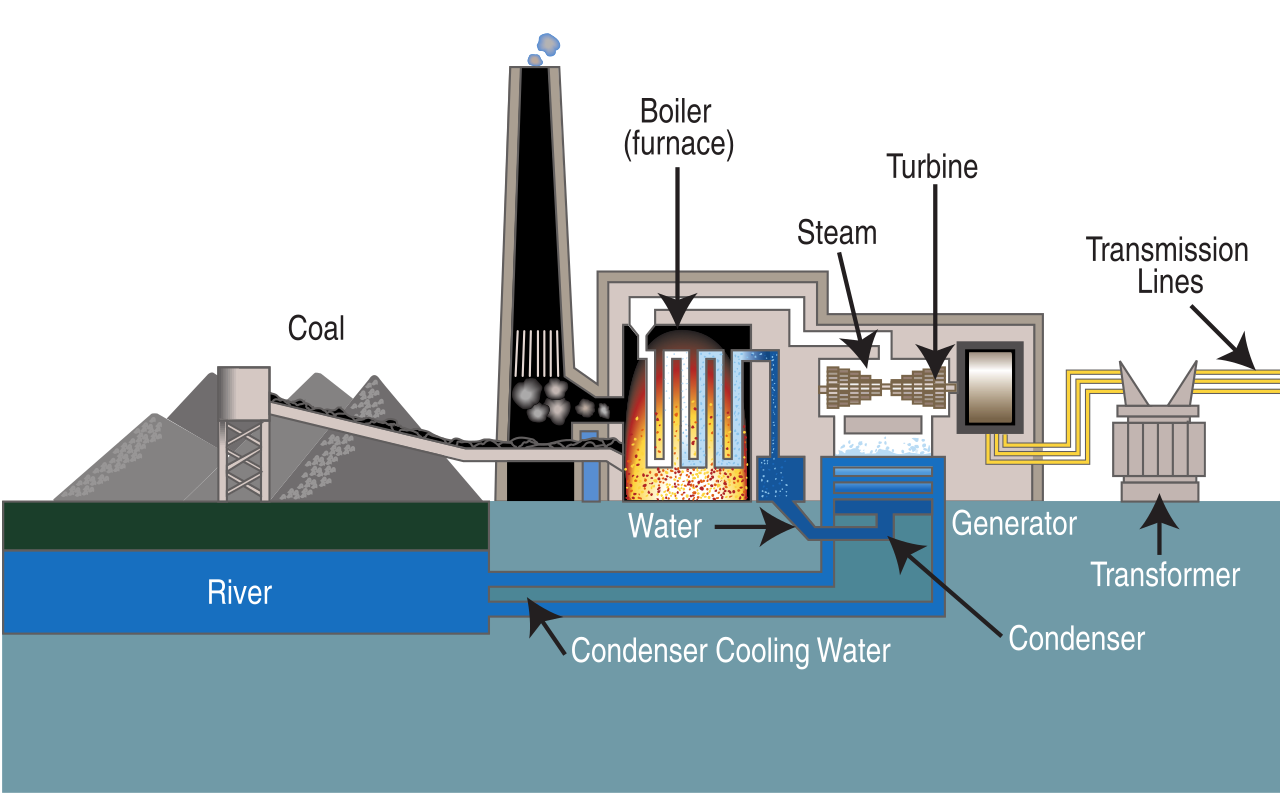
Figure \(\PageIndex{3}\): Left: Coal power plant in Helper, Utah. Right: Diagram of a typical steam-cycle coal power plant (proceeding from left to right). Coal enters the boiler (furnace), where it is burned. This boils water, producing steam. The steam turns a turbine, powering a generator. The resultant electricity is passed through a transformer (which changes the voltage) and is then sent through transmission lines. The steam cools and condenses back to liquid water in the condenser. This is facilitator by cooling water from a nearby river. Right image by Tennessee Valley Authority (public domain).
Coal is plentiful and inexpensive, when looking only at the market cost relative to the cost of other sources of electricity, but its extraction, transportation, and use produces a multitude of environmental impacts that the market cost does not truly represent. Coal emits sulfur dioxide, nitrogen oxide, and mercury, which have been linked to acid rain, smog, and health issues. Burning of coal emits higher amounts of carbon dioxide per unit of energy than the use of oil or natural gas. Coal accounted for 35% of the total United States emissions of carbon dioxide released into the Earth’s atmosphere in 2010. Ash generated from combustion contributes to water contamination.
This video shows how heat energy can be used to generate electricity.
Generating Electricity from Oil and Natural Gas
Proven oil reserves (or natural gas reserves) refers to the amount of oil or natural gas that can be extracted economically with current methods (such as conventional wells or fracking). The U.S. Energy Administration estimates that there are enough liquid fuels to last through 2050 (and they include biofuels in this projection). In 2016, BP projected that proven reserves of oil and natural gas can support global demands for another 50 years. Additionally, they estimate that coal reserves can last another 115 years.
Scientists and policy-makers often discuss the question of when the world will reach peak oil production, the point at which oil production is at its greatest and then declines. It was initially predicted that global peak oil would be reached in 2000, but oil production and consumption continue to rise. The United States, however, already passed peak oil production in 1970.
The concentration of oil reserves in a few regions of the world makes much of the world dependent on imported energy for transportation (figure\(\PageIndex{4}\)). The rise in the price of oil in the last decade makes dependence on imported energy for transportation an economic as well as an energy issue. The United States spent $304.9 billion on oil imports in 2019. The United States has become more and more dependent on foreign oil since 1970 when our own oil production peaked.
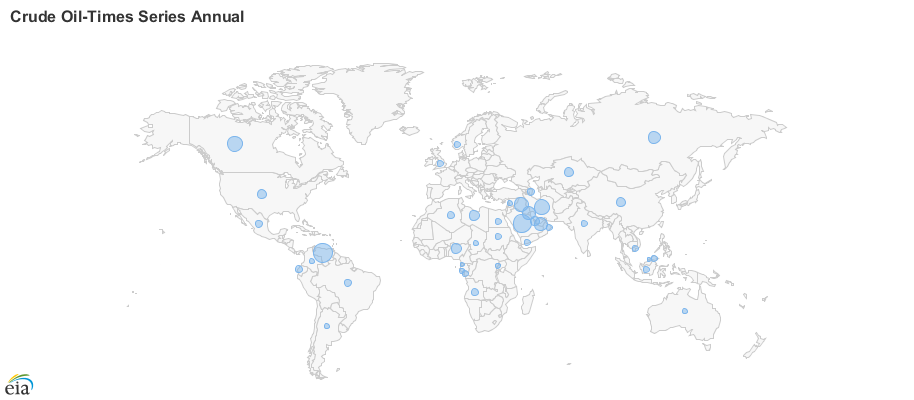
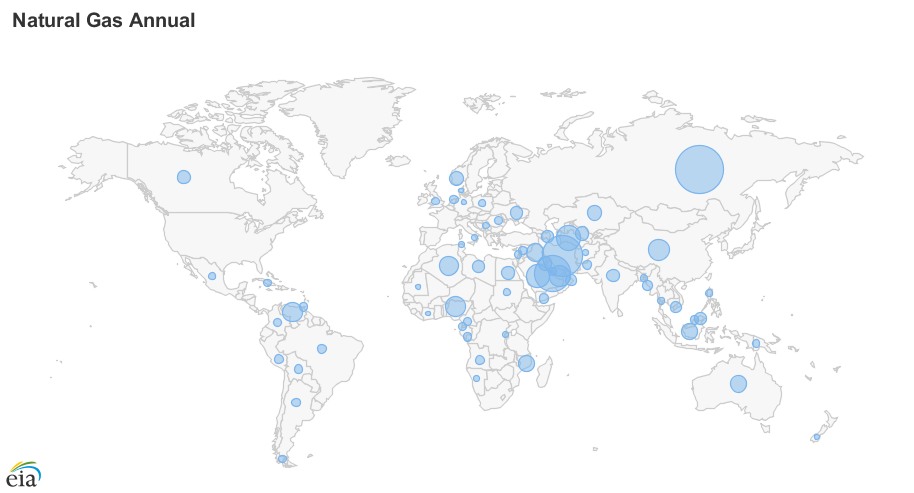
Figure \(\PageIndex{4}\): Global reserves of oil (top) and natural gas (bottom) by country in 2017 and 2020, respectively. The blue circle in each country is scaled to the size of the reserve. Both fossil fuels are abundant in the Middle East. Russia also has a rich supply of natural gas. Images from EIA (public domain).
The major holder of oil reserves is the Organization of Petroleum Exporting Countries, (OPEC). As of 2018, there were 15 member countries in OPEC: Algeria, Angola, Congo, Ecuador, Equatorial Guinea, Gabon, Iran, Iraq, Kuwait, Libya, Nigeria, Qatar, Saudi Arabia, the United Arab Emirates, and Venezuela. OPEC attempts to influence the amount of oil available to the world by assigning a production quota to each member except Iraq, for which no quota is presently set.
Overall compliance with these quotas is mixed since the individual countries make the actual production decisions. All of these countries have a national oil company but also allow international oil companies to operate within their borders. They can restrict the amounts of production by those oil companies. Therefore, the OPEC countries have a large influence on how much of world demand is met by OPEC and non-OPEC supply.
This pressure has lead the United States to developing policies that would reduce reliance on foreign oil such as developing additional domestic sources and obtaining it from non-Middle Eastern countries such as Canada, Mexico, Venezuela, and Nigeria. However, since fossil fuel reserves create jobs and provide dividends to investors, a lot is at stake in a nation that has oil reserves. Oil wealth may be shared with the country’s inhabitants or retained by the oil companies and dictatorships, such as in Nigeria prior to the 1990s.
Natural Gas Power Plants
Natural gas is burned to produce electricity following the same general process used in a coal power plant (figure \(\PageIndex{5}\)). Oil is occasionally used to generate electricity as well.
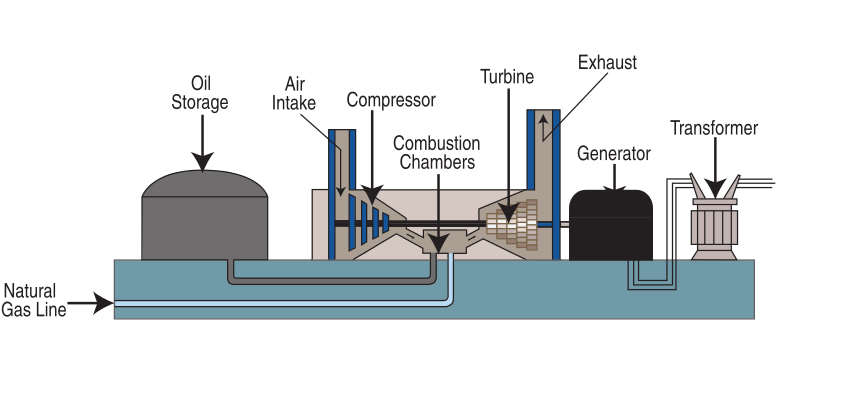
Figure \(\PageIndex{5}\): This combustion chamber burns either natural gas or oil. Fuel flows through a natural gas line or from oil storage into the combustion chamber. Air passes through the air intake and is compressed in the compressor. Natural gas and compressed air are mixed with compressed air in the combustion chamber and burned. High-pressure combustion gases spin the turbine, which drives the generator. The resultant electric current is then passed through a transformer, which alters voltage. Image and caption (modified) by Tennessee Valley Authority (public domain).
The Global Dependence of Transportation on Oil
Two-thirds of oil consumption is devoted to transportation, providing fuel for cars, trucks, trains and airplanes. For the United States and most developed societies, transportation is woven into the fabric of our lives, a necessity as central to daily operations as food or shelter. The concentration of oil reserves in a few regions or the world makes much of the world dependent on imported energy for transportation. The rise in the price of oil in the last decade makes dependence on imported energy for transportation an economic as well as an energy issue. The United States, for example, now spends upwards of $350 billion annually on imported oil, a drain of economic resources that could be used to stimulate growth, create jobs, build infrastructure and promote social advances at home.
Refining Crude Oil
The result of oil recovery is crude oil (petroleum), which contains many types of hydrocarbons as well as some unwanted substances such as sulfur, nitrogen, oxygen, dissolved metals, and water all mixed together. Unprocessed crude oil is therefore, not generally useful in industrial applications and must first be separated into different useable products (petrochemicals) at a refinery. Gasoline (petrol), diesel, tar, and asphalt are examples of petrochemicals.
Fractional distillation is the key process used in oil refineries to separate the components of crude oil. During fractional distillation, crude oil is heated and then allowed to cool. The heaviest compounds sink to the bottom as residues. Components of vaporized crude oil condense at different levels in the distillation column depending on their boiling points, which is primarily due to their molecular sizes. The heaviest compounds (condense near the bottom of the column, where the temperature is still high. Lighter compounds condense at cooler temperatures higher up in the column. Some compounds remain as gases at the top of the column (figure \(\PageIndex{6}\)).
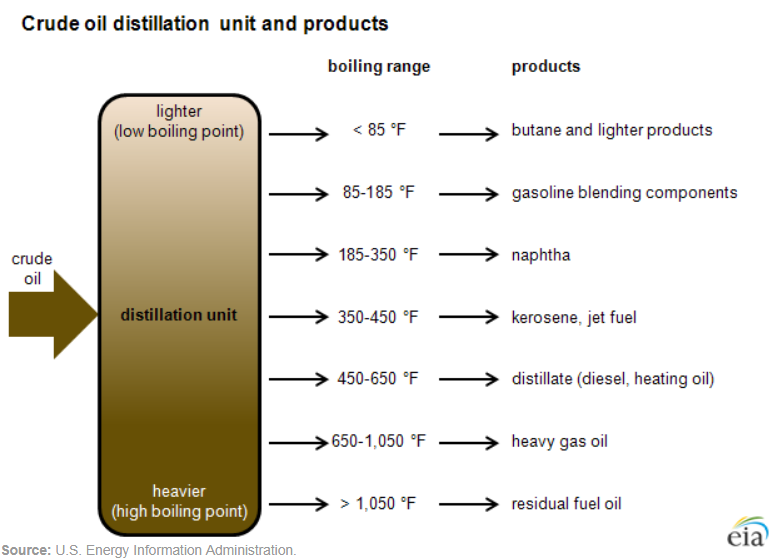
Figure \(\PageIndex{6}\): The process of fractional distillation involves heating crude oil and allowing the components to cool. As they move up the distillation column, they condense at different levels based on their boiling points. The heaviest compounds have the highest boiling points and condense at the bottom of the column while lighter compounds (low boiling point) condense at the top. From lowest to highest boiling point the petrochemicals produced are residual fuel oil (1050 °F), heavy gas oil (650-1050 °F), diesel and heating oil (450-650 °F), kerosene and jet fuel (350-450 °F), naphtha (used to make gasoline, solvents, cleaning solutions, etc.; 185-350 °F), gasoline blending components (85-185 °F), and butane and lighter products (< 85 °F). Image by U.S. Energy Information Administration (public domain).
The video below explains the process of fractional distillation. The labeled distillation column at 3:00 shows heated crude oil (400 °C) separating into various petrochemicals. From bottom to top, they are bitumen (> 350 °C), diesel (250-350 °C), kerosene (160-250 °C), naphtha (70-160 °C), petrol (20-70 °C), and gas (< 20 °C).
Conversion is the chemical processing in which some of the fractions (produced from fractional distillation) are transformed in to other products. For example, a refinery can turn diesel fuel into gasoline depending on the demand for gasoline. Conversion can involve breaking larger hydrocarbon chains into smaller ones (cracking), combining smaller chains into larger ones (unification), or rearranging the molecules to created desired products (alteration).
Treatment is done to the fractions to remove impurities such as sulfur, nitrogen and water among others. Refineries also combine the various fractions (processed and unprocessed) into mixtures to make desired products. For example, different mixtures of hydrocarbon chains can create gasolines with different octane ratings, with and without additives, lubricating oils of various weights and grades (WD-40, 10W-40, 5W-30, etc.), heating oil, and many others. The products are stored onsite until they can be delivered to various markets such as gas stations, airports and chemical plants.
A 42 U.S. gallon barrel of crude oil yields about 45 gallons of petroleum products because of refinery processing gain (figure \(\PageIndex{7}\)). This increase in volume is similar to what happens to popcorn when it is popped. Gasoline makes up the largest fraction of all petroleum products obtained. Other products include diesel fuel and heating oil, jet fuel, petrochemical feedstocks (to manufacture plastics, synthetic rubber, or other chemicals), waxes, lubricating oils, and asphalt.
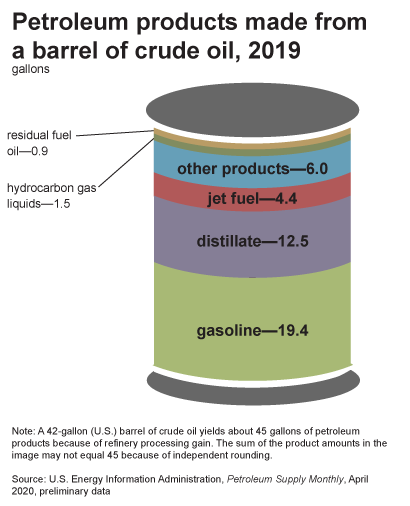
Figure \(\PageIndex{7}\): Main products (measured in gallons) made from a barrel of crude oil in 2019. These include residual fuel oil (0.9 gallons), hydrocarbon gas (1.5), other products (6.0), jet fuel (4.4), distillate (12.5), and gasoline (19.4). Note: A 42-gallon (U.S.) barrel of crude oil yields about 45 gallons of petroleum products because of refinery processing gain. The sum of the product amounts in the image may not equal 45 because of independent rounding. Image by EIA (public domain).
Oil refining is one of top sources of air pollution in the United States for volatile organic hydrocarbons and toxic emissions, and the single largest source of carcinogenic benzene. When petroleum is burned as gasoline or diesel, or to make electricity or to power boilers for heat, it produces a number of emissions that have a detrimental effect on the environment and human health:
- Carbon dioxide (CO2) is a greenhouse gas and a source of climate change.
- Sulfur dioxide (SO2) causes acid rain, which damages plants and animals that live in water, and it increases or causes respiratory illnesses and heart diseases, particularly in vulnerable populations like children and the elderly.
- Nitrous oxides (NOx) and Volatile Organic Carbons (VOCs) contribute to ozone at ground level, which is an irritant and causes damage to the lungs.
- Particulate Matter (PM) produces hazy conditions in cities and scenic areas, and combines with ozone to contribute to asthma and chronic bronchitis, especially in children and the elderly. Very small, or “fine PM,” is also thought to penetrate the respiratory system more deeply and cause emphysema and lung cancer.
- Lead can have severe health impacts, especially for children.
Transportation of Oil and Natural Gas
Most of the production of oil and natural gas occurs in remote areas, while most consumption is in densely populated areas. Consequently, enormous quantities of petroleum and its refined products are transported over great distances, mostly by overland pipelines, railroads, and trucks. A system of pipelines runs throughout the United States to transport oil and fuels from one location to another. There are pipelines that transport crude oil from the oil well to the refinery. At the refinery, there are additional pipelines that transport the finished product to various storage terminals where it can then be loaded onto trucks for delivery, such as to a gas station. On the global scale, most petroleum and its refined products are transported by oceanic tankers and overland pipelines. Local distribution systems involve smaller tankers, barges, pipelines, railroads, and trucks. There is a risk of accidental spillage from all of these means of transportation. Some of the spills have been spectacular in their volume and environmental damage. In addition, petroleum is discharged into the environment by many smaller sources, which sum to a large cumulative amount.
Once natural gas is produced from underground rock formations, it is sent by pipelines to storage facilities and then on to the end user. The United States has a vast pipeline network that transports gas to and from nearly any location in the lower 48 states. There are more than 210 natural gas pipeline systems, using more than 300,000 miles of interstate and intrastate transmission pipelines (figure \(\PageIndex{8}\)). Compressor stations that maintain pressure on the natural gas to keep it moving through the system. There are more than 400 underground natural gas storage facilities that can hold the gas until it is needed back in the system for delivery.
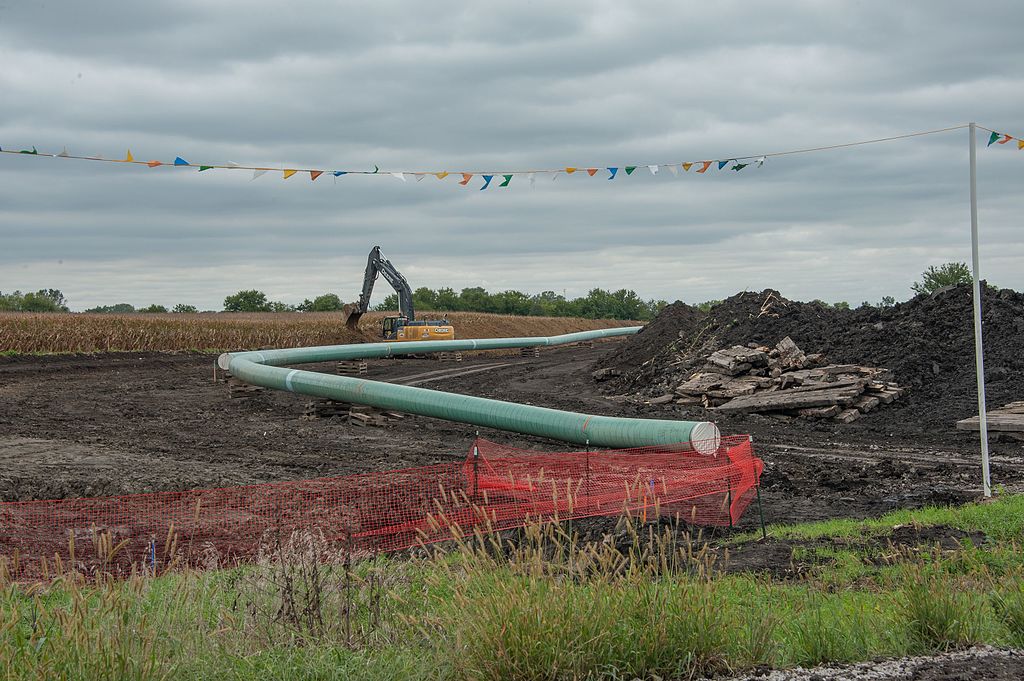
Figure \(\PageIndex{8}\): Construction of the controversial Dakota Access Pipeline, which stretches from North Dakota to Illinois. The pictured portion of the pipeline is in Central Iowa. You can learn more about the 2016 protests against this pipeline here. Image by Dakota Access Pipe Line (CC-BY).
Natural gas is released into the atmosphere from coal mines, oil and gas wells, and natural gas storage tanks, pipelines, and processing plants. These leaks are the source of about 25% of total U.S. methane emissions, which translates to three percent of total U.S. greenhouse gas emissions, contributing to climate change. When natural gas is produced but cannot be captured and transported economically, it is “flared,” or burned at well sites, which converts it to carbon dioxide. This is considered to be safer and better than releasing methane into the atmosphere because carbon dioxide is a less potent greenhouse gas than methane. However, when natural gas with high concentrations of the toxic gas hydrogen sulfide is flared, it produces carbon dioxide, carbon monoxide, sulfur dioxide, nitrogen oxides, and many other compounds (see Air Pollution for more details).
Leaks also happen when we use petrochemicals on land. For example, gasoline sometimes drips onto the ground when people are filling their gas tanks, when motor oil gets thrown away after an oil change, or when fuel escapes from a leaky storage tank. When it rains, the spilled petrochemicals get washed into the gutter and eventually flow to rivers and into the ocean. Another way that oil sometimes gets into water is when fuel is leaked from motorboats and jet skis. When a leak in a storage tank or pipeline occurs, petrochemicals can also get into the ground, and the ground must be cleaned up. To prevent leaks from underground storage tanks, all buried tanks are supposed to be replaced by tanks with a double lining.
Oil Spills
Human-caused oil spills in rivers and oceans harm ecosystems. From an economic perspective, oil spills disrupt the fishing industry and tourism. Oil spills at sea are generally much more damaging than those on land, since they can spread for hundreds of nautical miles in a thin oil slick which can cover beaches with a thin coating of oil. This can kill sea birds, mammals, shellfish and other organisms it coats. Oil spills on land are more readily containable if a makeshift earth dam can be rapidly bulldozed around the spill site before most of the oil escapes, and land animals can avoid the oil more easily.
Oil spills onto land are relatively common. Between 1989 and 1995, about 3,500 spills per year were reported in Canada – most all were relatively small, although by law they must be reported (Environment Canada, 1998). About 42% of the spills occurred in the vicinity of production wells, while 29% were from pipelines, and 16% from tanker trucks. During that period, up to 140-thousand t of oil was spilled per year in petroleum-producing areas, due to accidental losses and well blowouts. In another study of the period 2000 to 2011, a total of 1,047 spills were reported from oil or gas pipelines in Canada (Kheraj, 2013).
During an oil spill on water, oil floats to the surface because it is less dense than water, and the lightest hydrocarbons evaporate, decreasing the size of the spill but polluting the air. Then, bacteria begin to decompose the remaining oil, in a process that can take many years. After several months only about 15% of the original volume may remain, but it is in thick asphalt lumps, a form that is particularly harmful to birds, fish, and shellfish. Cleanup operations can include a variety of components, but each has its procs and cons. Skimmer ships that vacuum oil from the water surface, but these are effective only for small spills. Controlled burning works only in early stages before the light, ignitable part evaporates, but this also pollutes the air. Dispersants are detergents that break up oil to accelerate its decomposition, but some dispersants may be toxic to the ecosystem. Bioremediation refers to adding microorganisms that specialize in quickly decomposing oil, but this can disrupt the natural ecosystem.
Oil spills can result from supertanker accidents such as the accidental grounding of the Exxon Valdez in 1989, which spilled 10 million gallons of oil into the rich ecosystem of coastal Alaska and killed massive numbers of animals. A significant amount of the petroleum extracted in the United States is mined in northern Alaska, from where a 1,280 km pipeline carries it south to the port of Valdez. The oil is then transported to markets in the western U.S. by a fleet of supertankers. The first part of the oceanic passage runs through a narrow shipping channel in Prince William Sound. Before the Exxon Valdez accident in March, 1989, tankers had navigated that passage about 16-thousand times. However, the Exxon Valdez, the newest tanker in the Exxon fleet, was steered onto a submerged reef, resulting in a spill of 36-thousand tonnes of its 176-thousand tonnes load of petroleum. About 40% of the spill washed onto shoreline habitat of Prince William Sound, while 25% was carried out of the sound by currents, and 35% evaporated at sea. Less than 10% was recovered or burned at sea.
The environmental damage was compounded by a lack of preparedness by industry and government for dealing with an oil-spill emergency. Essential equipment for containment and oil recovery was not immediately available, and it took too long to mobilize trained personnel. Consequently, despite favorable sea conditions during the first critical days after the grounding, few effective oil-spill countermeasures were mounted. Not until the second day of the spill was it possible to off-load unspilled petroleum from the Exxon Valdez to another tanker, and not until the third day were floating booms deployed to contain part of the spill. Unfortunately, a gale developed on the fourth day, making it impossible to contain or recover spilled petroleum, which then became widely dispersed. The region around Prince William Sound is famous for its spectacular scenery and large populations of wildlife. Some ecological communities and species were severely damaged by the oil spill. However, controversies have arisen about both the poor understanding of some ecological effects, and the role of science and scientists in sorting out legal and political aspects of the disaster (Holloway, 1996; Weins, 1996). For a long time, some scientists were prohibited from sharing their information because of legal needs for confidentiality. Controversies arose among scientists, environmental advocates, and other interest groups about the scale and intensity of some of the reported damages. About 1,900 km of shoreline habitat was oiled to some degree. A survey found that 140 km was “heavily oiled,” meaning there was at least a 6 m wide oiled zone. Another 93 km were “moderately oiled” (3-6 m wide zone), 323 km were “lightly oiled” (3 m wide), and the rest “very lightly oiled” (< 10% cover of oil). Overall, about 20% of the shoreline of the Sound, plus 14% of beaches on the nearby Kenai Peninsula and Kodiak Island, suffered some degree of oiling. A heroic and extremely expensive effort was undertaken to clean up some of the pollution from oiled beaches. About 11-thousand people were involved, costing the Exxon corporation about US$2.5 billion. The U.S. government spent an additional US$154 million. Residues were removed from heavily oiled beaches by machines and people wielding shovels and bags. Other places were cleaned by pressurized streams of hot or cold water. On some beaches, people actually wiped oiled rocks with absorbent cloths, a procedure that was ironically referred to as “rock polishing”.
These cleanup efforts helped greatly, and they were aided by natural processes, especially winter storms and microbial degradation of residues. Consequently, the amount of residues on beaches declined rapidly in the years following the spill. One survey of 28 polluted sites found an average of 37% surface oil cover in the first post-spill summer of 1989, but less than 2% in 1990. Another survey in 1991, after two post-spill winters and three summers, found that fewer than 2% of the beaches still had visible surface residues, compared with 20% in the first summer after the spill. However, subsurface residues still existed in many places. Initially, severe damage was caused to the seaweed-dominated intertidal zone of affected coastlines. These effects were made worse by certain cleanup methods, particularly washing with pressurized hot water. Fortunately, much of this damage proved to be short term, and by the end of 1991 a substantial recovery of seaweeds and invertebrates had begun. However, there were lingering effects on community structure, and vestiges of oil were still present 15 years later at some sites.
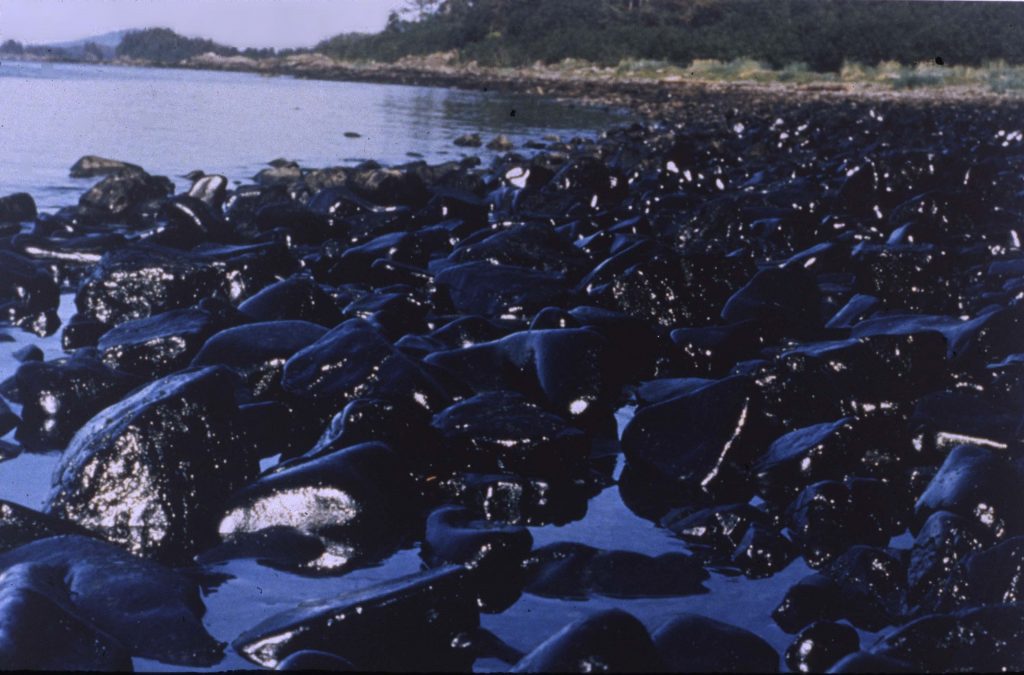
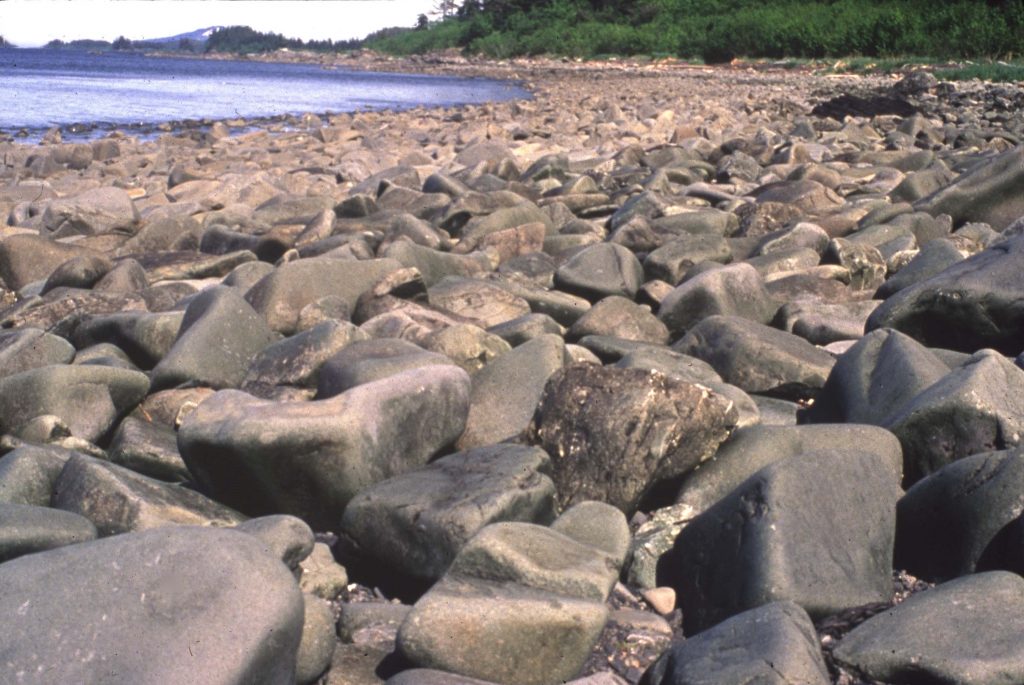
Figure \(\PageIndex{9}\): The top photo shows a heavily oiled beach on Green Island, Prince William Sound, soon after the Exxon Valdez disaster in 1989. The site was cleaned with warm-water washing in 1989, and then manually in 1990. In 1990 and 1991, it was treated with fertilizer to enhance microbial breakdown of the petroleum residues. The bottom photo shows the improved condition of the same beach in 1992, as a result of the natural and managed cleanups. Although little visible damage occurs on the surface, there are hydrocarbon residues deeper in the substrate. Source: Exxon Corporation.
Sea otters (Enhydra lutris) were the hardest-hit marine mammals. More than 3,500 otters were killed by oiling, out of a population of 5-10-thousand. A total of 357 oiled sea otters were captured and treated, of which 223 survived and were released or placed in zoos. Seabirds are very abundant in the region, particularly so in the autumn when certain species aggregate there during their southern migration. At that time, about 10-million seabirds may inhabit the Sound. Fortunately, the Exxon Valdez disaster happened in late winter, but there were still about 600-thousand seabirds present. About 36-thousand dead birds were found, but many additional corpses sank or drifted out to sea, and the total mortality may have been 375-435-thousand seabirds. About 400 people, 140 boats, and 5 aircraft were hired by Exxon to capture and rehabilitate oiled birds. They managed to treat 1,600 birds of 71 species, but half of them died of their injuries. The rest were treated and released to the wild, but the lingering effects of hydrocarbon poisoning likely prevented most of them from surviving for long. Even bird and mammal populations that suffered large mortality recovered to their natural abundance within a decade or less. From a strictly environmental perspective, the habitats affected by the disaster showed an impressive amount of resilience.
On the night of April 20, 2010, the Deepwater Horizon oil rig, one of hundreds operating in the Gulf of Mexico, exploded, killing eleven men, and placing one of the most rich and diverse coastal regions on earth in imminent danger of petroleum poisoning (figure \(\PageIndex{10}\)). BP had been drilling in waters a mile deep, and in the next two days, as the rig slowly sank, it tore a gash in the pipe leading to the oil well on the ocean floor. The blowout was apparently caused by a failure of the casing of the borehole and also of the fail-safe blowout preventer. These likely occurred because of an unwise engineering decision to use an insufficient cementing regime for the borehole despite encountering extremely high geological pressure during the drilling. This resulted in a fire and explosion on the drilling platform, which sank during the fire-fighting action because of the enormous amounts of water poured into it. The blowout lasted for 87 days and two hundred million gallons of crude oil poured into the Gulf before the technological means could be found to seal the undersea well. It was the worst environmental disaster in American history, and the largest peacetime oil spill ever.
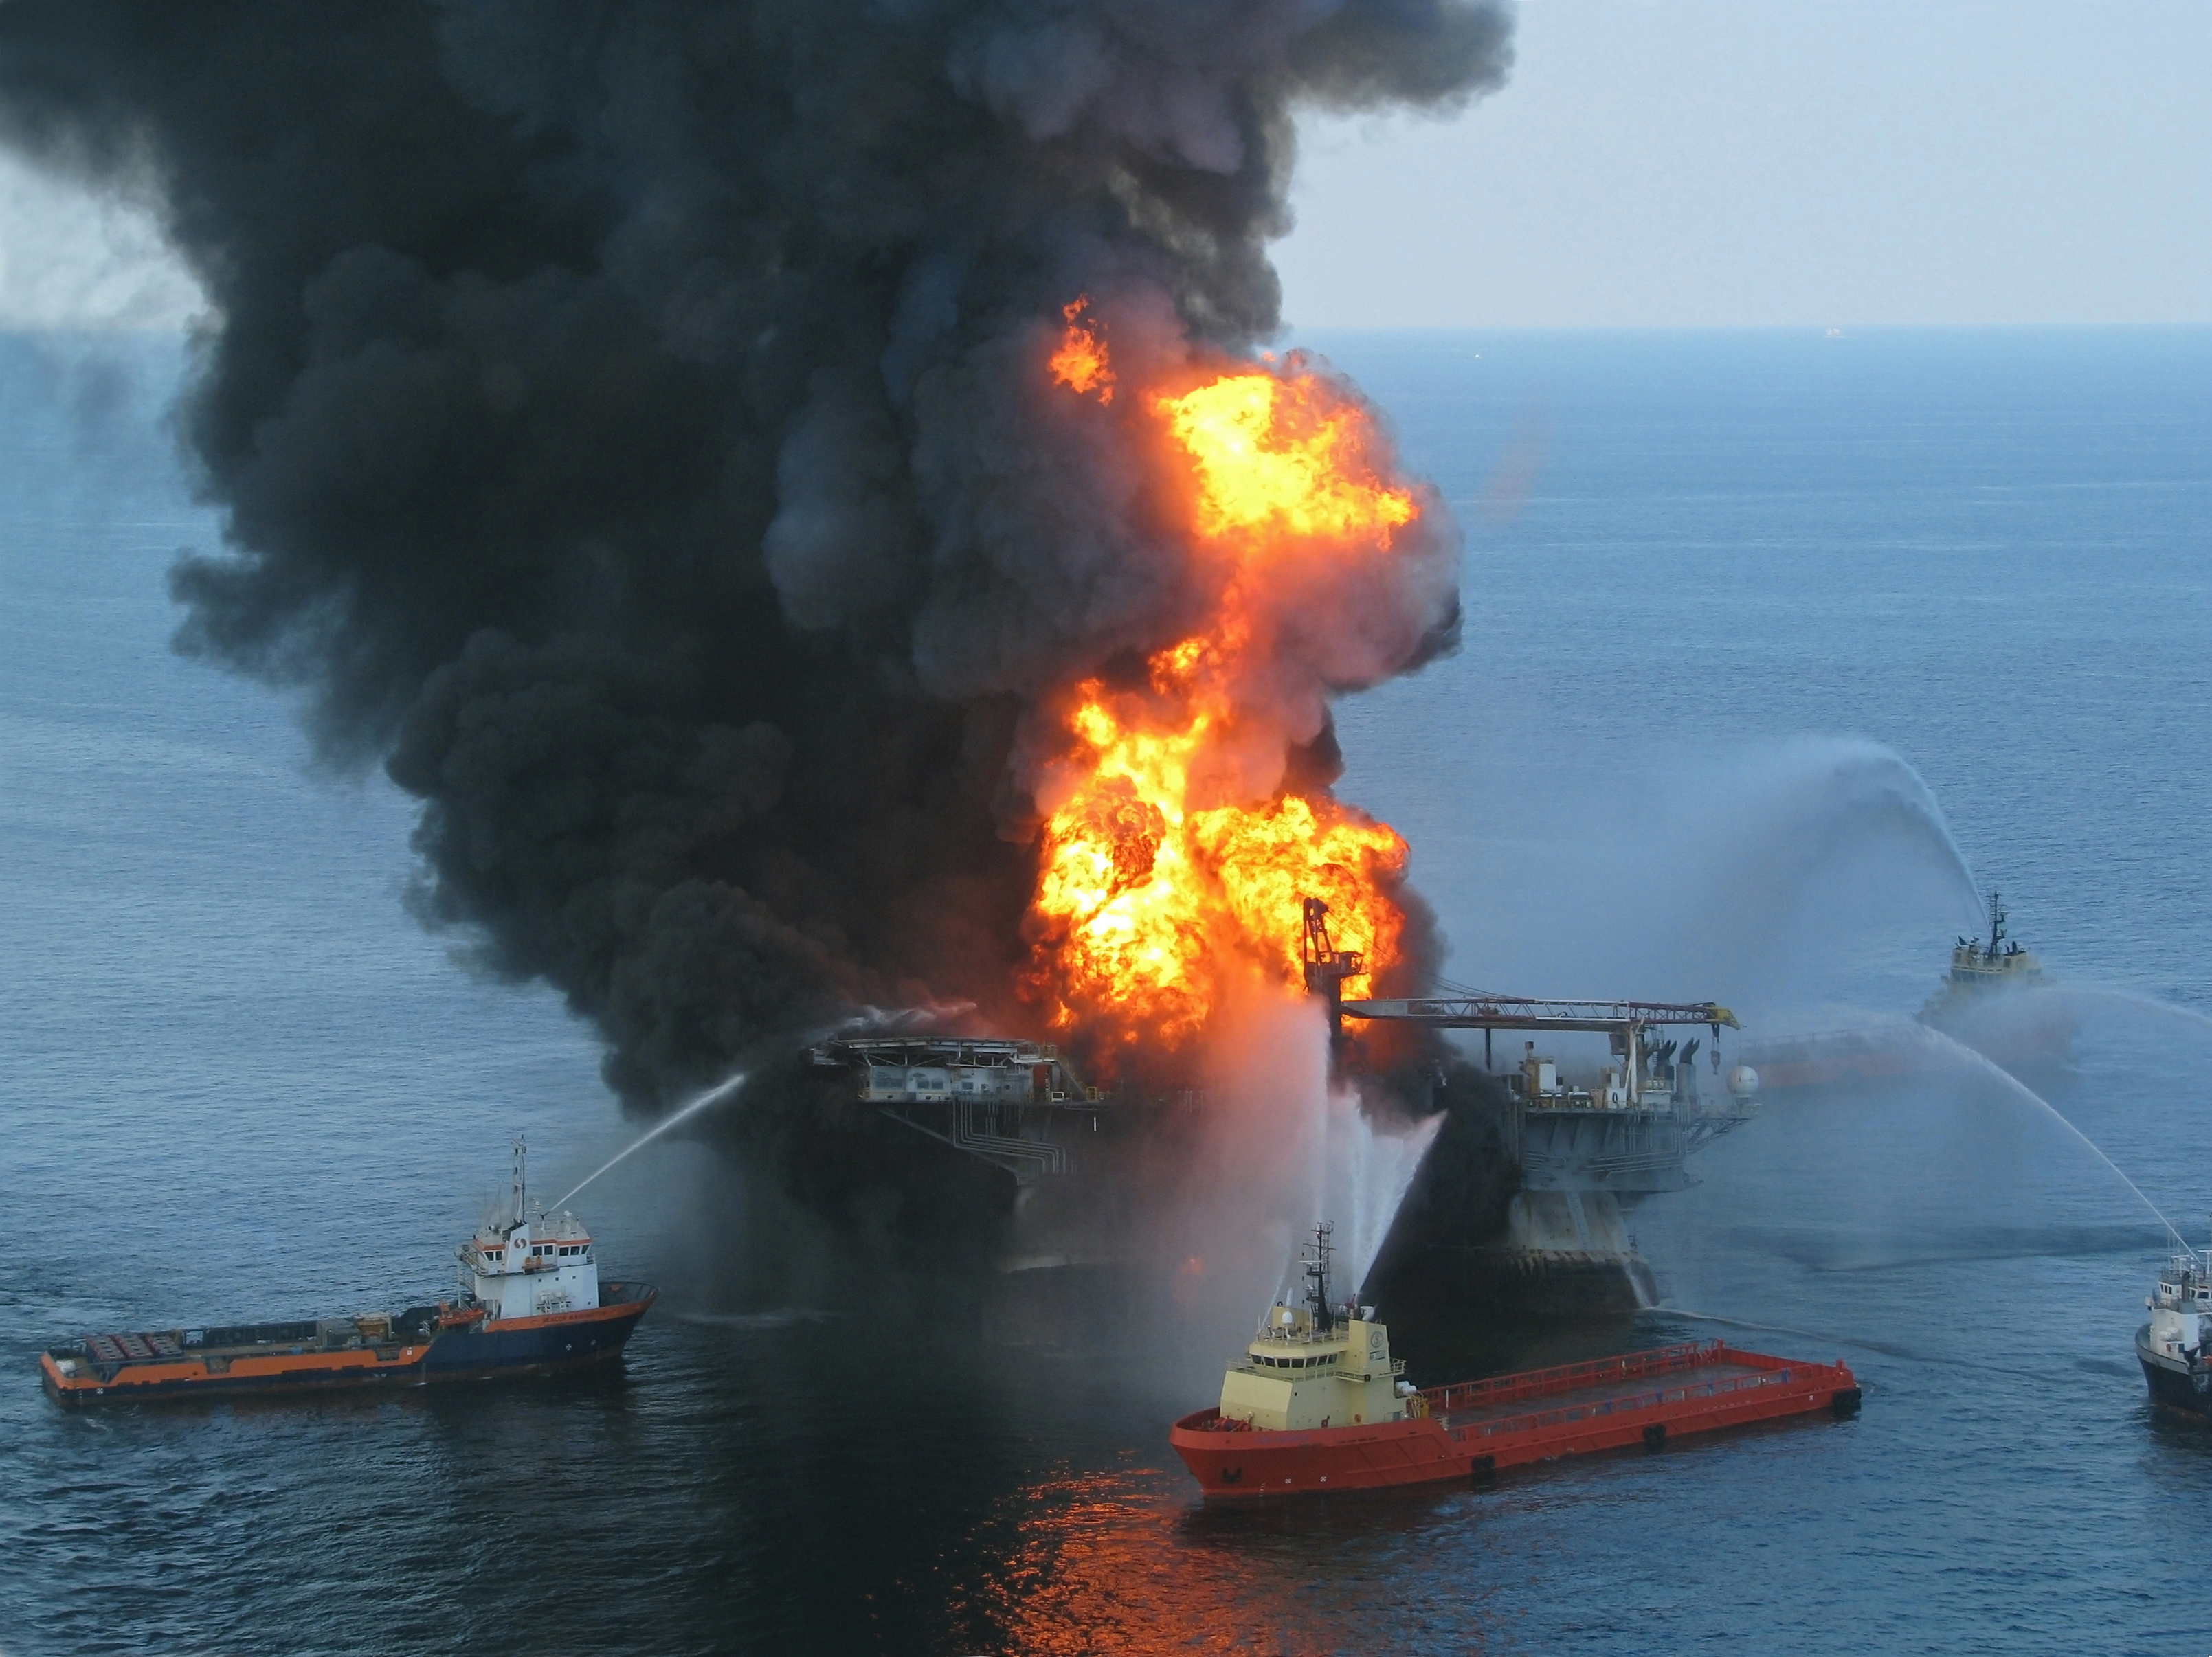
Figure \(\PageIndex{10}\): Platform supply vessels battle the blazing remnants of the off shore oil rig Deepwater Horizon. A Coast Guard MH-65C dolphin rescue helicopter and crew document the fire aboard the mobile offshore drilling unit Deepwater Horizon, while searching for survivors. Multiple Coast Guard helicopters, planes and cutters responded to rescue the Deepwater Horizon's 126 person crew. Image and caption (modified) from US Coast Guard (public domain).
Wildlife, ecosystems, and people’s livelihood were adversely affected as crude oil spread over as much as 176-thousand km2 of water and affected beaches from western Florida to Texas, and caused tens of billions of dollars of economic damage. A lot of money and huge amounts of energy were expended on immediate clean-up efforts. About 7,000 m3 of dispersant was used to help protect coastal infrastructure and habitats, and also to disperse the petroleum as it issued from the subsea blowout itself. Despite the enormous effort, considerable damage was done to natural habitats, recreational beaches, the commercial fishery, and harbors. The long-term impacts are still not known. Subsequent legal actions found that British Petroleum (BP), the operator of the drilling project, bore primary responsibility for the disaster. Eventually, BP paid more than US$42-billion in criminal and civil settlements. The very fact that BP was drilling under such risky conditions—a mile underwater, in quest of oil another three miles under the ocean floor—is an expression of the global demand for oil, the world’s most valuable energy resource.
The world’s largest-ever marine spill occurred during the brief Persian Gulf War of 1991. Iraqi forces deliberately released huge quantities of petroleum (about 0.8-million tonnes or approximately 200 million gallons) into the Gulf of Arabia from a Kuwaiti coastal loading facility. In part, this spill was a tactic of warfare – an attempt to make it difficult for Allied forces to execute an amphibious landing during the liberation of Kuwait. Mostly, however, the spill was an act of economic and ecological terrorism. The Iraqis also caused an enormous spillage on land during that war by igniting the more than 700 production wells in Kuwait that released enormous clouds of smoke and acid rain for over nine months.. An estimated 2-6 million tonnes of petroleum per day were emitted from the burning wells. After the Gulf War was over, it took 11 months to control and cap the blowouts. By that time, an immense 42-126-million tonnes of petroleum had spilled. Most of the crude oil burned in the atmosphere or evaporated, but 5-21 million tonnes accumulated as vast crude-oil lakes in the desert around the blowouts.
The Future of Natural Gas and Coal
The future development of coal and natural gas depend on the degree of public and regulatory concern for carbon emissions, and the relative price and supply of the two fuels. Supplies of coal are abundant in the United States, and the transportation chain from mines to power plants is well established. The primary unknown factor is the degree of public and regulatory pressure that will be placed on carbon emissions. Strong regulatory pressure on carbon emissions would favor retirement of coal and addition of natural gas power plants. This trend is reinforced by the recent dramatic expansion of shale gas reserves in the United States due to advances in drilling technology. Shale natural gas production has increased 48% annually in the years 2006 – 2010, with more increases expected. Greater United States production of shale gas will gradually reduce imports and could eventually make the United States a net exporter of natural gas.
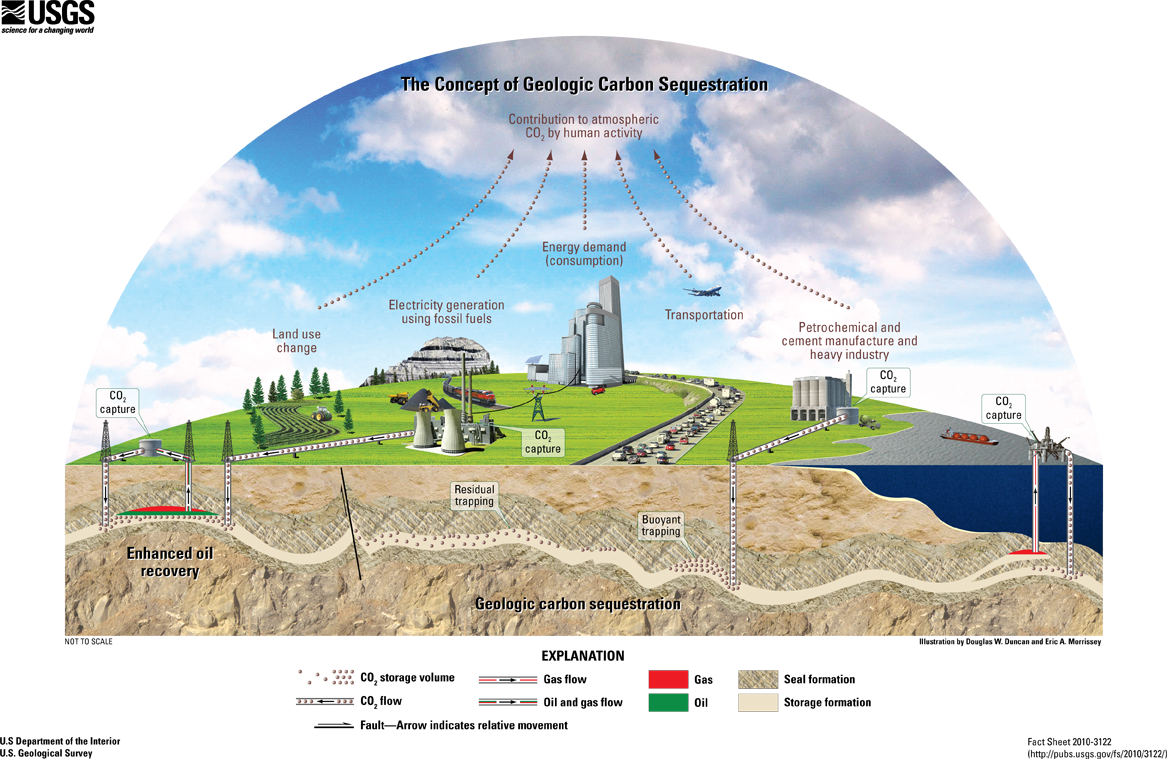
Clean coal technologies can limit the air pollution released when burning coal. Some of these technologies remove toxins from coal before burning it while others capture toxins that are released while burning coal. For example, smokestack scrubbers in power plants clean sulfur dioxide, nitrous oxide, particulate matter, and mercury from the smoke before it is released. Carbon capture and sequestration involves capturing carbon dioxide released and storing it, but it requires 25-40% more energy, reducing the efficiency of coal (figure \(\PageIndex{10}\)). In this process, smoke from a coal power plant is passed through a solvent to trap carbon dioxide, but other waste gases are still released in the smoke. Carbon dioxide is then separated from the solvent. Some can be used in industry (such as for carbonated beverages or to tertiary recovery of oil), and the rest is sequestered (stored) underground. Note that clean coal technologies can reduce coal's contribution to climate change and reduce the amount of toxins that are released, but it does not fully prevent coal-generated air pollution (figure \(\PageIndex{10}\)).
References
Baker, B., B. Campbell, R. Gist, L. Lowry, S. Nickerson, C. Schwartz, and L. Stratton. 1989. Exxon Valdez oil spill: the first eight weeks. Alaska Fish & Game, 21 (4): 2-37.
Davidson, A. 1990. In the Wake of the Exxon Valdez. Douglas & McIntyre, Toronto, ON.
Earle, S. 1992. Assessing the damage one year later (after the Gulf oil spill). National Geographic, 179 (2): 122-134.
GESAMP. 1991. Carcinogens: Their Significance as Marine Pollutants. Report 46, Joint Group of Experts on the Scientific Aspects of Marine Pollution (GESAMP), International Marine Organization, London, UK.
GESAMP. 1993. Impact of Oil and Related Chemicals and Wastes in the Marine Environment. Report 50, Joint Group of Experts on the Scientific Aspects of Marine Pollution (GESAMP), International Marine Organization, London, UK.London.
GESAMP. 2007. Estimates of Oil Entering the Marine Environment from Sea-Based Activities. Joint Group of Experts on the Scientific Aspects of Marine Pollution (GESAMP), International Marine Organization, London, UK.
Holloway, M. 1996. Sounding out science. Scientific American, 275 (4): 106-112.
Holloway, M. and J. Horgan. 1991. Soiled shores. Scientific American, 265 (4): 103-116.
Keeble, J. 1999. Out of the Channel: The Exxon Valdez Oil Spill in Prince William Sound. Eastern Washington University Press, Seattle, WA.
Kheraj, S. 2013. Tracking Canada’s History of Oil Pipeline Spills, 1949-2012. ActiveHistory.ca http://activehistory.ca/2013/11/tracking-canadas-history-of-oil-pipeline-spills/
Koons, C.B. and H.O. Jahns. 1992. The fate of oil from the Exxon Valdez; A perspective. Marine Technical Society Journal, 26: 61-69.
National Academy of Sciences (U.S.). 2003. Oil in the Sea: Impacts, Fates, and Effects. National Academy of Sciences, Washington, DC.
National Commission on the BP Deepwater Horizon Oil Spill and Offshore Drilling. 2011. Deep Water: The Gulf Oil Disaster and the Future of Offshore Drilling: Report to the President. Washington, DC.
Paine, R.T., J.L. Ruesink, A. Sun, E.L. Soulanille, M.L. Wonham, C.D.G. Harley, D.R. Brumbaugh, and D.L. Secord. 1996. Trouble on oiled waters: lessons from the Exxon Valdez oil spill. Annual Reviews of Ecology and Systematics, 27: 197-235.
Warner, F. 1991. The environmental consequences of the Gulf War. Environment, 33 (5): 7–26.
Weins, J.A. 1996. Oil, seabirds, and science: the effects of the Exxon Valdez oil spill. BioScience, 46: 587-597.
Wells, P.G., J.N. Butler, and J.S. Hughes. 1995. Exxon Valdez Oil Spill: Fate and Effects in Alaskan Waters. American Society for Testing and Materials, Philadelphia, PA.
Contributors and Attribution
Modified by Kyle Whittinghill and Melissa Ha from the following sources:
- Challenges and Impacts of Energy Use, and Water Pollution, and Non-Renewable Energy Sources from Environmental Biology by Matthew R. Fisher (licensed under CC-BY)
- Hannah Ritchie (2017) - "Fossil Fuels". Published online at OurWorldInData.org. Accessed 01-16-2021. (licensed under CC-BY)
- Non-Renewable Energy Sources from Environmental Biology by Matthew R. Fisher (licensed under CC-BY)
- Fossil Fuels and Mining from An Introduction to Geology by Chris Johnson et al. (licensed under CC-BY-NC-SA)
- Chapter 4: Non-Renewable Energy from Introduction to Environmental Science: 2nd Edition (2018) Biological Sciences Open Textbooks by Zehnder, Caralyn; Manoylov, Kalina; Mutiti, Samuel; Mutiti, Christine; VandeVoort, Allison; and Bennett, Donna (licensed under CC-BY-NC-SA).
- Fossil Energy Study Guide: Natural Gas. 2014. U.S. Department of Energy. Accessed 01-12-2021.
- Fossil Energy Study Guide: Oil. 2013. U.S. Department of Energy. Accessed 01-12-2021.
- Essentials of Environmental Science by Kamala Doršner is licensed under CC BY 4.0.
- Environmental Challenges in Energy, Carbon Dioxide, Air, Water and Land Use, Case Study: Energy and the BP Oil Disaster, and Fossil Fuels from Sustainability: A Comprehensive Foundation by Tom Theis and Jonathan Tomkin, Editors. Textbook content produced by Tom Theis and Jonathan (CC-BY). Download for free at CNX.
-