
9.2: Population Ecology Research Methods
- Page ID
- 69856
Population ecology research methods
Quadrat-based methods are frequently used by plant ecologists
The most accurate way to determine population size is to simply count all of the individuals within the habitat. However, this method is often not logistically or economically feasible, especially when studying large habitats. Thus, scientists usually study populations by sampling a representative portion of each habitat and using this data to make inferences about the habitat as a whole. A variety of methods can be used to sample populations to determine their size and density. For immobile organisms such as plants, or for very small and slow-moving organisms, a quadrat may be used (Figure \(\PageIndex{1}\)). A quadrat is a way of marking off square areas within a habitat, either by staking out an area with sticks and string, or by the use of a wood, plastic, or metal square placed on the ground. After setting the quadrats, researchers then count the number of individuals that lie within their boundaries. Multiple quadrat samples are performed throughout the habitat at several random locations. All of this data can then be used to estimate the population size and population density within the entire habitat. The number and size of quadrat samples depends on the type of organisms under study and other factors, including the density of the organism. For example, if sampling daffodils, a 1 m2 quadrat might be used whereas with giant redwoods, which are larger and live much further apart from each other, a larger quadrat of 100 m2 might be employed. This ensures that enough individuals of the species are counted to get an accurate sample that correlates with the habitat, including areas not sampled.
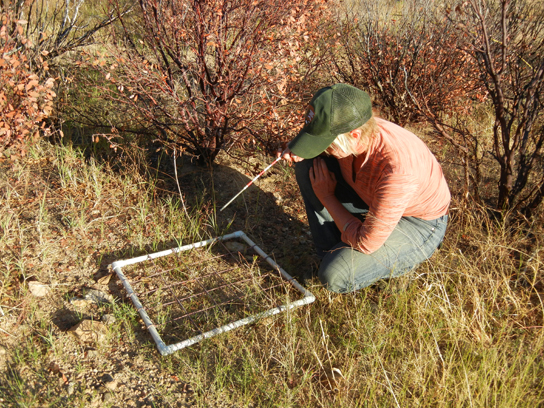
Figure \(\PageIndex{1}\): A scientist uses a quadrat to measure population size and density. (credit: NPS Sonoran Desert Network)
Distance sampling methods estimate the density of organisms
Other techniques for sampling populations to estimate density or abundance are distance sampling methods. The main methods are based on line transects or point transects (Buckland et al 1993, Buckland et al 2003). In this method of sampling, the data collected are the distances of the objects being surveyed from these randomly placed lines or points, and the objective is to estimate the average density of the objects within a region (Everitt 2002). When using line transects, the observer randomly places a straight line or follows some pre-planned route through the habitat of the population of interest, then walks the line or route. Whenever the researcher observes an object of interest (e.g., an animal of the type being surveyed), they record the observation, the distance from their current position to the object (r), as well as the angle of the detection to the transect line (θ). The distance of the object to the transect can then be calculated using trigonometry as x = r * sin(θ). These distances x are the detection distances that will be analyzed in further modeling aspects of the population (e.g., population distribution in space).
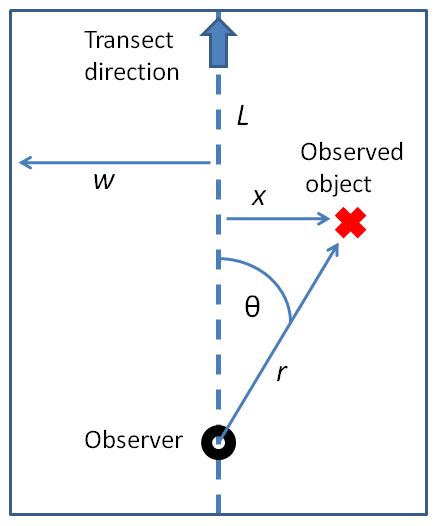
Figure \(\PageIndex{2}\): Basic distance sampling survey approach using line transects. A field observer detects an object and records distance r and angle θ to the transect line. This allows the calculation of object distance to the transect (x). All x from the survey are used to model how detectability decreases with distance from the transect, which allows estimation of total population density in the surveyed area. (Elmidae)
Distance-based methods are frequently used for animals with observers making their observations while walking, riding in trucks, or in low-flying aircraft. They can also be used for tasks such as surveying for very rare trees (Kissa and Sheil 2012) or plants.
Mark-recapture methods estimate the abundance of animals
For mobile organisms, such as mammals, birds, or fish, a technique called mark and recapture is often used. This method involves marking a sample of captured animals in some way (such as tags, bands, paint, or other body markings), and then releasing them back into the environment to allow them to mix with the rest of the population; later, a new sample is collected, including some individuals that are marked (recaptures) and some individuals that are unmarked (Figure \(\PageIndex{3}\)).
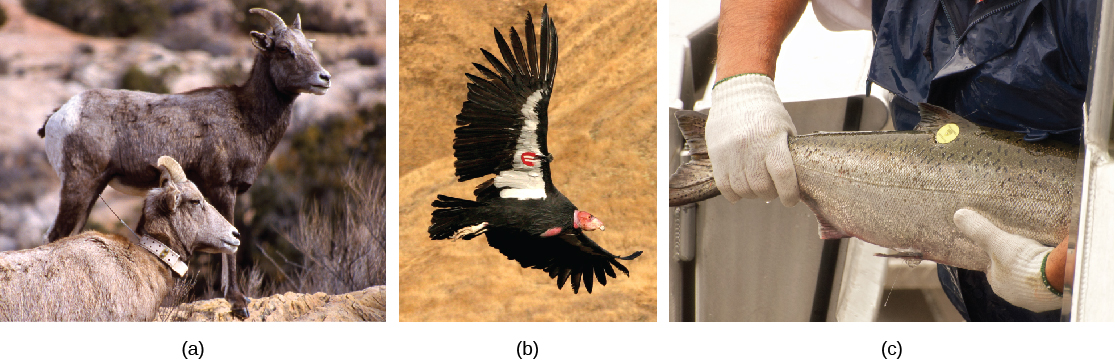
Figure \(\PageIndex{3}\): Mark and recapture is used to measure the population size of mobile animals such as (a) bighorn sheep, (b) the California condor, and (c) salmon. (credit a: modification of work by Neal Herbert, NPS; credit b: modification of work by Pacific Southwest Region USFWS; credit c: modification of work by Ingrid Taylar)
Using the ratio of marked and unmarked individuals, scientists determine how many individuals are in the sample. From this, calculations are used to estimate the total population size. This method assumes that the larger the population, the lower the percentage of tagged organisms that will be recaptured since they will have mixed with more untagged individuals. For example, if 80 deer are captured, tagged, and released into the forest, and later 100 deer are captured and 20 of them are already marked, we can determine the population size (N) using the following equation:
\[ \dfrac{\textrm{(number marked first catch)} ∗ \textrm{(total number of second catch)}}{\textrm{number marked second catch}} = N \]
Using our example data,
\[ \dfrac{80*100}{20} = 400 \nonumber\]
Therefore, there are an estimated 400 total individuals in the original population.
A common issue with mark-recapture methods is that the process of capturing and marking the animals changes their behavior. This is known generally as a trap response. Some animals from the first catch may learn to avoid capture in the second round, thus inflating population estimates; this is known as trap shyness. Alternatively, animals may preferentially become trap-happy and be more likely to be re-trapped (especially if a food reward is offered), resulting in an underestimate of population size. In some cases, individuals may be harmed by the capture and marking technique, reducing their survival. Advanced mathematical techniques exist for dealing with trap shyness and trap happiness; if mark-recapture methods cause harm to animals, however, the method should not be used.
A variety of other techniques have been developed to collect mark-recapture and similar data, including the electronic tracking of animals tagged with radio or GPS transmitters. Techniques also exist for using trapping-only data such as hunting or commercial fishing operations to estimate the size and health of populations and communities.
1) You marked 50 whales at the beginning of the breeding season in 2022 and, during a re-sighting survey at the end of the breeding season, counted 100 whales, 2 of which were tagged. What is your estimate of the total breeding population size in 2022?
2) Do you have any concerns about the validity of your answer?
3) After conducting your mark-recapture study, you find out that female gray whales migrate before male gray whales do, so not all whales would have returned to the breeding grounds when you marked individuals at the start of the season. Using the mark-recapture equation, briefly describe how this impacts the accuracy of your population estimate.
- Answer
-
1) N = (M * S)/R = (50*100)/2 = 2500 whales estimated as the total breeding population size in 2022
2) Two is a very small sample size of re-sightings, making it difficult to ensure accuracy. Far more whales were counted at the end, suggesting that the effort may have been varied throughout the study. Also, sighting whales is difficult due to long diving periods, potentially leading to some whales not being counted, despite being present.
3) M/N = R/S but in this scenario, because N at the time of marking was not the actual size of the population, the R/S ratio at the end of the season will be smaller than predicted (since S will be larger than expected because not all of those individuals were there at the start of the season). As a result, M/N and N will be underestimated.
Contributors and Attributions
This chapter was written by N. Brouwer with text taken from the following CC-BY resources:
- Distance sampling by Wikipedia, the free encyclopedia
- OpenStax Biology 2e Section 45.1 Population Demography