
9.1: What is population ecology?
- Page ID
- 69854
What is population ecology?
Thousands of bird species breed and reproduce in North America. Some, like the American Robin (Turdus migratorius), are widespread, and can be found building nests and raising their young in every state of the USA, several Canadian provinces, and many locations in Mexico. Others, like Kirtland's Warbler (Setophaga kirtlandii) breed almost entirely within a single state (Fig. 9.1.1); a few, like the Cozumel thrasher (Toxostoma guttatum) and Socorro mockingbird (Mimus graysoni) are found only on single small islands. Population ecologists study what determines the occurrence and abundance of species in space and time: their geographic ranges, population sizes and densities, and what factors result in them being so rare or common.
Population ecology is the science of population dynamics in space and time
Ecology is often defined as the study of the distribution and abundance of organisms. Population ecology is the branch of ecology that works to understand the patterns and processes of change over time or space for populations of a single species. A species is typically defined as a group of organisms capable of interbreeding. For some species, all of the members of the species occur in the same geographic area and could potentially meet and interbreed during their lifetimes. Most species, however, can be divided into geographically separate populations. Individuals within a single population are likely to interact and perhaps inter-breed, while those from different populations will only come into contact if there is long-range movement between the populations (dispersal).
Populations can be described by their size, density, or spatial extent
One species that currently consists of a single population is the Kirtland’s warbler (Setophaga kirtlandii), a North American songbird. Almost all members of this species occur in the northern part of the state of Michigan in the United States (Fig. \(\PageIndex{1}\)). In contrast, the Spotted Owl (Strix occidentalis) is a species with many distinct populations throughout the western United States, southern Canada, and central Mexico.
.jpg?revision=1&size=bestfit&width=724&height=542)
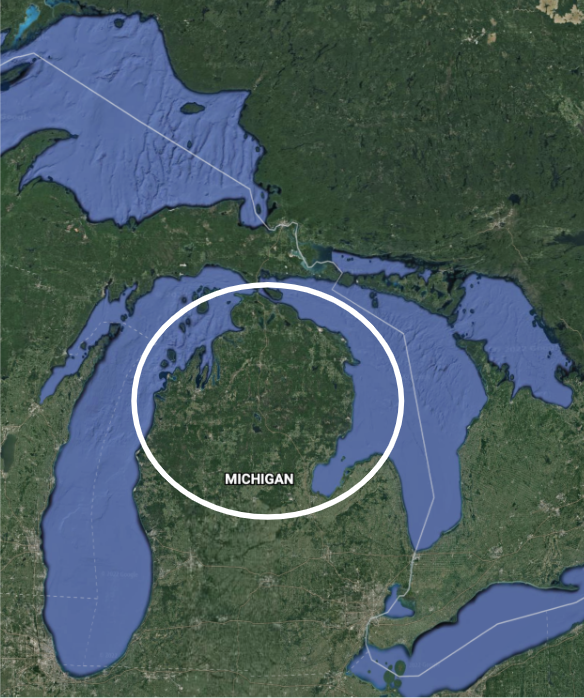
Figure \(\PageIndex{1}\): Left: "A male Kirtland's Warbler Setophaga kirtlandii in a forest in Michigan, USA" by Jeol Trick is licensed under CC BY 2.0. Right: Core habitat area of Kirtland's Warbler. Source: Google Earth: https://bit.ly/3ofgDK1.
For both species and populations, patterns of distribution and abundance can be considered in several ways. These include:
- Size: How many total individuals there are?
- Density: How many individuals per unit of area?
- Dispersion: How are individuals in a population arranged spatially relative to another? Do they occur in clumps or are they evenly spread apart?
- Occupancy: Does a species or member of a population occur in a given habitat, or is it absent?
- Population distribution: Where does a population occur in space?
- Geographic range: What are the furthest geographic limits of where a species occurs?
In addition to static characteristics of size and distribution, populations are dynamic and fluctuate based on a number of factors: seasonal and yearly changes in the environment, natural disasters such as forest fires and volcanic eruptions, and competition for resources between and within species. To study these many facets of a population's biology, ecologists use both systematic field observations to determine its current status, and mathematical tools to characterize how it responds to changes in the biotic and abiotic environments.
Population size is the number of individuals in a population
Population size is the actual number of organisms in a population. This is often of great interest to biologists – especially those working in forestry, wildlife management and conservation – and most of our basic population models work with population sizes. A complete census is one way to determine population size and entails counting each individual present within the population. This occurs in some well-studied populations, such as the Kasekela population of chimpanzees in Gombe National Park, Tanzania (Pusey et al. 2008), and the Seychelles Warbler on islands in the Indian Ocean off the coast of East Africa (Burt et al. 2016).
Although it is the most accurate methodology, counting every individual in a population can be difficult, if not impossible. In most cases ecologists can only attempt to estimate the population size (N) by using well-designed field studies and statistics. Indeed, some population ecologists specialize in developing mathematical and statistical models to accurately estimate population size, such as mark-recapture models and camera-trapping methods (detailed below). Often, however, we do not have good estimates of the size of a population itself, but factors that should be correlated with the population size, such as the number of animals harvested by hunters or trapped by ecologists or the density of dung found during a survey.
Data that we think correlates with actual abundance constitutes a population index. Index data are cheaper to collect than the data needed for formal estimates of population size such as the mark-recapture methods discussed below, but can be biased and provide an inaccurate sense of the status of a population (Stephens et al. 2015). Ideally, an index should be validated by checking its correlation with rigorous estimates of population size. For example, the abundance of large mammals such as lions, elephants and tigers is frequently indexed by the frequency of their tracks or scat. To determine the reliability of an indirect measure of population size, Belant et al. (2019) compared an index based on lion tracks to a formal estimate of population size. Unfortunately, the commonly used index of lion abundance based on their tracks overestimated abundance.
When species become endangered researchers often try to determine - or at least estimate - the number of individuals surviving. For example, with only approximately 4000 individuals, Kirtland’s Warbler is the rarest species breeding in the continental United States and was considered critically endangered throughout most of the 20th century. Researchers therefore worked each spring to determine as best as possible how many male warblers had established territories and were trying to attract mates.
Species that are economically important or are central players in ecosystem functioning are also often monitored intensively. Since the middle of the 20th century the abundance of Wildebeest (Connochaetes taurinus) in the Serengeti ecosystem of East Africa has been intensively monitored by aircraft (Fig. \(\PageIndex{2}\)). The population was considered to be small in the 1960s when it numbered around 250,000, but by the 1990s had grown to over 1 million (Mduma et al. 1999).

Figure \(\PageIndex{2}\) Wildebeest in Maasai Mara. Photo by Bjørn Christian Tørrissen, http://bjornfree.com/galleries.html.
Population density is the relative abundance of an organism
While population size is a total count of individuals, population density is how many individuals occur in a given area of space. It is therefore a measure of relative abundance. For animals and trees, this is often the estimated number of animals per hectare (a hectare is 100 m by 100 m, or 2.47 acres). For plants, insects, and other smaller organisms this is often the number per square meter.
Kirtland's Warbler is a habitat specialist and only nests in forests dominated by a single conifer, the Jack Pine (Pinus banksiana). Moreover, it only nests in Jack Pines of a certain age (5-20 years) and density (>3000 pines per hectare; Donner et al. 2018). When conditions are optimal, there is usually one breeding pair of warblers per 70 hectares, or 1.4 pairs per 100 hectares (Densities are usually reported for standard areas such as 1 square meter, 100 hectares, etc.).
Estimates of population density are often much easier to obtain than estimates of total population size. Population density can be converted to a rough estimate population size through simple multiplication. If there are 1.4 pairs per hectare of good habitat, and there are 2800 hectares of habitat, we can calculate the number of pairs as 1.4*2000 = 2800 pairs. Two things are key to this calculation, however: first, the estimate of density is accurate, and second, the estimate of the amount of good habitat is accurate.
Recently, great progress in estimating animal density has been made using camera traps (Fig. \(\PageIndex{3}\)). These are especially useful for studying rare and nocturnal animals, such as predators. For example, lions (Panthera leo) are considered vulnerable to extinction and are most threatened in West Africa, where they are restricted to a few small national parks. In western-most West Africa lions occur only in Niokolo-Koba National Park in south-eastern Senegal (Henschel et al. 2014). Mamadou Kane used camera traps to estimate the density of lions in Niokolo-Koba (Kane et al. 2015). While the entire park is 9130 km2, Kane sampled an area of approximately 285.4 square kilometers within the highest quality lion habitat of the park. Kane estimated that there are about 3 lions per 100 square kilometers in this high-quality habitat (100 square kilometers is an area 10 km by 10 km). Three lions per 100 km2 equals 0.03 per km2. We can therefore estimate the total abundance in the study area as 0.03*285.4 = 8.6 lions.

Figure \(\PageIndex{3}\): "A camera trap, for taking pictures of game on trails" by Hustvedt is licensed under CC BY-SA 3.0. This model is for hunting. Motion detector on top, lens in the middle, flash on the bottom, with a little LCD for showing how many pictures taken/left on the left.
Occupancy reports the presence or absence of a population
Occupancy is simply whether a given species or member of a population occurs in a habitat patch, fragment, or area. Often it can be very difficult to count the number of individuals or determine their density; instead of asking a question like “How many owls are there in this forest?” it's relatively easier to ask “Are there any owls present in this forest?” It can be very time-consuming to do counts or determine density, which can limit researchers' ability to study multiple sites or locations. Focusing on determining just the presence or absence of a population in a habitat often allows researchers to study a larger area.
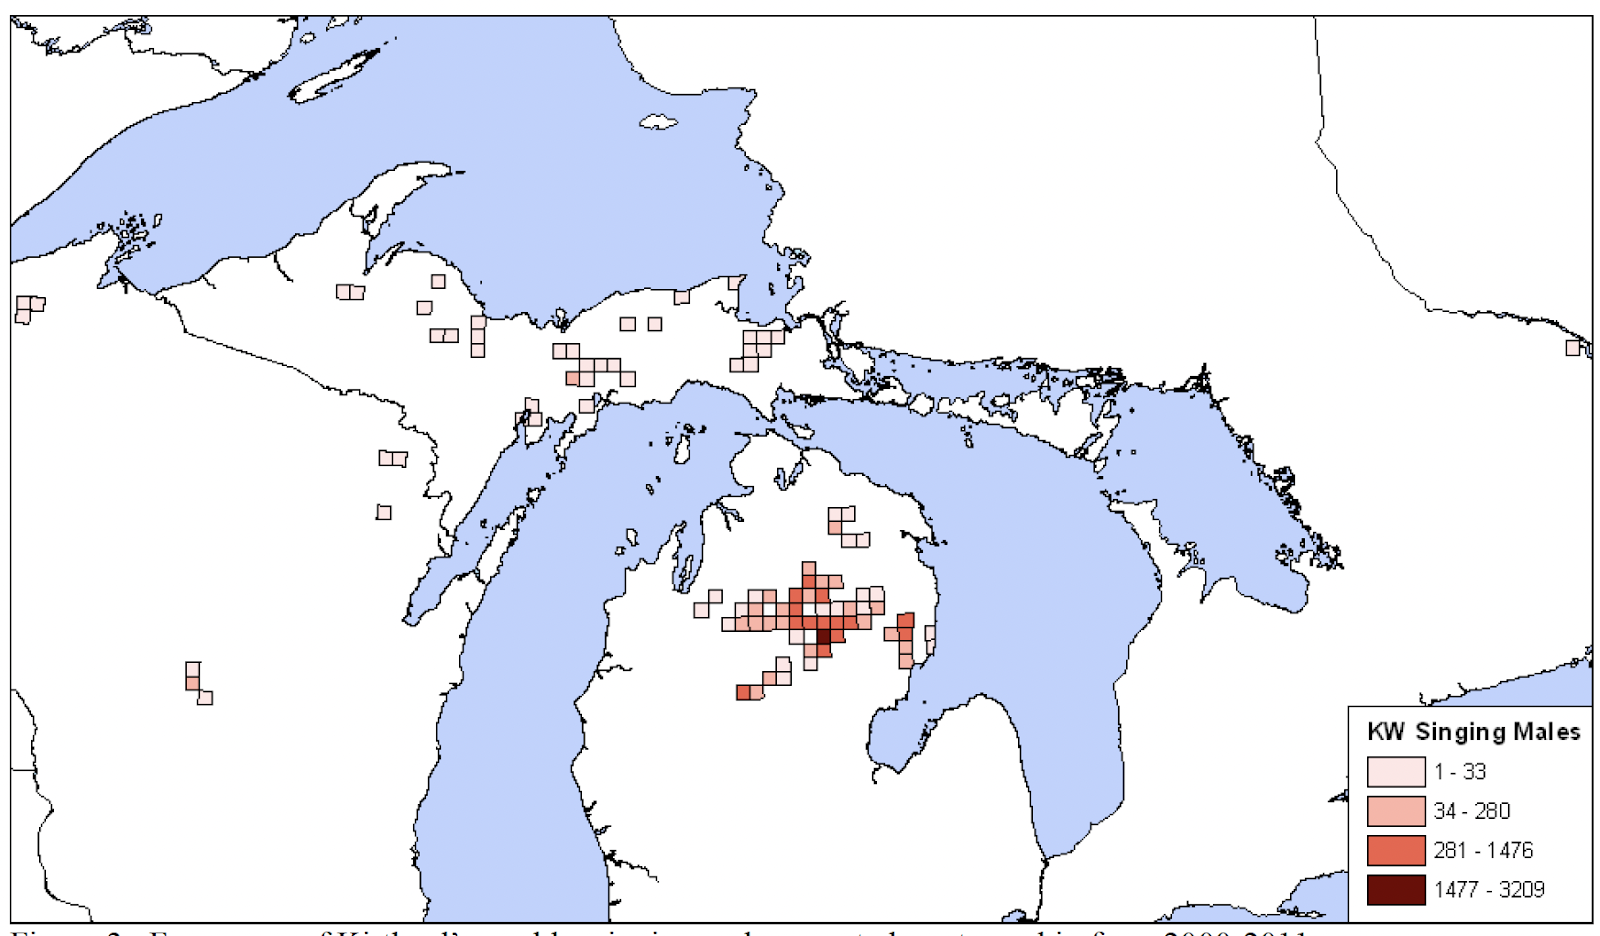
Figure \(\PageIndex{4}\): Frequency of Kirtland’s warbler singing males counted per township from 2000-2011. Source: U.S. Fish and Wildlife Service.
Kirtland’s Warbler is currently increasing its population size and is being found in stands of Jack Pine outside of the state of Michigan (Figure \(\PageIndex{4}\)). Since the warbler’s population is increasing, researchers are more interested in doing occupancy surveys to determine which patches of forest warblers are occurring in rather than determining exactly how many warblers are in these forests (Richards 2008).
Camera traps and occupancy studies can be used to determine if a species has become locally extinct. Giodano, Tumenta and Iongh (2017) carried out a camera-trap based occupancy study of Waza National Park in Cameroon. While they confirmed the occupancy of lions in the park, no leopards (Panthera pardus) were photographed. Since lions and leopards are typically similarly difficult to detect and lions were detected, they concluded that there were no longer any leopards occupying the park.
Individuals within a population can have characteristics patterns of dispersion
In addition to measuring simple density, further information about a population can be obtained by looking at the distribution of the individuals. Species dispersion patterns (or distribution patterns) summarize the spatial relationship between members of a population within a habitat at a particular point in time. In other words, they show whether members of the population live close together or far apart, and what patterns are evident when they are spaced apart.
Individuals in a population can be more or less equally spaced apart, dispersed randomly with no predictable pattern, or clustered in groups. These are known as uniform, random, and clumped dispersion patterns, respectively (Fig. \(\PageIndex{5}\)). Uniform dispersion can occur in plants and is thought to result from competition for below-ground resources such as water, or secretion of substances inhibiting the growth of nearby individuals, a phenomenon called allelopathy. In animals like penguins that nest in large colonies, uniform dispersion can occur due to territorial behavior. An example of random dispersion occurs with dandelion and other plants that have wind-dispersed seeds that germinate wherever they happen to fall in a favorable environment. A clumped dispersion may be seen in plants that drop their seeds straight to the ground, such as oak trees, or animals that live in groups (schools of fish or herds of elephants). Clumped dispersions may also be a function of habitat heterogeneity. Thus, the dispersion pattern of the individuals within a population provides more information about how they interact with each other than does a simple density measurement. Just as lower density species might have more difficulty finding a mate, solitary species with a random distribution might have a similar difficulty when compared to social species clumped together in groups.
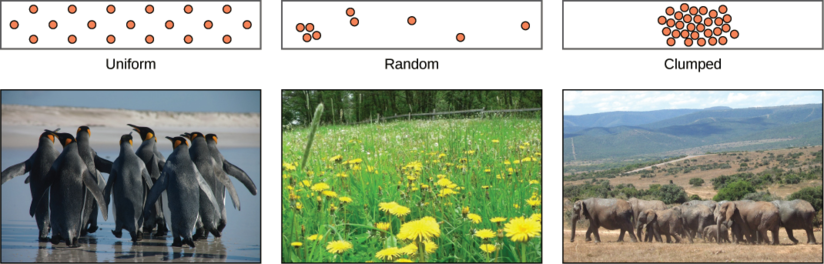
Figure \(\PageIndex{5}\): Species may have uniform, random, or clumped distribution. Territorial birds such as penguins tend to have uniform distribution. Plants such as dandelions with wind-dispersed seeds tend to be randomly distributed. Animals such as elephants that travel in groups exhibit clumped distribution. (credit a: modification of work by Ben Tubby; credit b: modification of work by Rosendahl; credit c: modification of work by Rebecca Wood)
Populations distributions are limited to suitable habitats
In ecology, a niche is the match of a species to a specific environmental condition. It describes how an organism or population responds to the distribution of environmental resources (abiotic components of the environment) and predators, pathogens, and competitors (biotic components of the environment). Habitat refers to the array of resources, physical and biotic factors that are present in an area, such as to support the survival and reproduction of a particular species. The geographic range of a species can be viewed as a spatial reflection of its niche, along with characteristics of the geographic template and the species that influence its potential to colonize. The fundamental geographic range of a species is the area it occupies in which environmental conditions are favorable, without restriction from barriers to disperse or colonize (Lomolino et al 2009). A species will be confined to its realized geographic range when confronting biotic interactions or abiotic barriers that limit dispersal, a more narrow subset of its larger fundamental geographic range.
An early study on ecological niches conducted by Joseph H. Connell analyzed the environmental factors that limit the range of a barnacle (Chthamalus stellatus) on Scotland's Isle of Cumbrae (Connell 1961) (Figure \(\PageIndex{7}\):. In his experiments, Connell described the dominant features of C. stellatus niches and provided explanation for their distribution on intertidal zone of the rocky coast of the Isle. Connell described the upper portion of C. stellatus's range as limited by the barnacle's ability to resist dehydration during periods of low tide. The lower portion of the range was limited by interspecific interactions, namely competition with a cohabiting barnacle species and predation by a snail (Connell 1961). By removing the competing B. balanoides, Connell showed that C. stellatus was able to extend the lower edge of its realized niche in the absence of competition. These experiments demonstrate how biotic and abiotic factors limit the distribution of an organism.
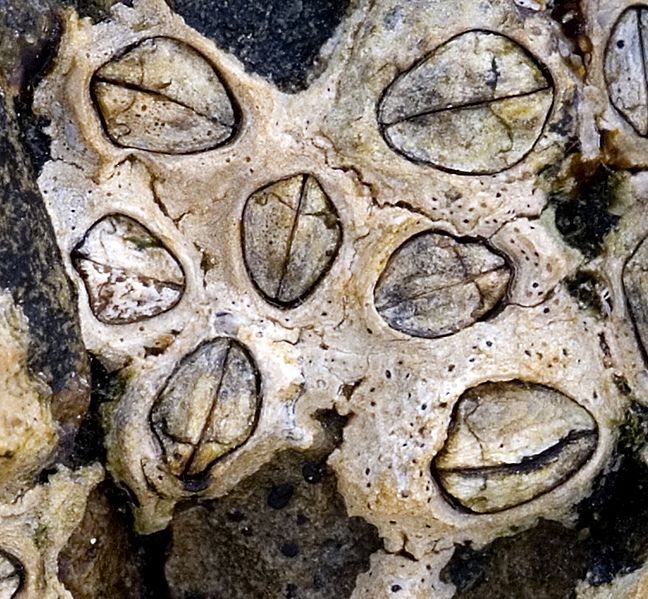
Figure \(\PageIndex{7}\): Chthamalus stellatus, photographed near the upper shoreline, Lundy Island, UK. Max shell length about 10mm. Photo taken by MichaelMaggs and is published with a CC-BY-SA 3.0 license.
The area occupied by a species can be considered at different scales
Population distribution is the geographic area where a particular population of a species occurs. This area of occupancy is determined by the local availability of appropriate habitat. Some species are habitat generalists (species that can thrive in a wide variety of environmental conditions; see Chapter 13) and their populations spread out almost continuously across a landscape. American Robins, for example, can breed in parks, urbanized areas, farms, and the edges of forest. Other species are habitat specialists and only occur in specific places where a certain type of ecosystem occurs. Aquatic species also often occur in isolated populations because their habitat is necessarily bounded by the extent of the lake, wetland, or waterway they occur in.
The Northern Spotted Owl is a subspecies of spotted owl that is a habitat specialist that only occurs in old-growth forests in the Pacific Northwest of North America (British Columbia, Washington, Oregon, California). While much of the Pacific Northwest is still forested, most forests are less than 100 years old and don’t have the large, old trees that the owls nest in. The extent of each population of owls is therefore limited by the size of each patch of old growth forest.
A species' geographic range is the total geographic area occupied by a species. Bald Eagles can be found breeding in almost every state of the USA and most provinces of Canada. Its geographic range therefore encompasses almost all of North America north of Mexico. In contrast, Golden Eagles breed almost exclusively in western Canada, the western United States, and Mexico. The Golden Eagle's range therefore is restricted to the western part of the continent and Mexico.
As noted above, Kirtland’s warblers are habitat specialists, which means that the species only reside in the Jack Pine Forests of northern Michigan and a few adjacent states and Canadian provinces. Subsequently, this phenomenon is referred to by biologists as a restricted range. A restricted range species refers to a species in which the range is so small, there is basically a single population. This results in the population distribution and geographic range is essentially the same.
A term that can sometimes be confused with geographic range is home range. Geographic range refers to the entire spatial area a species can be found in, while a home range refers to an area utilized and perhaps defended by a single organism.
A species' current geographic range is often very different from its historical range. Factors such as habitat loss, hunting, and climate change can all reduce the distribution of populations and the species' overall geographic range. For example, lions previously ranged broadly over Africa, Western Asia, the Middle East and India (Fig. \(\PageIndex{7}\))
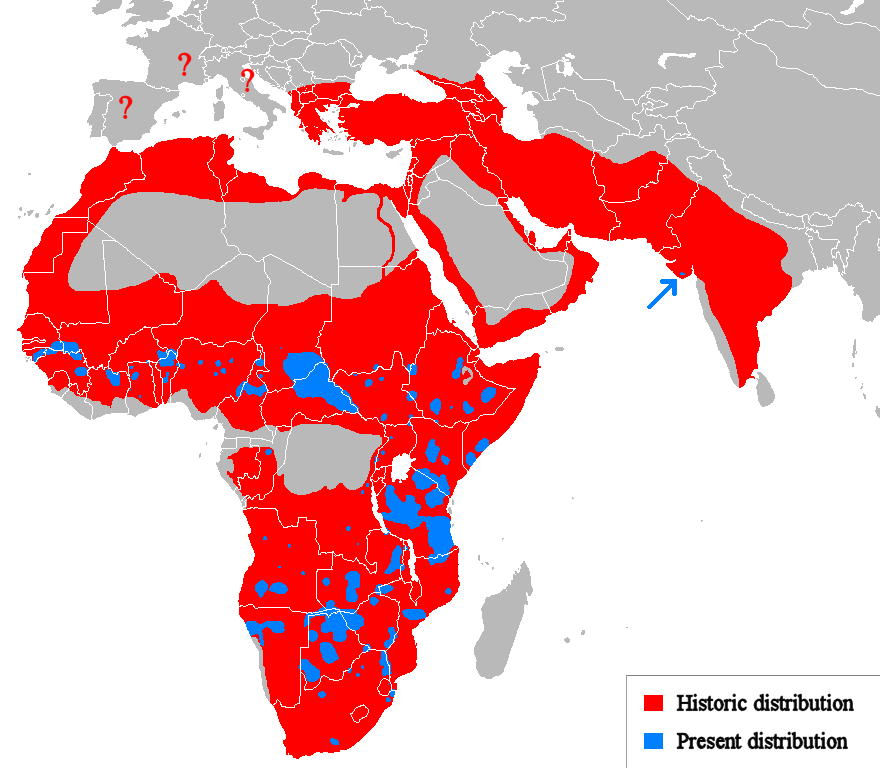
Figure \(\PageIndex{7}\): Historical (red) and present (blue) distribution of lions (Panthera leo). Source: Tommyknocker (Wikipedia), based on a map created by 'The African Lion Environmental Research Trust (ALERT).
Contributors and Attributions
This chapter was written by N. Brouwer with text taken from the following CC-BY resources:
- Ecological niche by Wikipedia, the free encyclopedia
- OpenStax Biology 2e section 45.1 Population Demography