
9.3: Food Chains and Food Webs
- Page ID
- 111101
Trophic Interactions
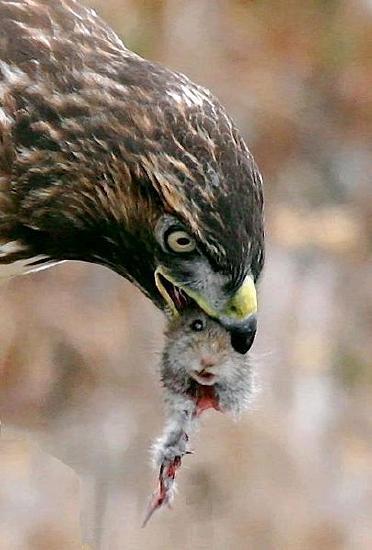
Trophic interactions occur when one organism feeds on another. Trophic interreactions strongly influence the structure of communities as the populations of one species (a predator) can influence population sizes of other species (prey). The three main types of trophic interactions that influence community structure are predation (Figure \(\PageIndex{1}\)) and herbivory. During these interactions, one species benefits by gaining food at the expense of the other, which either dies or loses nutrients, tissues, or organs (such as leaves). Trophic interactions involve the flow of energy, and the trophic interactions in a community can be represented by food chains and food webs.
A species’ trophic level is their position in the food chain or web. At the bottom of the food web are autotrophs, also known as producers. The next level is herbivores (primary consumers), these species feed on producers for their energy source. Herbivores are consumed by omnivores or carnivores. These species are secondary and tertiary consumers. Additional levels to the trophic scale come when smaller omnivores or carnivores are eaten by larger ones. At the top of the food web is the apex predator, this animal species is not consumed by any other in the community.
Food Chains
A food chain is a linear sequence of organisms through which nutrients and energy pass as one organism eats another; the levels in the food chain are producers, primary consumers, higher-level consumers, and finally decomposers. These levels are used to describe ecosystem structure and dynamics. There is a single path through a food chain. Each organism in a food chain occupies a specific trophic level (energy level), its position in the food chain or food web.
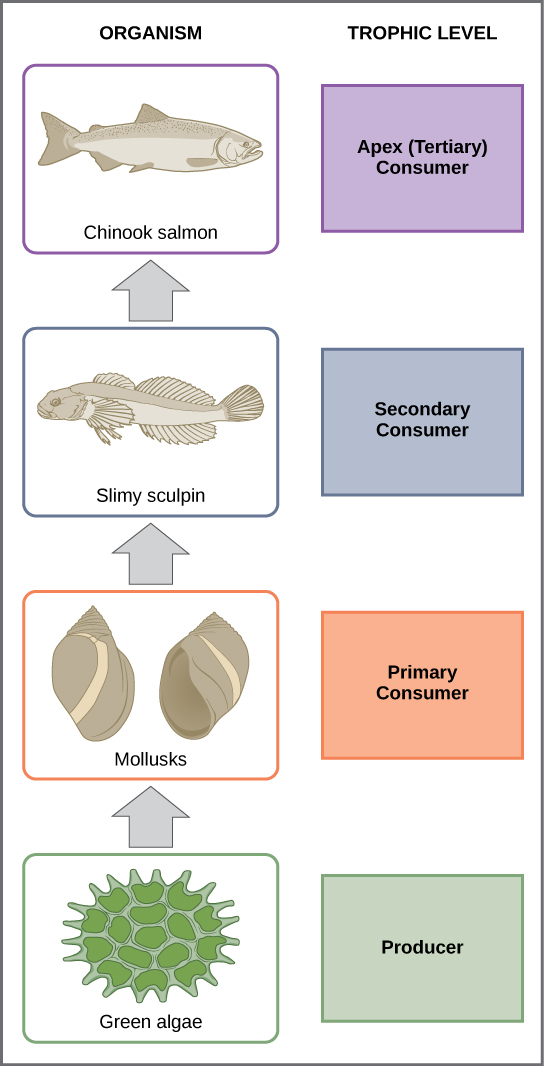
In many ecosystems, the base, or foundation, of the food chain consists of photosynthetic organisms (plants or phytoplankton), which are called producers. The organisms that consume the producers are herbivores: the primary consumers. Secondary consumers are usually carnivores that eat the primary consumers. Tertiary consumers are carnivores that eat other carnivores. Higher-level consumers feed on the next lower trophic levels, and so on, up to the organisms at the top of the food chain: the apex consumers. In the Lake Ontario food chain, shown in Figure \(\PageIndex{2}\), the Chinook salmon is the apex consumer at the top of this food chain.
Trophic Level Transfer Efficiency
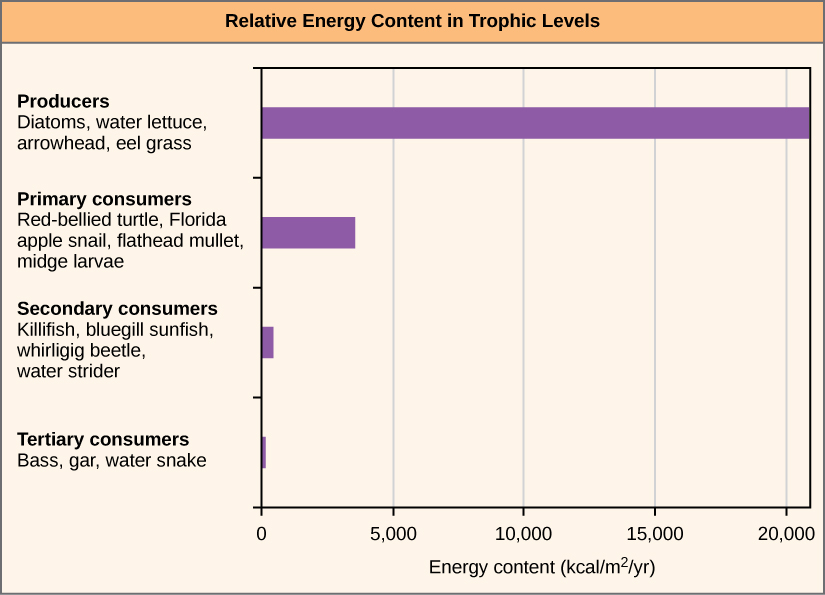
One major factor that limits the number of steps in a food chain is energy. Energy is lost at each trophic level and between trophic levels as heat and in the transfer to decomposers (Figure \(\PageIndex{3}\)). Only a fraction of the energy captured by one trophic level is assimilated into biomass, which makes it available to the next trophic level. Assimilation is the biomass of the present trophic level after accounting for the energy lost due to incomplete ingestion of food, energy used to conduct work by that trophic level, and energy lost as waste. Incomplete ingestion refers to the fact that some consumers eat only a part of their food. For example, when a lion kills an antelope, it will eat everything except the hide and bones. The lion is missing the energy-rich bone marrow inside the bone, so the lion does not make use of all the calories its prey could provide.
The trophic level transfer efficiency is the percentage of biomass or energy at one trophic level that is transferred to the next. On average trophic level transfer efficiency is only about 10%. Thus, after a limited number of trophic energy transfers, the amount of energy remaining in the food chain may not be great enough to support viable populations at yet a higher trophic level. As a result most communities are limited to 4 or 5 trophic levels.
Food Webs
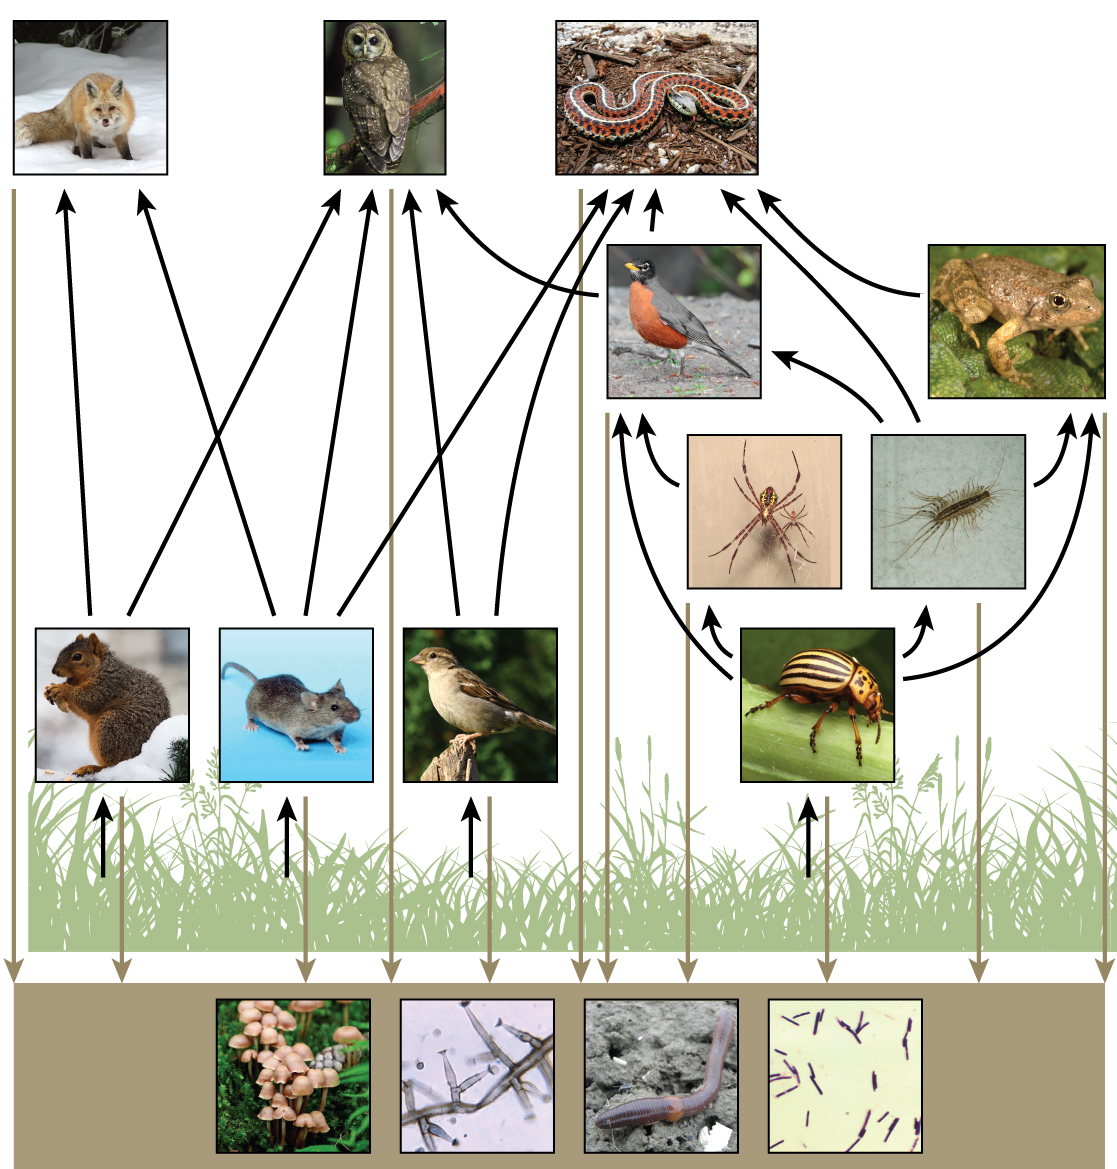
There is a one problem when using food chains to describe most ecosystems. Even when all organisms are grouped into appropriate trophic levels, some of these organisms can feed on more than one trophic level; likewise, some of these organisms can also be fed on from multiple trophic levels. In addition, species feed on and are eaten by more than one species. In other words, the linear model of ecosystems, the food chain, is a hypothetical, overly simplistic representation of ecosystem structure. A holistic model—which includes all the interactions between different species and their complex interconnected relationships with each other and with the environment—is a more accurate and descriptive model for ecosystems. A food web is a concept that accounts for the multiple trophic (feeding) interactions between each species and the many species it may feed on, or that feed on it. In a food web, the several trophic connections between each species and the other species that interact with it may cross multiple trophic levels. The matter and energy movements of virtually all ecosystems are more accurately described by food webs (Figure \(\PageIndex{4}\)).
A comparison of the two types of structural ecosystem models shows strength in both. Food chains are more flexible for analytical modeling, are easier to follow, and are easier to experiment with, whereas food web models more accurately represent ecosystem structure and dynamics, and data can be directly used as input for simulation modeling.
Two general types of food webs are often shown interacting within a single ecosystem. A grazing food web has plants or other photosynthetic organisms at its base, followed by herbivores and various carnivores. A detrital food web consists of a base of organisms that feed on decaying organic matter (dead organisms), including decomposers (which break down dead and decaying organisms) and detritivores (which consume organic detritus). These organisms are usually bacteria, fungi, and invertebrate animals that recycle organic material back into the biotic part of the ecosystem as they themselves are consumed by other organisms. As ecosystems require a method to recycle material from dead organisms, grazing food webs have an associated detrital food web. For example, in a meadow ecosystem, plants may support a grazing food web of different organisms, primary and other levels of consumers, while at the same time supporting a detrital food web of bacteria and fungi feeding off dead plants and animals. Simultaneously, a detrital food web can contribute energy to a grazing food web, as when a robin eats an earthworm.
Top Down vs Bottom Up Control
Changes to one of the levels in the food chain can result in changes in other levels which scientists call a trophic cascade. These cascades can affect levels below that altered level or levels above the altered level. We categorize these directional cascades as top-down or bottom-up control, which simply means the changes to the food chain occurred at either the top trophic level or the bottom trophic level and then impacted the other levels up or down the food chain.
In the top-down control, the populations of the organisms lower trophic levels (bottom of the pyramid) are controlled by the organisms at the top. This approach is also called the predator-controlled food web of an ecosystem.
For instance, imagine a simplified ecosystem where there are just 3 tropic levels: plants, an herbivore, and a carnivores. The presence of the carnivore keeps the herbivore population in check. If there were no carnivores in this ecosystem, then the herbivore population would rapidly increase. As a result, all the plants would be eaten. When almost all the plants are eaten by the huge, unsustainable population of herbivores, there is no food. So, that population of herbivores would eventually starve to death and the ecosystem would collapse. Thus, the carnivores keep the herbivore population in check, so that the plants are not overeaten and the ecosystem will continue to function.
The bottom-up control is driven by the presence or absence of the producers in the ecosystem. Changes in their population will affect the population of all the species in the food web, and thus, the ecosystem. This approach is also called the resource-controlled (or food-limited) food web of an ecosystem.
In the same simplified example ecosystem above, let us consider the reverse scenario. What if the population of plants in the ecosystem dwindled to extremely low numbers? Then, the herbivores would have less food to feed on. Consequently, their population would shrink to reflect the lack of food. When the population of herbivores decreases, the carnivores will also automatically face a shortage of food. The carnivore population would also decline. If plants disappeared altogether, then the ecosystem would collapse.
Does an ecosystem have to choose to be either top-down or bottom-up?
No. In most ecosystems, studies have shown that these two approaches are not mutually exclusive. For example, in marine ecosystems that were initially thought to be purely bottom-up, there have been periods of top-down control due to extraction of large predators through fishing.
Consequences of Food Webs: Biological Magnification
Biomagnification is the increasing concentration of persistent, toxic substances in organisms at each successive trophic level. These are substances that are fat soluble, not water soluble, and are stored in the fat reserves of each organism.
One of the most important consequences of ecosystem dynamics in terms of human impact is biomagnification. Many substances have been shown to biomagnify, including classical studies with the pesticide dichlorodiphenyltrichloroethane (DDT), which were described in the 1960s bestseller, Silent Spring by Rachel Carson. DDT was a commonly used pesticide before its dangers to apex consumers, such as the bald eagle, became known. In aquatic ecosystems, organisms from each trophic level consumed many organisms in the lower level, which caused DDT to increase in birds (apex consumers) that ate fish. Thus, the birds accumulated sufficient amounts of DDT to cause fragility in their eggshells. This effect increased egg breakage during nesting and was shown to have devastating effects on these bird populations. The use of DDT was banned in the United States in the 1970s.
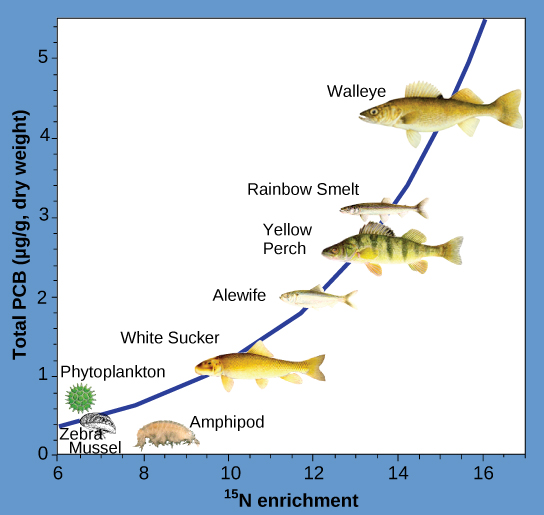
Other substances that biomagnify are polychlorinated biphenyls (PCB), which were used as coolant liquids in the United States until their use was banned in 1979, and heavy metals, such as mercury, lead, and cadmium. These substances are best studied in aquatic ecosystems, where predatory fish species accumulate very high concentrations of toxic substances that are at quite low concentrations in the environment and in producers. As illustrated in a study performed by the NOAA in the Saginaw Bay of Lake Huron of the North American Great Lakes (Figure \(\PageIndex{7}\)), PCB concentrations increased from the producers of the ecosystem (phytoplankton) through the different trophic levels of fish species. The apex consumer, the walleye, has more than four times the amount of PCBs compared to phytoplankton. Also, based on results from other studies, birds that eat these fish may have PCB levels at least one order of magnitude higher than those found in the lake fish.
Other concerns have been raised by the biomagnification of heavy metals, such as mercury and cadmium, in certain types of seafood. The United States Environmental Protection Agency recommends that pregnant women and young children should not consume any swordfish, shark, king mackerel, or tilefish because of their high mercury content. These individuals are advised to eat fish low in mercury: salmon, shrimp, pollock, and catfish. Biomagnification is a good example of how ecosystem dynamics can affect our everyday lives, even influencing the food we eat.
Attributions
This page is a modified derivative of:
- 20.1: Energy Flow through Ecosystems via OpenStax; license CC BY 4.0.