1.32: DNA Fingerprinting
- Page ID
- 79456
\( \newcommand{\vecs}[1]{\overset { \scriptstyle \rightharpoonup} {\mathbf{#1}} } \)
\( \newcommand{\vecd}[1]{\overset{-\!-\!\rightharpoonup}{\vphantom{a}\smash {#1}}} \)
\( \newcommand{\dsum}{\displaystyle\sum\limits} \)
\( \newcommand{\dint}{\displaystyle\int\limits} \)
\( \newcommand{\dlim}{\displaystyle\lim\limits} \)
\( \newcommand{\id}{\mathrm{id}}\) \( \newcommand{\Span}{\mathrm{span}}\)
( \newcommand{\kernel}{\mathrm{null}\,}\) \( \newcommand{\range}{\mathrm{range}\,}\)
\( \newcommand{\RealPart}{\mathrm{Re}}\) \( \newcommand{\ImaginaryPart}{\mathrm{Im}}\)
\( \newcommand{\Argument}{\mathrm{Arg}}\) \( \newcommand{\norm}[1]{\| #1 \|}\)
\( \newcommand{\inner}[2]{\langle #1, #2 \rangle}\)
\( \newcommand{\Span}{\mathrm{span}}\)
\( \newcommand{\id}{\mathrm{id}}\)
\( \newcommand{\Span}{\mathrm{span}}\)
\( \newcommand{\kernel}{\mathrm{null}\,}\)
\( \newcommand{\range}{\mathrm{range}\,}\)
\( \newcommand{\RealPart}{\mathrm{Re}}\)
\( \newcommand{\ImaginaryPart}{\mathrm{Im}}\)
\( \newcommand{\Argument}{\mathrm{Arg}}\)
\( \newcommand{\norm}[1]{\| #1 \|}\)
\( \newcommand{\inner}[2]{\langle #1, #2 \rangle}\)
\( \newcommand{\Span}{\mathrm{span}}\) \( \newcommand{\AA}{\unicode[.8,0]{x212B}}\)
\( \newcommand{\vectorA}[1]{\vec{#1}} % arrow\)
\( \newcommand{\vectorAt}[1]{\vec{\text{#1}}} % arrow\)
\( \newcommand{\vectorB}[1]{\overset { \scriptstyle \rightharpoonup} {\mathbf{#1}} } \)
\( \newcommand{\vectorC}[1]{\textbf{#1}} \)
\( \newcommand{\vectorD}[1]{\overrightarrow{#1}} \)
\( \newcommand{\vectorDt}[1]{\overrightarrow{\text{#1}}} \)
\( \newcommand{\vectE}[1]{\overset{-\!-\!\rightharpoonup}{\vphantom{a}\smash{\mathbf {#1}}}} \)
\( \newcommand{\vecs}[1]{\overset { \scriptstyle \rightharpoonup} {\mathbf{#1}} } \)
\(\newcommand{\longvect}{\overrightarrow}\)
\( \newcommand{\vecd}[1]{\overset{-\!-\!\rightharpoonup}{\vphantom{a}\smash {#1}}} \)
\(\newcommand{\avec}{\mathbf a}\) \(\newcommand{\bvec}{\mathbf b}\) \(\newcommand{\cvec}{\mathbf c}\) \(\newcommand{\dvec}{\mathbf d}\) \(\newcommand{\dtil}{\widetilde{\mathbf d}}\) \(\newcommand{\evec}{\mathbf e}\) \(\newcommand{\fvec}{\mathbf f}\) \(\newcommand{\nvec}{\mathbf n}\) \(\newcommand{\pvec}{\mathbf p}\) \(\newcommand{\qvec}{\mathbf q}\) \(\newcommand{\svec}{\mathbf s}\) \(\newcommand{\tvec}{\mathbf t}\) \(\newcommand{\uvec}{\mathbf u}\) \(\newcommand{\vvec}{\mathbf v}\) \(\newcommand{\wvec}{\mathbf w}\) \(\newcommand{\xvec}{\mathbf x}\) \(\newcommand{\yvec}{\mathbf y}\) \(\newcommand{\zvec}{\mathbf z}\) \(\newcommand{\rvec}{\mathbf r}\) \(\newcommand{\mvec}{\mathbf m}\) \(\newcommand{\zerovec}{\mathbf 0}\) \(\newcommand{\onevec}{\mathbf 1}\) \(\newcommand{\real}{\mathbb R}\) \(\newcommand{\twovec}[2]{\left[\begin{array}{r}#1 \\ #2 \end{array}\right]}\) \(\newcommand{\ctwovec}[2]{\left[\begin{array}{c}#1 \\ #2 \end{array}\right]}\) \(\newcommand{\threevec}[3]{\left[\begin{array}{r}#1 \\ #2 \\ #3 \end{array}\right]}\) \(\newcommand{\cthreevec}[3]{\left[\begin{array}{c}#1 \\ #2 \\ #3 \end{array}\right]}\) \(\newcommand{\fourvec}[4]{\left[\begin{array}{r}#1 \\ #2 \\ #3 \\ #4 \end{array}\right]}\) \(\newcommand{\cfourvec}[4]{\left[\begin{array}{c}#1 \\ #2 \\ #3 \\ #4 \end{array}\right]}\) \(\newcommand{\fivevec}[5]{\left[\begin{array}{r}#1 \\ #2 \\ #3 \\ #4 \\ #5 \\ \end{array}\right]}\) \(\newcommand{\cfivevec}[5]{\left[\begin{array}{c}#1 \\ #2 \\ #3 \\ #4 \\ #5 \\ \end{array}\right]}\) \(\newcommand{\mattwo}[4]{\left[\begin{array}{rr}#1 \amp #2 \\ #3 \amp #4 \\ \end{array}\right]}\) \(\newcommand{\laspan}[1]{\text{Span}\{#1\}}\) \(\newcommand{\bcal}{\cal B}\) \(\newcommand{\ccal}{\cal C}\) \(\newcommand{\scal}{\cal S}\) \(\newcommand{\wcal}{\cal W}\) \(\newcommand{\ecal}{\cal E}\) \(\newcommand{\coords}[2]{\left\{#1\right\}_{#2}}\) \(\newcommand{\gray}[1]{\color{gray}{#1}}\) \(\newcommand{\lgray}[1]{\color{lightgray}{#1}}\) \(\newcommand{\rank}{\operatorname{rank}}\) \(\newcommand{\row}{\text{Row}}\) \(\newcommand{\col}{\text{Col}}\) \(\renewcommand{\row}{\text{Row}}\) \(\newcommand{\nul}{\text{Nul}}\) \(\newcommand{\var}{\text{Var}}\) \(\newcommand{\corr}{\text{corr}}\) \(\newcommand{\len}[1]{\left|#1\right|}\) \(\newcommand{\bbar}{\overline{\bvec}}\) \(\newcommand{\bhat}{\widehat{\bvec}}\) \(\newcommand{\bperp}{\bvec^\perp}\) \(\newcommand{\xhat}{\widehat{\xvec}}\) \(\newcommand{\vhat}{\widehat{\vvec}}\) \(\newcommand{\uhat}{\widehat{\uvec}}\) \(\newcommand{\what}{\widehat{\wvec}}\) \(\newcommand{\Sighat}{\widehat{\Sigma}}\) \(\newcommand{\lt}{<}\) \(\newcommand{\gt}{>}\) \(\newcommand{\amp}{&}\) \(\definecolor{fillinmathshade}{gray}{0.9}\)- Give at least three applications for DNA fingerprinting.
- Explain/apply how restriction enzymes work, including be able to identify recognition sites/sequences and predict DNA fragment sizes from examples.
- Define and use the following terms: restriction enzyme, recognition site/sequence, sticky ends, blunt ends, restriction fragment length polymorphism (RFLP), gel electrophoresis.
- Explain/apply how gel electrophoresis works.
- Successfully load and run an electrophoresis gel.
- Analyze and interpret results from an electrophoresis gel.
- Analyze a viral outbreak scenario and determine the best course of action.
Applications of DNA Fingerprinting
DNA fingerprinting is a way to identify using DNA. Some applications of DNA fingerprinting include:
- identifying a microbe causing an infection (diagnostic test)
- identifying microbes for scientific research
- paternity testing
- forensic DNA analysis to match DNA to criminal suspects
- a wide variety of genetic research
DNA fingerprinting involves multiple biotechnologies, including PCR (see the chapter on PCR), but here this laboratory focuses on creating DNA fingerprints using restriction enzymes and visualizing the DNA fingerprints using gel electrophoresis.
Creating a DNA Fingerprint
Restriction Enzymes
DNA fingerprints are created by first isolating DNA from an unknown sample to be identified and compared with known samples. If the samples match, it enables identification. The isolated DNA (i.e. DNA that has been removed from cells and other cell components) is mixed with a restriction enzyme to create a fingerprint. The restriction enzyme will cut the DNA in a pattern that will differ from DNA from other sources, unless the identify of the DNA is the same (matching known and unknown samples enables identification).
The DNA fragments produced by the restriction enzyme are separated by size using an approach called gel electrophoresis (see the Gel Electrophoresis section below). The result is a pattern of bands that can be compared with other patterns from known samples. If fingerprints match, it likely means that the DNA originated from the same organism. For paternity testing, half of the fingerprint will originate from the biological mother and half of the fingerprint will originate from the biological father.
Restriction enzymes are found in some bacteria and have been isolated to use for a variety of biotechnologies such as DNA fingerprinting. These enzymes cut DNA at a characteristic recognition site. Recognition sites are different for each restriction enzyme. Typically, recognition sites are palindromic, that is they read the same backwards and forwards. Ordinary words that are palindromic include "mom," "dad," "wow," and "racecar." With DNA, a palindrome is based on reading one DNA strand 5' to 3' and comparing it with its complement DNA strand as read 5' to 3'. For example:
5'-GAATTC-3'
3'-CTTAAG-5'
Notice that the complementary DNA strands above, if reading from the 5' end, have the same sequence: 5'-GAATTC-3'. This example is a recognition sequence from the restriction enzyme known as EcoRI. The "Eco" part of the enzyme name comes from the fact that this enzyme originates from Escherichia coli (E. coli). The rest of the restriction enzyme name comes from the strain of the organism (in this case the R strain) and the order in which the enzyme was discovered (in this case it is the first restriction enzyme discovered from the R strain of E. coli - I is the Roman numeral for 1).
In the example of EcoRI, this enzyme cuts the DNA between the "G" and the "A" on the 5' side. As a result, both the top and bottom DNA strands are cut and only held together by the few hydrogen bonds between the 5'-AATT-3' on both strands. Because of this (and that hydrogen bonds are rather weak attractions), the two DNA strands fully separate leaving the 5'-AATT-3' overhangs on both broken strands. These overhangs are called sticky ends.
Restriction enzymes will identify every location on a DNA molecule with the recognition sequence and cut the DNA there. This means the a restriction enzyme will likely make multiple cuts in the DNA. This will produce DNA fragments of different numbers of fragments with different sizes based on the base sequence of the DNA. The fragment sizes and number of fragments produces the DNA fingerprint used for identification purposes in DNA fingerprinting.
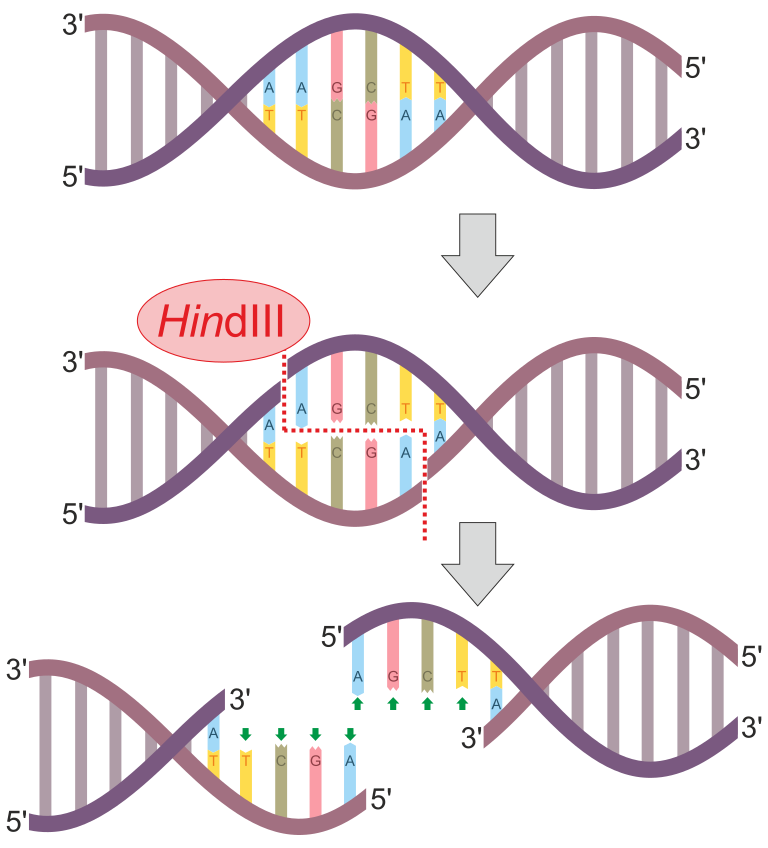
Figure 1: HindIII is an example of a restriction enzyme. This enzyme has the recognition sequence of 5'-AAGCTT-3'. Notice that this sequence is also a palindrome since its complementary strand will also have the 5'-AAGCTT-3' sequence (just antiparallel). This enzyme scans the entire DNA molecule for this specific sequence. When this sequence is found, it will cut between the "A" and "A" bases. This happens on both DNA strands to produce sticky ends (overhangs). In this case, the overhangs have the sequence 5'-AGCT-3'.
DNA Fingerprinting is also called Restriction Fragment Length Polymorphisms (RFLPs) Analysis
Restriction enzyme recognition sites are short (only a few nucleotides long), sequence-specific palindromes, and may be found throughout the genome. Thus, differences in DNA sequences in the genomes of individuals will lead to differences in distribution of restriction enzyme recognition sites that can be visualized as distinct fingerprints using a technique called gel electrophoresis (see the seciton on Gel Electrophoresis below). Restriction fragment length polymorphism (RFLP) analysis compares DNA banding patterns of different DNA samples after restriction digestion.
RFLP analysis has many practical applications in both medicine and forensic science. For example, epidemiologists use RFLP analysis to track and identify the source of specific microorganisms implicated in outbreaks of food poisoning or certain infectious diseases. RFLP analysis can also be used on human DNA to determine inheritance patterns of chromosomes with variant genes, including those associated with heritable diseases or to establish paternity.
Forensic scientists use RFLP analysis as a form of DNA fingerprinting, which is useful for analyzing DNA obtained from crime scenes, suspects, and victims. DNA samples are collected, the numbers of copies of the sample DNA molecules are increased using PCR, and then subjected to restriction enzyme digestion and agarose gel electrophoresis to generate specific banding patterns. By comparing the banding patterns of samples collected from the crime scene against those collected from suspects or victims, investigators can definitively determine whether DNA evidence collected at the scene was left behind by suspects or victims.
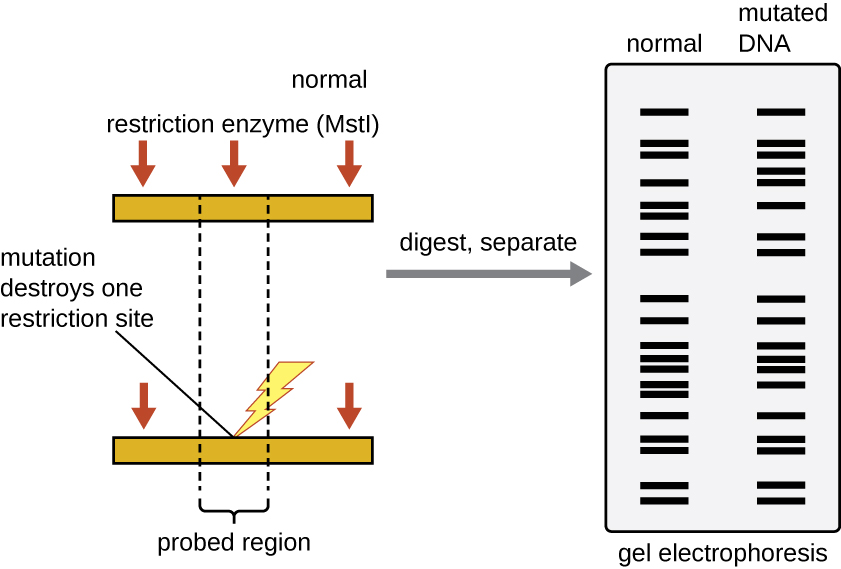
Figure 2: RFLP analysis can be used to differentiate DNA sequences. In this example, a normal chromosome is digested into two fragments, whereas digestion of a mutated chromosome produces only one fragment. The small red arrows pointing to the two different chromosome segments show the locations of the restriction enzyme recognition sites. After digestion and agarose gel electrophoresis, the banding patterns reflect the change by showing the loss of two shorter bands and the gain of a longer band. Each band produced by gel electrophoresis is a DNA fragment of different size. (credit: modification of work by National Center for Biotechnology Information)
Gel Electrophoresis
Gel electrophoresis is a technique commonly used to separate biological molecules based on size and biochemical characteristics, such as charge and polarity. Agarose gel electrophoresis is widely used to separate DNA (or RNA) of varying sizes that may be generated by restriction enzyme digestion (such as DNA fingerprinting / RFLP analysis) or by other means, such as the PCR.
DNA molecules have an overall negative charge. This is due to negative charges on the phosphate groups of its nucleotides. As a result, DNA can be pulled toward a positive charge. This is how gel electrophoresis pulls DNA through an agarose gel.
Due to its negatively charged backbone, DNA is strongly attracted to a positive electrode. In agarose gel electrophoresis, the gel is oriented horizontally in a buffer solution. Samples are loaded into sample wells on the side of the gel closest to the negative electrode, then drawn through the molecular sieve of the agarose matrix toward the positive electrode. The agarose matrix impedes the movement of larger molecules through the gel, whereas smaller molecules pass through more readily. Thus, the distance of migration is inversely correlated to the size of the DNA fragment, with smaller fragments traveling a longer distance through the gel. Sizes of DNA fragments within a sample can be estimated by comparison to fragments of known size in a DNA ladder also run on the same gel.
Small DNA fragments travel farther through the electrophoresis gel than larger DNA fragments.
You can think about this as being analagous to rocks in a river. Large boulders do not move very far, even if the current is swift, but small pebbles are capable of moving great distances in river's current. Similarly, large DNA cannot move well through the gel and will remain closer to the wells and smaller DNA can move easily through the gel and will move farther away from the wells.
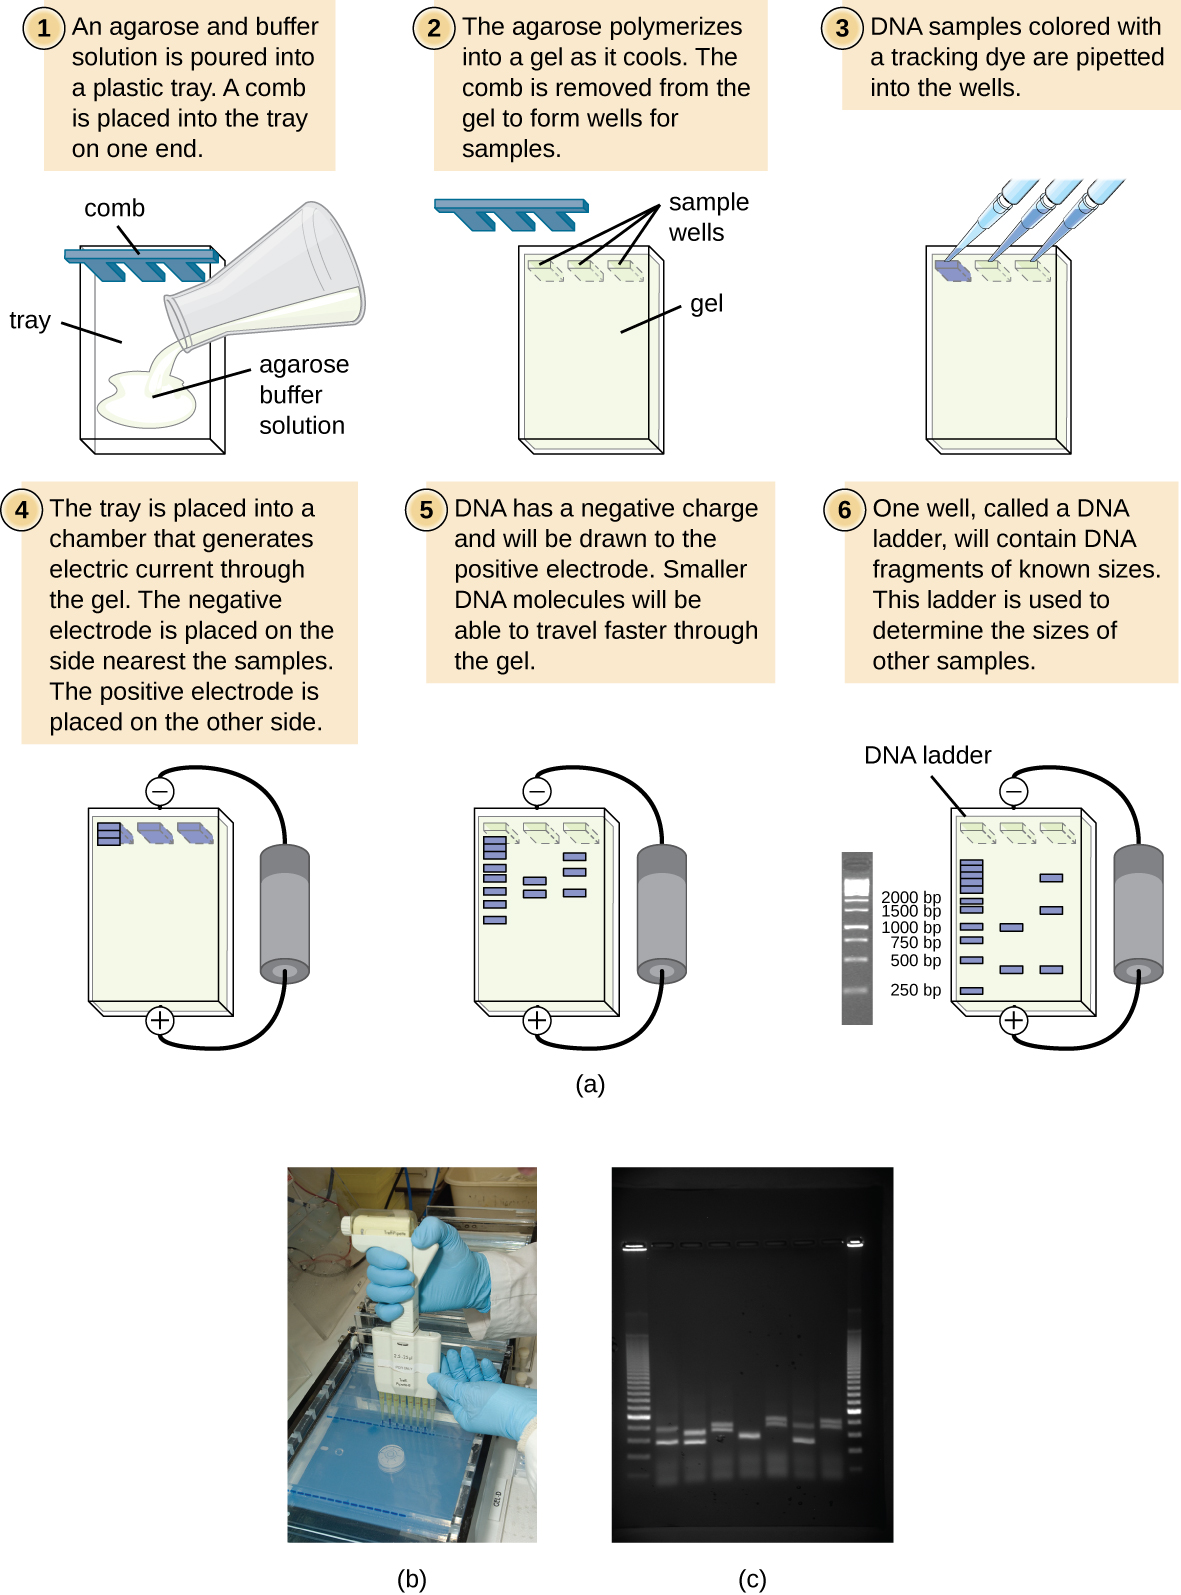
Figure 3: (a) The process of agarose gel electrophoresis. (b) A researcher loading samples into a gel. (c) This photograph shows a completed electrophoresis run on an agarose gel. The DNA ladder is located in lanes 1 and 9. Seven samples are located in lanes 2 through 8. The gel was stained with ethidium bromide and photographed under ultraviolet light. (credit a: modification of work by Magnus Manske; credit b: modification of work by U.S. Department of Agriculture; credit c: modification of work by James Jacob)
Laboratory Instructions
DNA Fingerprinting Scenario
You are an epidemiologist responsible for tracking outbreaks of potentially deadly disease and coordinating responses to help contain the spread of these diseases. It has been reported that a new viral infection is spreading in the Midwestern United States. This infection has symptoms very similar to two pervious viral outbreaks:
- the East Coast viral outbreak produced disease the progressed to multiple organ failure and death
- the West Coast viral outbreak produced disease with manageable symptoms and did not progress to organ failure or death
With this new outbreak in the Midwest, you believe that the virus causing the infections is either the a virus similar to the East Coast outbreak or the West Coast outbreak. How you organize the response to this outbreak is going to be dependent on whether the virus in the Midwest is the more severe strain or the less severe strain.
To determine if the virus is the East Coast virus or the West Coast virus, you conduct RFLP analysis (aka DNA fingerprinting) by extracting the viral DNA and digesting it with a restriction enzyme. To visualize the DNA fingerprint and compare it with the DNA fingerprint of the East Coast and West Coast viruses, you must use gel electrophoresis and then analyze the results.
Load and Run an Electrophoresis Gel
- If the agarose gel has been prepared for you, place it into an electrophoresis chamber, making sure that the wells are positioned on the negative side (black-colored electrode).
- Cover the gel completely with running buffer.
- Use a micropipette and sterile tip to carefully load 20 μl of DNA with loading dye into the wells of the gel as instructed by your instructor. Here are some important things to consider:
- Make sure the micropipette tip is inside the well before pushing down the plunger to put the DNA in the well.
- Careful that the micropipette tip does not go too far into the well since it can break the bottom of the well open and release your DNA into the buffer rather than into the well.
- When you are ready, push down the plunger slowly so the DNA does not get pushed out of the well from the force of it being expelled out of the micropipette.
- Careful not to release the plunger while still inside of the well since this will suck the DNA back up into the micropipette tip.
- When the gel is loaded, close the electrophoresis chamber and plug it into a power source, making sure that black is plugged into black and red is plugged into red.
- Set the voltage of the power source as instructed by your instructor and turn the power on.
- Watch as bubbles are generated in the buffer as the electrical current passes through the buffer.
- Check back in 10-15 minutes to see how the loading dye has moved across the gel.
- At the time instructed by your instructor, turn off the power supply.
- Unplug the leads from the power supply.
- Remove the top of the electrophoresis chamber.
- Carefully remove the gel in its plastic holder and follow your instructor's instructions for staining (if there is time / if you are proceeding to staining in class).
Results & Questions
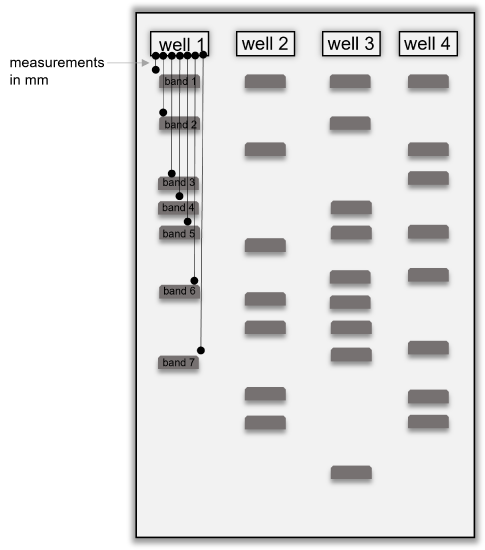
Figure 4: Diagram showing a gel with DNA banding patterns. The wells are numbered to show how to fill out the table below. Black lines show how to measure the migration distance of each band in a single well and how to number the bands, starting with the band closest to the well. Measure band migration distances in millimeters (mm) and be sure to measure each band migration from the edge of the well.
Table 1: Results from gel electrophoresis of DNA fingerprints of East coast virus, West coast virus, and Midwest virus. Some of the columns and rows may not be used in the table below, depending on how your gel was set up and the number of bands in each lane.
| well 1 | well 2 | well 3 | well 4 | well 5 | well 6 | |
|---|---|---|---|---|---|---|
| sample in this well: | ||||||
| band 1 migration (mm) | ||||||
| band 2 migration (mm) | ||||||
| band 3 migration (mm) | ||||||
| band 4 migration (mm) | ||||||
| band 5 migration (mm) | ||||||
| band 6 migration (mm) | ||||||
| band 7 migration (mm) | ||||||
| band 8 migration (mm) | ||||||
| band 9 migration (mm) | ||||||
| band 10 migration (mm) |
- Analyze the banding pattern on the gel by measuring the distance each band traveled from the well in millimeters (mm). See the diagram above to assist with how to make these measurements. Always measure the migration distance from the well, not from the previous band. Fill in the table above with your results.
- Carefully examine the banding pattern in each well. Are there any banding patterns that are similar or the same? If so, which ones?
- What does it indicate when a known and unknown DNA fingerprint have the same banding pattern?
- Based on the results you analyzed on the gel, what conclusions can you make about the Midwest virus?
- Based on the conclusion you made above about the Midwest virus, do you think a lock-down quarantine is necessary to contain the outbreak? Explain your answer.
- Why is a restriction enzyme is used during DNA fingerprinting?
- Why is it necessary to compare a DNA fingerprint of an unknown sample to DNA fingerprints of known samples?
- Why is it that DNA from different sources will produce different banding patterns from each other when you use the same restriction enzyme? Use the following in your answer: restriction enzyme, base sequence, recognition site, fragment size, fragment number
- How does gel electrophoresis separate DNA based on size? In your answer, be sure to mention: DNA's charge, electrophoresis current, agarose gel
- Fill in the blank: Larger DNA fragments will produce bands _______ to/from the wells.
- Fill in the blank: Smaller DNA fragments will produce bands _______ to/from the wells.
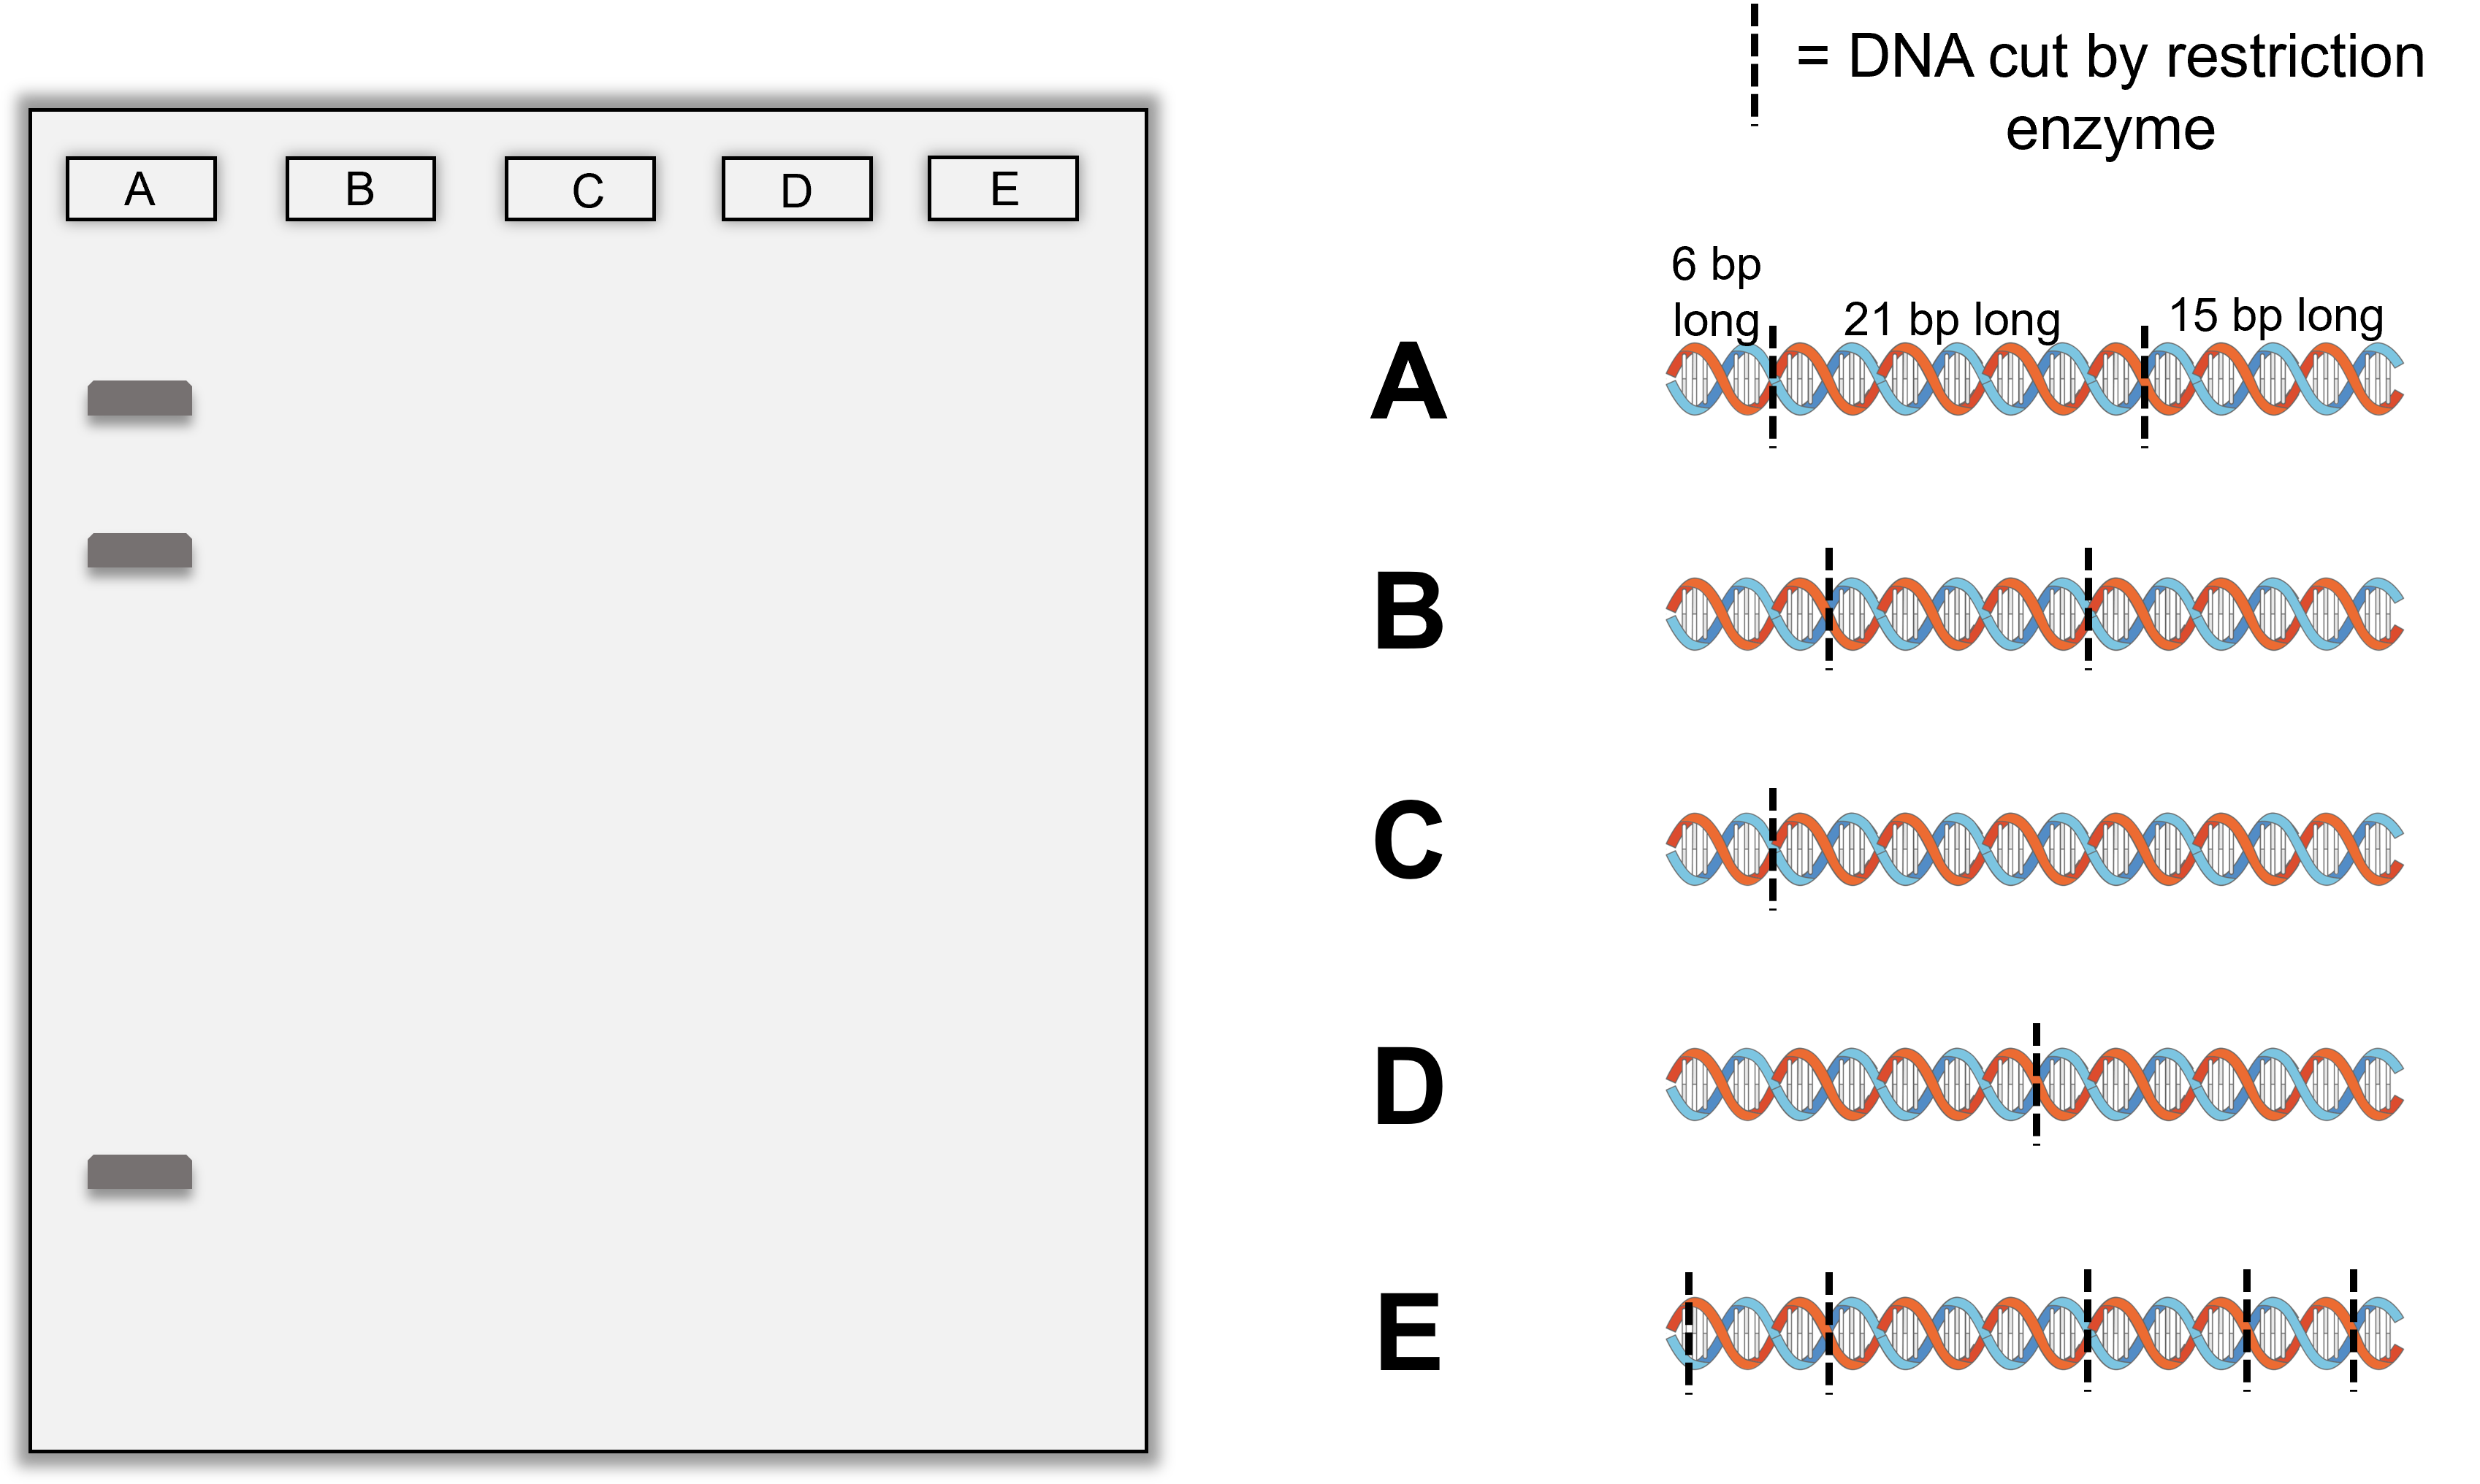
- Below are illustrations of DNA that has been digested by a restriction enzyme in the locations shown with the dotted lines. The bands produced by sample A has been placed on the gel for you. Draw in bands in lanes B through E the correct positions we would expect to see the bands based on the DNA fragment sizes and fragment numbers shown and relative to the sizes and positions of the bands already in the first lane for sample A.
Attribution
- 202202 DNA colored.svg by DataBase Center for Life Science (DBCLS) is licensed under CC BY 4.0
- Chapter Image: DNA agarose gel on a UV lightbox.jpg by Simon is licensed under CC BY-SA 2.0
- HindIII Restriction site and sticky ends vector.svg by Helixitta is licensed under CC BY-SA 4.0
- Microbiology by OpenStax is licensed under CC BY 4.0


