
28.4: The next step - Downsteam intracellular signaling
- Page ID
- 75919


\( \newcommand{\vecs}[1]{\overset { \scriptstyle \rightharpoonup} {\mathbf{#1}} } \)
\( \newcommand{\vecd}[1]{\overset{-\!-\!\rightharpoonup}{\vphantom{a}\smash {#1}}} \)
\( \newcommand{\id}{\mathrm{id}}\) \( \newcommand{\Span}{\mathrm{span}}\)
( \newcommand{\kernel}{\mathrm{null}\,}\) \( \newcommand{\range}{\mathrm{range}\,}\)
\( \newcommand{\RealPart}{\mathrm{Re}}\) \( \newcommand{\ImaginaryPart}{\mathrm{Im}}\)
\( \newcommand{\Argument}{\mathrm{Arg}}\) \( \newcommand{\norm}[1]{\| #1 \|}\)
\( \newcommand{\inner}[2]{\langle #1, #2 \rangle}\)
\( \newcommand{\Span}{\mathrm{span}}\)
\( \newcommand{\id}{\mathrm{id}}\)
\( \newcommand{\Span}{\mathrm{span}}\)
\( \newcommand{\kernel}{\mathrm{null}\,}\)
\( \newcommand{\range}{\mathrm{range}\,}\)
\( \newcommand{\RealPart}{\mathrm{Re}}\)
\( \newcommand{\ImaginaryPart}{\mathrm{Im}}\)
\( \newcommand{\Argument}{\mathrm{Arg}}\)
\( \newcommand{\norm}[1]{\| #1 \|}\)
\( \newcommand{\inner}[2]{\langle #1, #2 \rangle}\)
\( \newcommand{\Span}{\mathrm{span}}\) \( \newcommand{\AA}{\unicode[.8,0]{x212B}}\)
\( \newcommand{\vectorA}[1]{\vec{#1}} % arrow\)
\( \newcommand{\vectorAt}[1]{\vec{\text{#1}}} % arrow\)
\( \newcommand{\vectorB}[1]{\overset { \scriptstyle \rightharpoonup} {\mathbf{#1}} } \)
\( \newcommand{\vectorC}[1]{\textbf{#1}} \)
\( \newcommand{\vectorD}[1]{\overrightarrow{#1}} \)
\( \newcommand{\vectorDt}[1]{\overrightarrow{\text{#1}}} \)
\( \newcommand{\vectE}[1]{\overset{-\!-\!\rightharpoonup}{\vphantom{a}\smash{\mathbf {#1}}}} \)
\( \newcommand{\vecs}[1]{\overset { \scriptstyle \rightharpoonup} {\mathbf{#1}} } \)
\( \newcommand{\vecd}[1]{\overset{-\!-\!\rightharpoonup}{\vphantom{a}\smash {#1}}} \)
Intracellular signaling from activated PKA and PKC
We discussed the basics of the activation of the protein kinase A holoenzyme (R4C4) by cAMP binding to the regulatory subunit, which frees the catalytic subunit C for activity. Likewise, we discussed the activation of PKC at the cell membrane by DAG, Ca2+ ions, and phosphorylation of key Ser/Thr in the protein. Where in the cell are the downstream protein targets of activated PKA and PKC? This is a much simpler question for RTKs since downstream signaling proteins come to them through the interaction of their SH2 domains with the autophosphorylated RTKs. For activated PKA and PKC, it turns out that their location is controlled by scaffolding proteins, which bind them either before their activation or after.
Let's discuss a particularly important scaffolding protein, the A-kinase-anchoring protein (AKAP). There are 13 classes of these containing 50 different members. These proteins bind PKA through its regulatory subunit, where cAMP can mediate the activation of the holoenzyme (R4C4). In addition, AKAPs can bind other signaling proteins including PKC and phosphatases, the latter of which in turn counter-regulate signaling by phosphoproteins. For example, the bound phosphatases can dephosphorylate PKC to deactivate it as well as other downstream phosphoproteins. AKAPs can also bind phosphodiesterase, the enzyme that converts cAMP to AMP, returning signaling to baseline levels. AKAPs localize key signaling enzymes to sites where biologically appropriate protein targets are localized. In addition, they decrease indiscriminate phosphorylation of other off-target proteins elsewhere in the cell. They may also allosterically regulate the activity of bound signaling proteins.
There are at least 50 A-kinase anchoring proteins or A-kinase anchor proteins (AKAPs) that bind the regulatory subunit of protein kinase A (PKA) and localize PKA to specific sites in the cell. By binding multiple signaling enzymes at specific sites, they integrate signaling pathways mediated by cAMP (for example) with others mediated by PKC (again for example).
Here are some examples of AKAPs in humans (from UniProt). Note that one (12) also binds PKC
- 1, mitochondrial: Binds to type I and II regulatory subunits of protein kinase A and anchors them to the cytoplasmic face of the mitochondrial outer membrane;
- 6: Binds to type II regulatory subunits of protein kinase A and anchors/targets them to the nuclear membrane or sarcoplasmic reticulum;
- 7 isoforms alpha and beta: Targets the cAMP-dependent protein kinase (PKA) to the plasma membrane, and permits functional coupling to the L-type calcium channel;
- 7 isoform gamma: targets cAMP-dependent protein kinase (PKA) to the cellular membrane or cytoskeletal structures;
- 8: Acts as an anchor for a PKA-signaling complex onto mitotic chromosomes, which is required for the maintenance of chromosomes in a condensed form throughout mitosis;
- 8-like: Required for cell cycle G2/M transition and histone deacetylation during mitosis and recruitment of signaling enzymes into the nucleus;
- 9: assembles several protein kinases and phosphatases on the centrosome and Golgi apparatus;
- 12: Anchoring protein that mediates the subcellular compartmentation of protein kinase A (PKA) and protein kinase C (PKC)
- 17A: Splice factor regulating alternative splice site selection for certain mRNA precursors. Mediates the regulation of pre-mRNA splicing in a PKA-dependent manner.
Figure \(\PageIndex{1}\) illustrates the localization/binding of signaling enzymes (PKA, PKA substrates, PDE, other kinases) to AKAPs.

Note that some AKAPs can also bind PKA substrates, facilitating their phosphorylation and minimizing the phosphorylation of the wrong targets.
AKAPs use an amphiphilic helix to interact with the R2 regulatory dimer of the PKA. Some AKAPs bind to just one of the regulatory subunits. Note that some AKAPs can also bind PKA substrates, facilitating their phosphorylation and minimizing the phosphorylation of the wrong targets.
Figure \(\PageIndex{2}\) shows specific AKAP complexes in the heart that could be targeted for drug therapies.

Panel (A): Disruption of the AKAP18γ/δ-PLB (another phospholipase involved in signaling) interaction prevents PLB phosphorylation on Ser16 and dislocation from SERCA2 (Sarcoplasmic/endoplasmic reticulum calcium ATPase 2). This inhibits SERCA2 activation and consequently Ca2+ uptake into the sarcoplasmic reticulum
Panel (B): Disruption of the nesprin-1α /mAKAP interaction promotes AKAP/PKA complex dissociation from the perinuclear membrane and might be a strategy to reduce hypertrophy. Nesprin 1 is a protein that forms a linking network between organelles and the actin cytoskeleton to maintain the subcellular spatial organization.
Panel (C): Disruption of the connexin 43-ezrin interaction could prevent PKA-mediated phosphorylation increasing inter-cardiomyocyte conductivity which could be cardioprotective following myocardial infarction damage. Connexin is a gap junction protein. Ezrin is involved in the connections of major cytoskeletal structures to the plasma membrane.
To add to the complexity of PKA activation and signaling, there are different forms of the regulatory subunits of the holoenzyme PKA. These include RIalpha (RIA), RIbeta (RIB), RIIalpha (RIIA), and RIIbeta (RIIB). They have different affinities for cAMP, the catalytic subunits Cs, and different AKAPs.
Figure \(\PageIndex{3}\) shows an interactive iCn3D model of the amphiphilic anchoring peptide AKAP-IS for AKAP binding to the docking and dimerization (D/D) domain of the RIIalpha regulatory subunit of PKA (2IZX)
.png?revision=1&size=bestfit&width=391&height=360)
The brown represents the RII dimer D/D domains of the regulatory subunit. The anchoring peptide AKAP-IS is shown in gray. In both, the side chains involved in binding of the peptide to the regulatory subunit domains are shown as sticks and colored coded based on the hydrophobicity of the side chains. Green indicates the most hydrophobic. Rotate the model carefully to differentiate the side chains and note that the hydrophobic face of the peptide is interacting with hydrophobic side chains projecting into a groove made by the two RII dimer D/D domains. Polar side chains in AKAP help target the correct isoform of the R subunit.
In addition to binding to some AKAP scaffolds, PKC also binds to Receptors for Activated C-Kinases (RACKs), heat shock proteins (HSP), importing, and annexins (AnxA1, A2, A5, and A6). The interactions of activated PKC with RACK1 and downstream events are shown in Figure \(\PageIndex{4}\).

The insect protein BR-C (Broad Complex) has a DNA binding domain (two zinc fingers) domain for the activation of gene transcription and a BTB) domain that allows binding to RACK1. On binding the PKC:RACK1 complex, BR-C is phosphorylated at Ser373 and Thr406, after which it is translocated into the nucleus where it binds DNA and activates gene transcription
The binding of PKC to RACK1 stabilizes PKC for the phosphorylation of targets. PKC binds to RACK through its C2 regulatory domains. Binding may be to specific forms of PKC including unphosphorylated, inactive, and activated phosphorylated forms, as well as to specific isozymes of PKC. RACK1 may also recruit PKC to the ribosome and it inhibits the activity of SRC kinases which we will discuss later. PKC activity occurs in many cellular locations, including the cell membrane, nucleus, Golgi apparatus, mitochondria, and cytosol. RACKS also bind and recruit other signaling proteins including PLCγ, Src, and integrins. In addition to interactions of PKC with RACK through the C2 domain, PKC can localize through its C1 domain.
Structure of RACK1
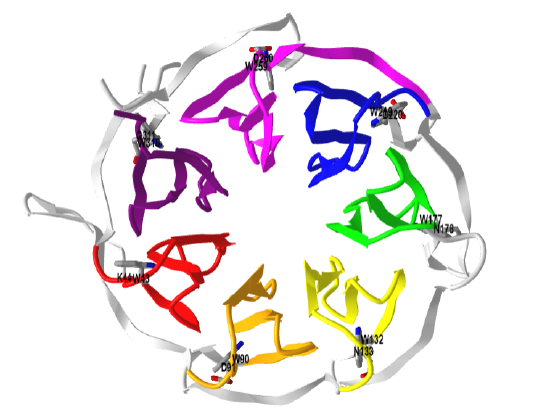
RACK1 (317 amino acids) has a very interesting structure. It is a member of a family of over 100 proteins that have tryptophan-aspartate (WD) repeats that are 44-60 amino acids and ending in WD or a variant. It is homologous to the beta subunit of the heterodimeric Gαβγ signaling protein. RACK 1 interacts with proteins through a 7-bladed propeller structure that allow the binding of proteins with SH2 domains, plextrin homology (PH) domains, and C2 domains (PKCs). Figure \(\PageIndex{5}\) shows the WD repeats in human RACK1. Note that the N-terminal end of the WD repeat often is glycine-histidine (GH).

Figure \(\PageIndex{6}\) a model for the interaction of RACK1 and PKC-βII.
 |
 |
Figure \(\PageIndex{6}\): Model for PKC-βII and RACK1 interaction. Adams et al. Cell Communication and Signaling 2011, 9:22 http://www.biosignaling.com/content/9/1/22. Creative Commons Attribution License (http://creativecommons.org/licenses/by/2.0)
Panel (A) shows the resting state with no interaction between RACK1 and inactive PKCbII. Panel (B) shows how activation of PKC-βII leads to its interaction with RACK1. Substrate binding and phosphorylation follow. R is a receptor and L is its ligand.
Figure \(\PageIndex{7}\) shows how RACK1 can translate into the nucleus after ligand (L) gated activation of GPCRs (R) through adenylyl cyclase production of cAM and activation of Protein Kinase A.
 |
 |
Figure \(\PageIndex{7}\)Model for cAMP/PKA-mediated nuclear translocation of RACK1. Adams et al. Cell Communication and Signaling 2011, 9:22 http://www.biosignaling.com/content/9/1/22. Creative Commons Attribution License. (http://creativecommons.org/licenses/by/2.0)
Panel (A) shows the resting state of RACK, which forms homodimers and heterodimers with the homologous Gβ subunit of the Gαβγ complex. Panel (B) shows how activation of PKA leads to dissociation of RACK which then can translate into the nucleus, where it leads to increased transcription of brain-derived neurotrophic factor (BDNF).
Figure \(\PageIndex{8}\) shows an interactive iCn3D model of a the human Rack1 (4AOW) color coded as in Figure \(\PageIndex{5}\).
Downstream signaling from activated receptor tyrosine kinases
To review once again, when receptor tyrosine kinases get activated by binding a primary messenger such as a growth factor, the receptors dimerize, activating their cytoplasmic kinase domains. The activated RTK then autophosphorylates itself. The phosphorylated intracellular domain provides a docking site for other cellular "adaptor" proteins that contain an SH2 domain. The bound adaptor protein binds other signaling molecules within the cell leading to downstream propagation of the signal. Figure \(\PageIndex{8}\) shows some RTKs and downstream signaling events. We have already discussed the activation of the lipid kinase phosphoinositide 3-kinase (P13K) which leads to the activation of Akt (PKB). In the rest of this section, we will focus on the next step after the activation of RTKs. We focus on the epidermal growth factor receptor (EGFR, ErbB1) again.

1. Downstream signaling from the epidermal growth factor receptor.
Figure \(\PageIndex{9}\) shows events associated with the activation of EGFR.

Once bound and activated by binding of growth factors protein signals, the intracellular domains of the now dimeric EGFR autophosphorylates themselves on selected tyrosine side chains. This then recruits a protein called Growth factor receptor-bound protein 2 (GRB2), which has an SH2 (Sarc Homology 2) domain that binds phosphotyrosine motifs in proteins. GRB2 acts as an adaptor protein in that in addition to the SH2 domain, it has two SH3 (Sarc Homology 3) domains that bind proline-rich domains on other signaling proteins, including the protein Son of sevenless homolog (SOS). GRB2 does not have enzymatic activity.
The adaptor protein GRB2 binds through its SH3 domain to the protein SOS, which then interacts with the protein Ras. This last member in the recruited complex is named because it causes Rat Sarcomas. There are many variants of these proteins but three are key in humans, HRas, KRas, and NRas. Ras is perhaps the key member of the family of intracellular small G proteins that bind GDP/GTP and are activated on the exchange of GTP for GDP. The proteins also have intrinsic GTPase activity as is found in the Gα protein of the heterotrimeric Gαβγ protein.
So what does SOS do? The SOS bound to RAS facilitates the exchange of GTP for GDP on Ras, maintaining it in an active state. SOS is a member of another fascinating class of small proteins that catalyze the exchange of GTP for GDP. The family of GTP/GDP exchange proteins is called Guanine nucleotide Exchange Factors (GEFs). We will explore this in the next section.
The EGFR -GRB2-SOS-Ras complex in the figure above looks somewhat similar to the structure of a GPCR-heterotrimeric G protein GαGβGγ complex, where Gα is also a GTP/GDP exchange protein with intrinsic GTPase activity. When the ligand binds to the GPCR, a conformational change ensues which facilitates the exchange of GTP for GDP on the Gα protein, activating intracellular signaling.
Once RAS is activated (bound to GTP), it binds and activates key kinases in the cell, including the lipid kinase PI3K and RAF, a kinase shown in Figure \(\PageIndex{8}\). Control of RAS activity is critical in signaling. It is one of the most commonly mutated proteins in cancer cells. Mutations that inhibit the intrinsic GTPase activity keep the protein active, leading to unregulated cell growth, proliferation, and differentiation, hallmarks of cancer cells.
The domain structures of GRB2 and SOS are shown in Figure \(\PageIndex{10}\). The proline-rich domain (motif) is not shown in the figure.
GRB2 domain structure (green SH3 domains) (green SH3 domains) |
SOS1 domain structure |
Figure \(\PageIndex{10}\): Domain structure of GRB2 and SOS1 (proline rich domain not shown in SOS)
As we discussed in Chapter xx (domains), new genes encoding proteins with new functionalities can be created by duplicating and adding gene segments for different domains in a preexisting gene. As we have seen with the SH2 and SH3 domains, signaling proteins often share common domains. Table \(\PageIndex{1}\) below, adapted from the excellent book Cell Signaling by Lim, Mayer, and Pawson, shows some common domains found in signaling proteins.
| Domains in Signaling Molecules | ||||
| Domain | Binding Target | Cellular Process | Example protein |
Pdb file (examples) Find your own in the PDB |
| Bromo | Acetyl-Lys | Chromatin reg. | BRD4 | 2YYN |
| C1 | diacylglycerol | Plasma membrane recruitment | Raf-1 | 3OMV |
| C2 | Phospholipid (Ca-dependent) | Membrane targeting, vesicle trafficking | PRKCA | 3IW4 |
| CARD | Homotypic Interactions | apoptosis | CRADD | 3CRD |
| Chromo | Methyl-Lys | Chromo reg, gene transcription | CBX1 | 3F2U |
| Death (DD) | Homotypic inter. | Apoptosis | Fas | 3EZQ |
| DED | Homotypic inter. | Apoptosis | Caspase 8 | 1F9E |
| DEP | Memb, GPCRs | Sig trans, protein trafficking |
Dsh human disheveled 2 |
2REY |
| GRIP | Arf/Art G prot | Golgi traffic | Golgin-97 (Golga5) | 1R4A |
| PDZ | C-term peptide motifs | Diverse, scaffolding |
PSD-95 Or discs large homolog 4 |
1L6O |
| PH | Phospholipids | Membrane recruirtment | Akt |
1O6L 3CQW |
| PTB | Phospho-Y | Y kinase signaling |
Shc 1 SHC-transforming protein 1 |
1UEF 1irs |
| RGS | GTP binding pocket of Galpha | Sig trans | RGS4 | 1EZT |
| SH2 | Phospho-Y | pY-signaling | Src | 4U5W |
| SH3 | Pro-rich sequence | Diverse, cytoskeleton | Src | 2PTK |
| TIR | Homo/Heterotypic | Cytokine and immune | TLR4 | 3VQ2 |
| TRAF | TNF signaling | Cell survival | TRAF-1 | 3ZJB |
| VHL | hydroxyPro | ubiquitinylation | VHL | 1VCB |
Figure \(\PageIndex{11}\) shows an interactive iCn3D model of the GRB2-SH2 domain in complex with a high affinity phosphopeptide KPFpYVNVEF (1BMB)
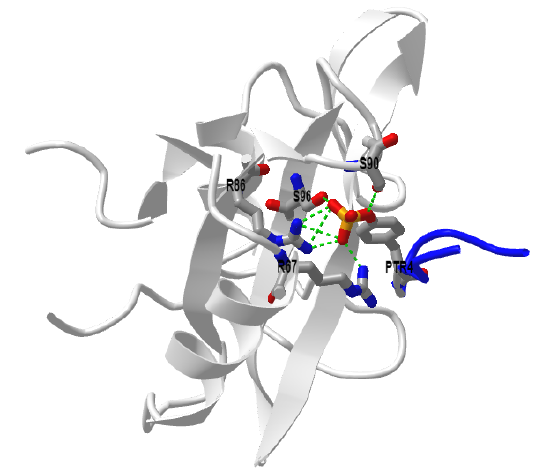
Grb2 exists in both a monomeric state which can bind SOS, and a dimeric state which can't. You would expect the equilibrium between the monomer and dimeric form would be highly regulated. When a phospho-tyrosine ligand is bound to Grb2 through its SH2 domain, the dimer dissociated. This also occurs on phosphorylation of tyrosine 160 (Y160) on Grb2, a post-translational modification found in human prostate, colon, and breast cancers.
Figure \(\PageIndex{12}\) shows an interactive iCn3D model of the GRB2 N-terminal SH3 domain complexed with a ten-residue proline-rich peptide (1135 Ac-VPPPVPPRRR-NH2) derived from SOS (1GBQ)
.png?revision=1&size=bestfit&width=392&height=329)
We will explore interactive structures of the small G protein Ras with the guanine nucleotide exchange factor SOS in the next chapter section.
After activation of Ras through GTP exchange for GDP, the GTP-Ras protein binds to and activates the kinase Raf. We will continue our exploration of that later in this section.
2. Downstream signaling from the insulin receptor.
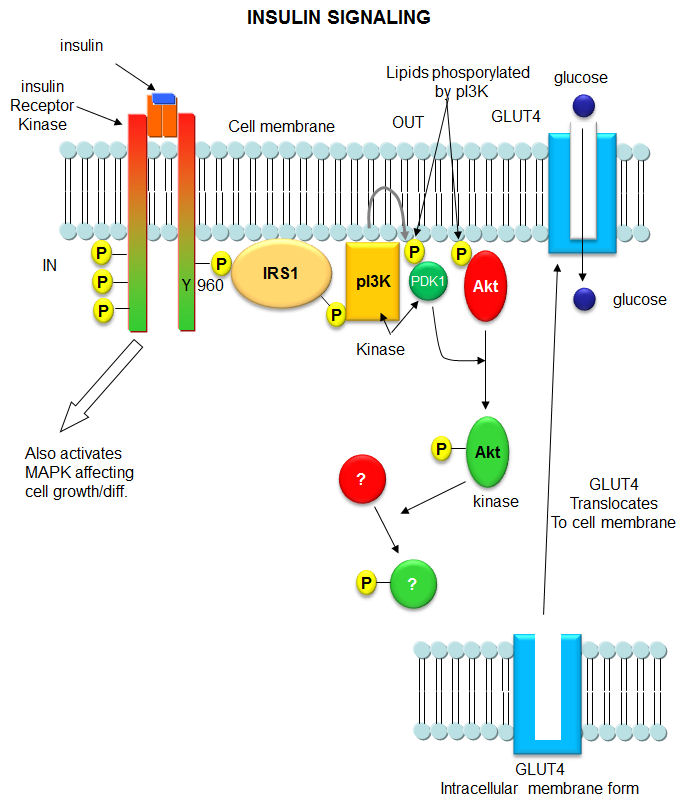
When insulin binds to the receptor tyrosine kinase (RTK), it phosphorylates itself, which then leads to the binding of other proteins to the activated receptor and their phosphorylation. These lead to more intracellular signaling and ultimately changes in gene transcription. We'll focus on a specific adaptor protein, the Insulin Receptor Substrate 1, IRS1, a "scaffolding protein", which leads to the movement of the glucose transport protein GLUT4 to the cell surface, allowing glucose uptake. These activities are shown schematically in Figure \(\PageIndex{13}\).

Figure \(\PageIndex{13}\): Binding to insulin stimulates the association of the receptor with downstream mediators, including insulin receptor substrate-1 (IRS-1) and PI3K. The insulin receptor can activate PI3K either directly, by binding to the p85 regulatory subunit, which produces PIP3, or indirectly, which leads to phosphorylation and the activation of AKT. Afterward, AKT phosphorylates the Ser9 site of GSK-3β and inhibits its activity. The PI3K/AKT/GSK-3β signaling pathway is involved in insulin signaling transduction, and GSK- 3β is regulated and controlled by insulin in this signaling pathway. Arneth et al. Int. J. Mol. Sci. 2019, 20, 2467; doi:10.3390/ijms20102467. Creative Commons Attribution (CC BY) license (http://creativecommons.org/licenses/by/4.0/).
Human IRS1 has two domains, a PH domain for binding to membranes through phosphorylated IP2 derivatives and an IRS/PTB domain which binds phosphotyrosines on proteins. The PTB and the SH2 domains are the most common domains for binding phosphotyrosines on proteins. PTB binds the NPXY, where X is a pTyr.
We show a more detailed view in Figure \(\PageIndex{14}\), in part, to review many of the signaling proteins we have seen before, including PI3K and PDK1.
Likewise, another review of PIP2 derivatives is warranted. After phosphorylation by the activated insulin receptor protein tyrosine kinase, IRS-1 binds phosphatidylinositol 3-kinase (PI3K) that causes phosphorylation of the 3'OH on phosphatidyl inositol (PI) in the inner leaflet of the membrane to form PI(3)P. PI3K is a member of a family of kinases that phosphorylates PIP2. The metabolic pathway centered on pI3K is one of the most mutated in human cancers. PI(3)P in turn recruits to the membrane other inactive kinases, phosphoinositide-dependent kinase 1, PDK1, and Akt, also known as PKB. Figure \(\PageIndex{15}\) shows phosphorylated phosphatidylinositol derivatives.
On binding of PI(3)P, PDK1 becomes an active kinase, which phosphorylates and activates Akt. Akt kinases are major Ser/Thr protein kinase that phosphorylates proteins involved in a host of cell activities, including regulation of glucose transport, cell proliferation, and death. In the insulin signaling pathway, active (phosphorylated) Akt leads to the movement of the GLUT4 protein from intracellular endosomal vesicles to the cell surface, which offers a quicker way to import glucose into the cell than if Akt activated GLUT 4 gene expression. PDK1 phosphorylation of Akt2-T309 is required for insulin-stimulated Glut4 translocation. If T309 is mutated to A309 or if PDK1 is inhibited, GLUT 4 is not translocated to the cell membrane.
Figure \(\PageIndex{16}\) shows an interactive iCn3D model of the activated insulin receptor tyrosine kinase in complex with peptide substrate and ATP analog (1IR3))
.png?revision=1&size=bestfit&width=559&height=319)
The dimeric form of the kinase is shown. ANP is shown in spacefill. The peptide substrate containing the interior tyrosine (stick) for phosphorylation is shown in blue. Three key tyrosines in the activation loop that are autophosphorylated (Tyr1158, Tyr1162, and Tyr1163) are shown and labeled in the right-hand monomer.
As with a protein kinase, the activation loop of the insulin receptor kinase domain is phosphorylated and the resulting conformational change allows ATP and target protein access. The activation loop gets phosphorylated on Tyr1158, Tyr1162, and Tyr1163 with Y1163 being key.
Downstream signaling from Cytokine activated Receptors- The JAK/STAT pathway.
Now we explore two signaling pathways mediated by the adaptor protein JAK and STAT. These are abbreviations for the Janus Kinase (JAK) and the Signal Transducer and Activator of Transcription (STAT). These play key roles in embryonic development, stem cell maintenance, hematopoiesis (formation of blood cells), and immune cell signaling. . This pathway is stimulated by cytokines and interleukins, protein modulators released by immune cells, as well as growth factors.
In general, there are five groups of cytokines:
- tumor necrosis factor alpha (TNF-alpha)
- Interleukin-1 family members (IL-1_
- Transforming growth factor-beta (TGF-bet)
- those that signal through RTKs (such as macrophage colony-stimulating factor (M-CSF)
- Chemokines
- cytokines that signal through JAK/STAT
In contrast to RTKs, which have kinase domains activated on receptor dimerization, cytokine receptors that work through JAK/STAT do NOT have kinase domains. On cytokine binding to their target cytokine receptor, the now-activated receptors activate the prebound inactive Janus kinase through conformational changes. The kinase domains autophosphorylate themselves in a trans fashion. The active kinase then phosphorylates the cytoplasmic tails of the cytokine receptors. This trigger further signal transduction reactions mediated by the binding of target signaling proteins to the cytoplasmic region of the phosphorylated cytokine receptor. Just to reiterate, the cytokine receptor is NOT a RTK with latent kinase activity. Instead, it becomes phosphorylated by the bound and cytokine-activated JAK. A portion of the pathway is illustrated in Figure \(\PageIndex{17}\).

Panel (A1) shows that the kinase JAK is bound constitutively in an inactive state to the cytokine receptor cytoplasmic region, not through its SH2 domain, but through its FERM domain (Panel B). The figure implies the cytokine receptor is dimeric in the absence of a ligand. On cytokine binding, conformational changes and repositioning of the bound JAK activates its kinase domain, which phosphorylated the C-terminal tails of the cytokine receptor. STAT monomers, through their SH2 domains, bind to the phosphorylated cytokine receptor where they get phosphorylated by the active JAK. The phospho-STAT monomers form a dimer, dissociate from the complex, and translocate to the nucleus where they act as transcription factors. the Janus kinase is named after Janus, the two-faced Roman god of beginnings, endings, and duality since JAK has two nearly identical JH kinase domains. One has kinase activity while the other inhibits the first.
Panels (B) shows the domain structure of JAK. The FERM domain facilitates JAK:cytokine receptor binding. The JH2 pseudokinase domain regulates the kinase activity of the JH1 kinase domain. Ps show site on JAK necessary for activation
Panel (C) shows the domain structure of STAT. The SH2 domain binds phosphorylated tyrosines. The carboxy terminus transactivation domain is required for full transcriptional activation. P marks the conserved tyrosine residue whose phosphorylation is essential for STAT activation.
The pseudokinase domain of JAK interacts with the kinase domain on the same chain and prevents its activity in the inactive monomer and dimer. Cytokine binding to the cytokine receptor induces a conformational change that promotes the interactions of the pseudokinase domain on one JAK monomer with the same domain on another, promoting dimerization and freeing the kinase domains for activity. Figure \(\PageIndex{18}\) shows the pseudokinase domain (orange) interactions in the active JAK dimer.
.png?revision=1&size=bestfit&width=553&height=373)
Figure \(\PageIndex{18}\): The pseudokinase domain (orange) interactions in the active JAK dimer.
The kinase domain of each dimer is shown in red and the pseudokinase domain is shown in orange. The activation loop (cyan) and ADP (spacefill, CPK colors) are shown in the red kinase domains. The orange pseudokinase domain has a bound adenosine (not ADP) that is shown spacefill and CPK color. However, it lacks the
DFG motif required for catalysis. The phenylalanine cluster (F635, 657, 574) are labeled. The structure is actually for a mutant that has the V657F mutation that promotes dimerization and JAK activity. Hence the V657F mutation is oncogenic.
JAK activity can be inhibited by the protein suppressor of cytokine signaling (SOCS). Transcription of the protein is activated by STAT, and the SOCS protein in a feedback inhibition loop binds to JAKs and also to IFNGR1, which inhibit JAK activity.
Figure \(\PageIndex{19}\) shows an interactive iCn3D model of the structure of the inhibitory protein SOCS1 in complex with JAK1 kinase domain (6C7Y)
.png?revision=1&size=bestfit&width=389&height=305)
The N-lobe of the JAK1 kinase domain is shown in cyan and the C-lobe in magenta. ADP (sticks) and Mg2+ (green) are shown in the interface between the lobes. SOCS1 is shown in gray except for the kinase inhibitor region which is shown as spheres and CPK colors. It binds in the substrate binding grove and prevents substrate access.
Activated JAK activity and signaling do not stop simply with the activation of STAT. In addition to stimulating signaling through phosphorylated dimers of STAT, cytokines also activate other signaling pathways through the same receptors. Examples include the PI3K pathway described in an earlier section and also the MAPK pathways, described in detail later in this section. Both the PI3K and MAPK pathways are activated by binding the cytokine IL6 to its cytokine receptor. The mechanism for PI3K activation is a bit unclear. The MAPK pathway is activated by a phosphatase called SHP2 for Src homology region 2 domain‐containing phosphatase 1. This protein binds to pTyr759 on the IL-6 receptor. As binding of the cytokine activates the prebound JAK, it also activates SHP2, ultimately activating signaling through Ras (a small G protein), which activates RAF, a kinase. Figure \(\PageIndex{20}\) shows these three combined signaling pathways for a cytokine receptor: STAT, Ras, and PI3K activations.

The cytokine receptor induces activation of JAKs after cytokine stimulation following the phosphorylation of STATs. Furthermore, phosphorylated STATs undergo dimerization and translocate to the nucleus to activate target gene transcription. SOCS, suppressors of cytokine signaling; PI3K, phosphatidyl inositol 3 kinase; Akt, protein kinase B; FOXO, Forkhead box protein O; mTOR, mammalian Target Of Rapamycin.
Figure \(\PageIndex{21}\) shows an interactive iCn3D model of the Crystal structure of a tyrosine phosphorylated STAT-1 dimer bound to DNA (1BF5)
.png?revision=1&size=bestfit&width=409&height=334)
The dimer chains are shown in brown and gold except for those colored-coded by secondary structure (helix red, sheet yellow). The backbone of the nucleotides is shown in spacefill cyan and gray. Zoom in to see noncovalent interactions between the bound DNA and protein monomers. Two phospho-tyrosines labeled pTR701 are shown as well. The DNA binding domain of the STAT dimer has an immunoglobulin fold and forms a "C-shaped clamp" around the DNA. The domains colored by secondary structure are SH2 domains, with each recognizing and binding to the phosphorylated Tyr 701 (labeled pTR701), a very interesting use of the SH2 domain.
Figure \(\PageIndex{22}\) shows an interactive iCn3D model of the active Janus Kinase (JAK) dimer complexed with the intracellular domains (spacefill) of the interferon lambda(a cytokine) receptor (7T6F).
_dimer_complexed_with_cytokine_receptor_intracellular_domainV2_(7T6F).png?revision=1&size=bestfit&width=343&height=372)
Figure \(\PageIndex{22}\): Active Janus Kinase (JAK) dimer complexed with the intracellular domain of the interferon lambda(a cytokine) receptor (7T6F). (Copyright; author via source). Click the image for a popup or use this external link: https://structure.ncbi.nlm.nih.gov/i...9s3VBNMxsk7WM7
Domain/protein Coloring
- Red: PTKc-JAK-rpt2 kinase catalytic domain
- Orange: PTK-JAK1-rpt1 pseudokinase domain
- Yellow: FERM F2
- Magenta: FERM C-JAK1
- Cyan: SH2
- Brown: FERM F1
- Navy Blue and Blue spacefill: cytoplasmic domains of the cytokine receptor interferon lambda receptor 1 dimer
- The gold large sphere represents interferon bound to the extracellular domain of the interferon lambda receptor 1 dimer
Figure \(\PageIndex{23}\) shows a model combining the active Janus kinase (JAK) containing the intracellular domain of the interferon alpha receptor 1 dimer (navy and blue spacefill) with AlphaFold models of the extracellular and transmembrane domain of the interferon-alpha receptor ((Q8IU57))

Figure \(\PageIndex{23}\): AlphaFold model of Interferon lambda receptor 1 Extracellular Domain and transmembrane domain (Q8IU57) with Active Janus Kinase (JAK) dimer complexed with cytokine receptor intracellular domain (7T6F)
Again, to reiterate as we did above, the cytokine receptor (in the figure above the interferon lambda receptor) is NOT a RTK with latent kinase activity. Instead, it becomes phosphorylated by the bound and cytokine-activated JAK which is resident in the cytoplasm.
Here is a link to a second iCn3D model which shows the phenylalanine cluster that promotes pseudokinase domain interactions in the active JAK dimer.
Downstream Intracellular signaling through Src Family Kinases - Membrane-associated non-receptor tyrosine protein kinases
Another family of intracellular protein kinases - the Src family - are often activated on upstream activation of many different types of receptors including GPCRs, RTKs, cytokine receptors, as well as integrins and adhesion receptors that we explore in a later chapter section. We have already touched on them when we discussed proteins containing the src homology domains SH2 and SH3. Src, an intracellular Tyr kinase (MW 60,000), is the founding member of this family of protein kinases. Src is activated when it binds through its own SH2 domain to a phosphorylated membrane receptor.
Src has many names including Proto-oncogene tyrosine-protein kinase Src, proto-oncogene c-Src, pp60c-src, and p60-Sr. These membrane-associated, non-receptor tyrosine kinases regulate cell proliferation, differentiation, apoptosis, migration, metabolism, and cytoskeleton organization. They are one of the major classes of intracellular kinases which are activated after upstream activation of the membrane receptors mentioned above (GPCRs, RTKs, cytokine receptors, as well as integrins and adhesion receptors). They in turn activate further downstream protein kinases by phosphorylation. They even phosphorylate the upstream membranes which led to their activation.
There are 10 members in the Src family: Src, Frk, Lck, Lyn, Blk, Hck, Fyn, Yrk, Fgr, and Yes. They all share the same expanded domain structure shown in Figure \(\PageIndex{24}\).

They have an SH4 N-terminal region that can be post-translationally modified with fatty acids (myristoylation and palmitoylation), which can anchor it to the membrane. The spacer SH2-SH3 spacer is intrinsically disordered and differs in sequence among members of the Src family. Two key phosphorylation sites (Tyr416 and Tyr527) are important. In inactive Src, Try 527 is phosphorylated, allowing it to bind to the SH2 domain. The SH2-kinase linker also binds to the SH3 domain. This occludes the active site region and prevents the phosphorylation of Try 416 in the "activation loop" of the SH1 kinase domain. When Try 527 is dephosphorylated, a conformation change ensues the opens the binding site allowing autophosphorylation of Tyr 416 and its activation. Hsu et al, Cancers 12(6):1361. DOI: 10.3390/cancers12061361. CC BY 4.0
Figure \(\PageIndex{25}\) shows an interactive iCn3D model of the Human tyrosine-protein kinase C-Src in complex with AMP-PNP (2SRC)
.png?revision=1&size=bestfit&width=452&height=352)
pY527 is shown in stick and labeled. It binds to the SH2 domain (151-248) shown in cyan. The SH3 domain is in magenta and the kinase domain is shown in gray. The activation loop in the kinase domain is shown in red with the pY416 needed for activation shown in stick and labeled. ANP is shown in spacefill.
We have now seen the structure of many kinase domains. Figure \(\PageIndex{26}\) shows an interactive iCn3D model of the alignment of human c-Src (452 amino acids) (2SRC) and Erk2 (362 amino acids) also called MAPK1 (2Y9Q), a protein kinase will be explored at the end of this section
_and_Erk2%25C2%25A0(2Y9Q).png?revision=1&size=bestfit&width=314&height=350)
Red shown conserved sequences, blue is aligned (but not conserved), and gray is nonaligned. Use the "a" key to toggle between the states.
After much discussion of the binding of p-Tyrosine side chains to the SH2 domain, we now present Figure \(\PageIndex{27}\), which shows an interactive iCn3D model of a phosphotyrosine peptide bound to the SH2 domain of Fer tyrosine kinase (6KC4)
.png?revision=1&size=bestfit&width=354&height=337)
The SH2 domain is shown in gray. The phosphopeptide (DEpYENVD) is shown in cyan with the labeled pY in sticks. The side chains on the SH2 domains interacting with the pY are shown in stick and labeled.
We are about to explore the last but incredibly important downstream kinases activated in signal transduction cascades, the mitogen activate protein kinase (MAPK) cascade. It could also be called the Erk cascade. Before we do that, we present parts of three pathways mediated by activated RTKs to refresh your minds and also because the more you see key players in the pathway, the more you start to remember the names, structural features, and function of the signaling molecules.
Figure \(\PageIndex{28}\) offers a quick and abbreviated look at signaling through activated RTKs that proceed through the adaptor protein and the GEF SOS, leading to the activation of Ras, a key small G protein. Ras in turn activates a protein (MAPKKK) in the MAPK cascade.

Figure \(\PageIndex{28}\): Simplified cartoon showing the activation of the MAPK cascade protein MAPKKK. Cordover E, Minden A. Signaling pathways downstream to receptor tyrosine kinases: targets for cancer treatment. J Cancer Metastasis Treat 2020;6:45. http://dx.doi.org/10.20517/2394-4722.2020.101. Creative Commons Attribution 4.0 International License (https://creativecommons.org/licenses/by/4.0/),
Figure \(\PageIndex{29}\) shows an abbreviated version of the activation of the lipid kinase PI3K and through the activation of PDK1 and AKT, the activation of two major kinase complexes, mTORC1, and mTORC2, which we will explore in its a separate chapter section.

Finally, Figure \(\PageIndex{30}\) show the combined activation of both the MAPK (ERK) cascade pathway and the mTOR complex through GPCR signaling using the adaptor protein Grb2.

Downstream signaling through the Mitogen-Activated Protein Kinase Cascade
Active upstream kinases like PKA, PKC, and RTKs phosphorylate target proteins and in doing so change their activities. The usual protein targets are kinases, which become active on phosphorylation. They in turn activate other kinases, resulting in a complex cascade and amplification of the original signal. Often the end product of such cascade is a phosphorylated transcription factor that can alter gene expression. Perhaps the most described of these cascades is the Mitogen-Activated Protein Kinase (MAPK) pathway. Mitogens are chemical species that lead to mitosis (cell division). The MAPK system has three layers and a confusing nomenclature (until you are used to it). The end (downstream) product of the cascade is the enzyme mitogen-activated protein kinase, abbreviated MAPK. It can be phosphorylated several times to produce MAPKP or MAPKPP where the last Ps in the abbreviation signifies the number of added phosphate groups.
The kinase immediately upstream that phosphorylates MAPK is abbreviated MAPKK (for mitogen-activated protein kinase kinase) or MAP2K. MAPKK (MAP2K) is activated by yet another upstream kinase called MAPKKK or MAP3K. If these are also targets of another upstream unrelated kinase, they would be abbreviated MAP3KPP for example.
Now, of course, there are families of the MAPK cascade enzyme, each with its own name. Figure \(\PageIndex{31}\) shows the names of four different mammalian MAP3Ks leading to the activation of 5 different MAP2Ks which lead to the activation of 4 different MAPKs. Some of these enzymes are so widely discussed in textbooks and journal articles that it is good to remember them specifically with their alternative names. These include the MAP3K enzymes Raf (Rapidly Accelerated Fibrosarcoma) and MEK, and the MAPK enzymes ERK (Extracellular Related Kinase) and JNK (c-Jun N-terminal Kinase)
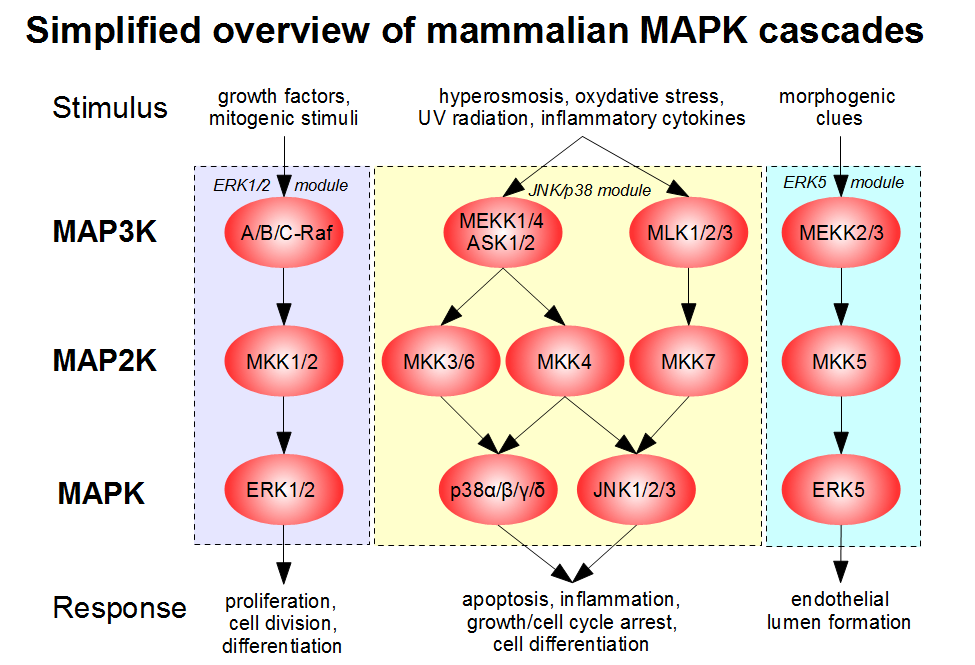
Figure \(\PageIndex{32}\) shows another representation of the MAPK cascade with some different enzyme names and added phosphates shown in circles.

Figure \(\PageIndex{32}\): Another representation of the MAPK cascade. Journal of Cardiovascular Development and Disease 6(3):27. 2019. 10.3390/jcdd6030027. CC BY 4.0
One way to organize a seminar on a complex topic is to use these 3 steps: tell your audience what you will tell them, tell them, and then tell them what you told them. Following that advice, we present in Figure \(\PageIndex{33}\) an integrated view of signaling, starting from the membrane and moving inward to three enzymes in the MAPK kinase cascade, RAF (a MAP3K), MEK (a MAP2K) and ERK (a MAPK). Upstream signaling to the MAPK cascade comes RTKs, GPCRs, and Ca2+ signaling, which we will discuss later.

The sequence of events is:
- binding of an external signal to membrane receptor and activation of receptor kinase
- phosphorylation of receptor kinase and interaction with an activator GTP binding protein such as Ras
- binding of activated G-protein to and activation of a mitogen-activated protein kinase kinase kinase (MAPKKK)
- MKKK phosphorylates and activates another kinase, MAPKK
- MKK phosphorylates and activates mitogen-activated protein kinase, MAPK
- MAPK phosphorylates inactive transcription factors (or other proteins) and activates them. Unfortunately (from a naming point of view) when the activated proteins are themselves protein kinases, they are called mitogen-activated protein kinase activated protein kinases (MAPKAPK)
There are seven types of MAPKs, four conventional and three atypical. Four typical ones are described in the table below.
| Activator GTP binding protein | Ras:GTP | |||
| MAPKKK or MAPK3 | Raf-1A/B c-Mos |
MEKK1-4 DLK MLK2 |
MEKK1-4 DLK MLK2 |
MEKK2/3 Tpl-2 |
| MAPKK or MAPK2 | MEK1,2 | MEK4,7 | MEK3,6 | MEK5 |
| MAPK or MAK | ERK1,2 | JNK1-3 | p38 | ERK5 |
| MAPKAPK | RSK 1-4 MNK2 MSK 1,2 |
MK2,3 | MSK1,2 MK2,3 |
RSK1-4 |
| An eventual Protein Target |
c-Jun | c-Jun |
![]() MAP Kinase System from Cell Signaling
MAP Kinase System from Cell Signaling
Structural, these proteins are similar in size and domain structure as we have seen for other kinases. Figure \(\PageIndex{34}\) shows an interactive iCn3D model of the alignment of MEK 1 (4U7Z) and ERK2 (5NHJ)
_and_ERK2_(5NHJ).png?revision=1&size=bestfit&width=354&height=254)
We now present multiple visual images of the activation of the MAPK cascade. Figure \(\PageIndex{35}\) shows two.
|
Details:
|

|
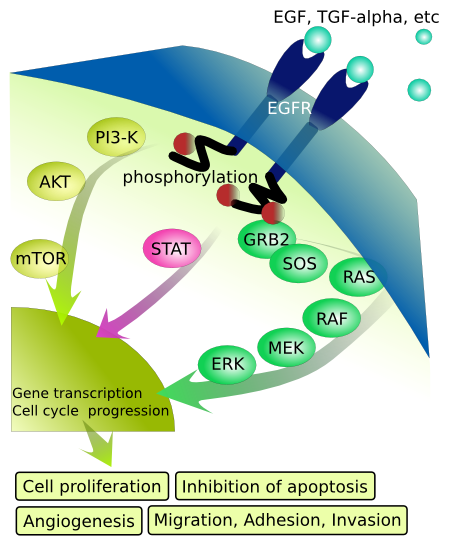
Figure \(\PageIndex{35}\): Two visual representations of the activation of the MAPK cascade through to activation of gene transcription.
As with protein kinase A and protein kinase C, signaling efficiency and specificity with minimal phosphorylation of wrong targets occurs when multiple signaling partners are scaffolded. This is also true of the MAPK cascade trio of the kinase. Figure \(\PageIndex{36}\) shows the role of scaffolds KSR and Ste5 in MAPK signaling.

Figure \(\PageIndex{36}\): The role of scaffolds KSR and Ste5 in MAPK signaling. (A) In quiescent cells, an inactive KSR/MEK complex exists in the cytosol. (B) Upon stimulation of the cell, KSR translocates to the cell membrane and forms an active complex with phosphorylated Raf, MEK, and ERK. Activated ERK detaches from the scaffold with three outcomes; (1) ERK dimerizes in the cytoplasm where the dimer remains or translocates to the nucleus; (2) ERK translocates to the nucleus; (3) KSR acts as a platform where ERK dimers are assembled and the new complex can interact with substrates in the cytoplasm. (C) Schematic of the yeast mating pheromone response pathway. Witzel et al. Front. Physiol., 21 December 2012 | https://doi.org/10.3389/fphys.2012.00475. Creative Commons Attribution License,
Computational Analyses - MAPK Cascade
You might think that the interconnected reactions of the MAPK cascade are complicated. However, as presented in the figures above, it only consists of 3 enzymes, MAPKKK (MAPK3 or MK3), MAPKK (MAPK2 or MK2), and MAPK. We added complexity by converting the actual enzymes from an inactive state to an active state by phosphorylation. In reality, this pathway is simple compared to the complete signal transduction pathways they are part of, and very simple compared to whole catabolic and anabolic pathways that we will see in Part Two of this book.
We have discussed kinetics in earlier chapters and have shown how it can be used to more fully understand an enzyme and its regulation/control. We need to extend such kinetic analyses to whole pathways as well. We can do that using the VCell. Let's look at two different models of the MAPK cascade using Vcell. One particularly interesting feature is the regulation of the pathway. We will see in the next section on metabolism that pathways are often regulated by the end product of the pathway. This makes sense since if that end product is abundant, it would make biological sense for that product to inhibit the first enzyme in the pathway to avoid making more of the ultimate end product. Of course, that inhibition would be relieved as the concentration of the end product falls. Hence there is a temporal sense to the inhibition.
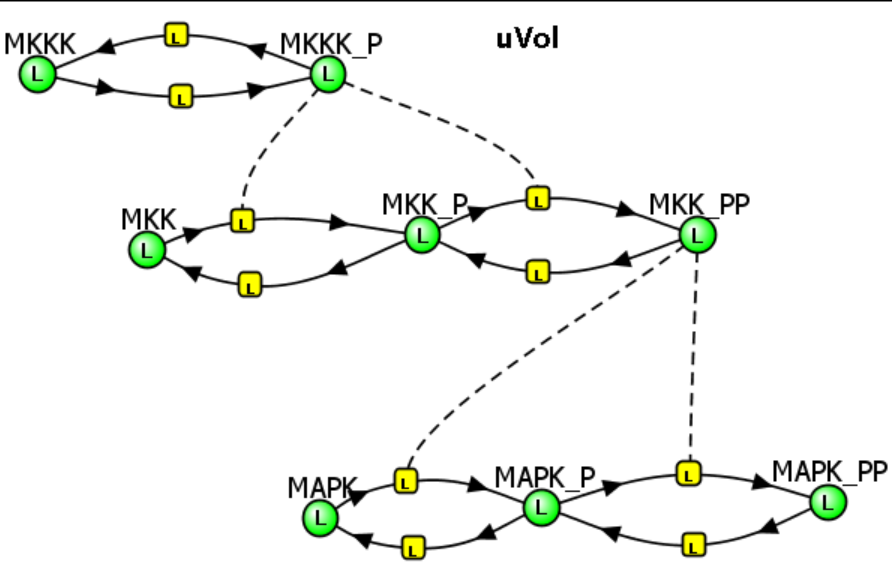
Let's look run two Vcell models for the MAPK Cascade, one with no end product inhibition and one with inhibition of the first step. Since we dealing with linked kinases, the inhibition of the first enzyme (MAP3K=MKKK) and hence the first reaction (MKKK ↔ MKKK_P) is not mediated by a chemical product of the last enzyme (MAPK_PP) but by phosphorylation of the first enzyme (MKKK) by the last (MAPK_PP).
MAPK Cascade - Model 1: No feedback inhibition of the MAPK cascade by inhibition of the first step (MKKK ↔MKKK_P) by the "end product" of the cascade (MAPK__PP) try quick
 MODEL
MODEL
MAPK Cascade - no feedback inhibition
Initial Condition - See simulation results
Select Load [model name] below
Select Plot to change Y axis min/max, then Reset and Play | Select Slider to change which constants are displayed. For this model, select Vm, Km, Ki and I | Select About for software information.
Move the sliders to change the constants and see changes in the displayed graph in real-time.
Time course model made using Virtual Cell (Vcell), The Center for Cell Analysis & Modeling, at UConn Health. Funded by NIH/NIGMS (R24 GM137787); Web simulation software (miniSidewinder) from Bartholomew Jardine and Herbert M. Sauro, University of Washington. Funded by NIH/NIGMS (RO1-GM123032-04)
The various concentration vs time curves in the output graph should make "intuitive" sense. There are no surprises!
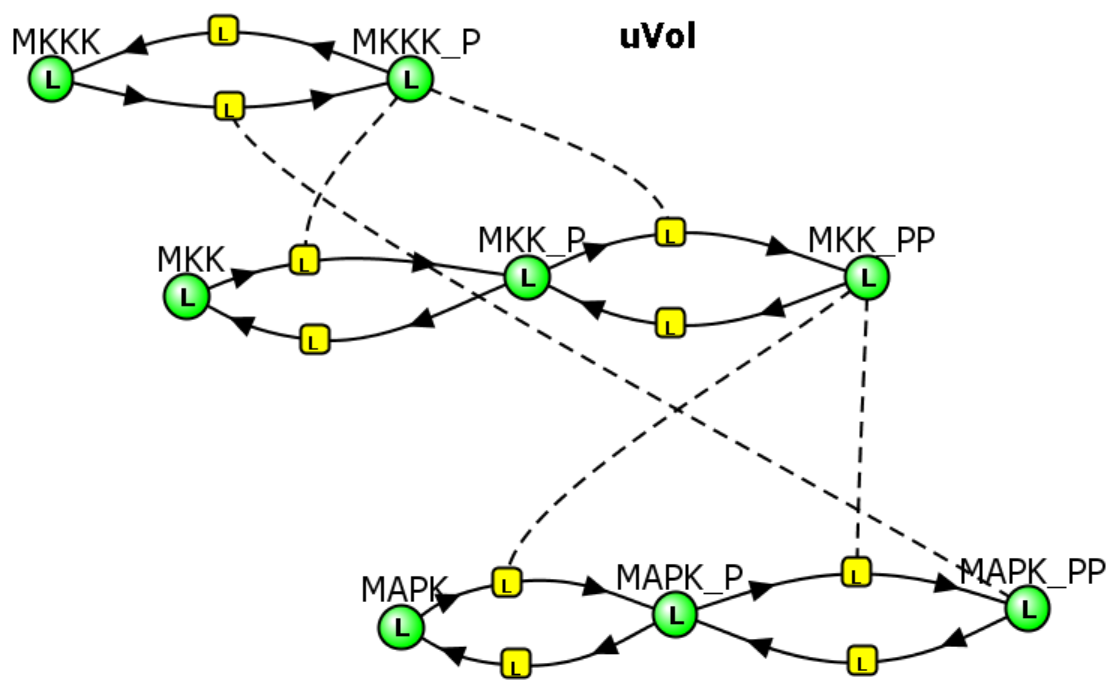
Now let's add a twist. What if the last active enzyme in the pathway, MAPK that is doubly phosphorylated (MAPK_PP), the "final product" of the cascade, can, in a feedback reaction, inhibit the very first reaction of the cascade, MKKK → MKKK_P through an inhibiting phosphorylation. Run the simulation in Vcell to find out!
MODEL
MAPK Cascade - With feedback inhibition
Initial Conditions: See simulation results
Select Load [model name] below
Select Plot to change Y axis min/max, then Reset and Play | Select Slider to change which constants are displayed. For this model, select Vm, Km, Ki and I | Select About for software information.
Move the sliders to change the constants and see changes in the displayed graph in real-time.
Time course model made using Virtual Cell (Vcell), The Center for Cell Analysis & Modeling, at UConn Health. Funded by NIH/NIGMS (R24 GM137787); Web simulation software (miniSidewinder) from Bartholomew Jardine and Herbert M. Sauro, University of Washington. Funded by NIH/NIGMS (RO1-GM123032-04)
The various concentration vs time curves in the output graph should make "intuitive" sense. There are no surprises!
Now let's add a twist. What if the last active enzyme in the pathway, MAPK that is doubly phosphorylated (MAPK_PP), the "final product" of the cascade, can, in a feedback reaction, inhibit the very first reaction of the cascade, MKKK → MKKK_P through an inhibiting phosphorylation. Run the simulation in Vcell to find out!
MAPK Cascade - Model 2: Feedback inhibition of the MAPK cascade by inhibition of the first step (MKKK ↔MKKK_P) by the "end product" of the cascade (MAPK__PP)
Kholodenko2000 - Ultrasensitivity and negative feedback bring oscillations in the MAPK cascade. https://www.ebi.ac.uk/biomodels/BIOMD0000000010. Based on Kholodenko BN. Negative feedback and ultrasensitivity can bring about oscillations in the mitogen-activated protein kinase cascades. Eur J Biochem. 2000 Mar;267(6):1583-8. doi: 10.1046/j.1432-1327.2000.01197.x. PMID: 10712587.
There is utterly no way to have predicted, using intuition or simple mathematical analyses, the oscillatory changes in the concentration of all the enzymes and their phosphorylated variants. Of course, the oscillating concentrations depend on the chosen initial concentrations and on the rate constants.
When enzymes are linked sequentially in signal transduction pathways, their actions are amplified by the preceding enzyme. If the first kinase (MK3) activates a 1000 molecules of the second kinase (MK2), and each of these activates 1000 of the last kinase (MAPK), the net effect of activating the first kinase is a million-fold amplification of the last! This causes this three-kinase pathway to be ultrasensitive to small changes to the first enzyme. Add other activating and inhibiting agents and the net activities of the pathway components become even more complicated.
Just the simple feedback inhibition by the last enzyme of the first enzyme in this cascade can bring about the oscillation shown in Vcell model 2. Depending on the concentrations and rate constants used in the model, the oscillations can last from minutes to hours. These oscillations can produce waves of phosphoproteins that propagate through the cytoplasm of the cell.
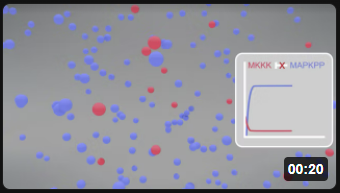
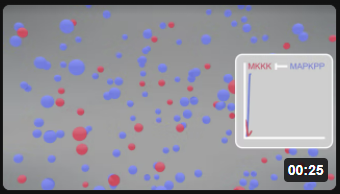
Here is a simplified animation of the MAPK cascade that shows changes in MKKK (red dots) and MAPK_PP) blue dots with no feedback inhibition (left, Model 1) and feedback inhibition (right, Model 2) in the cascade. (Animations produced by Shraddha Nayak and Hui Lui.)
| Model 1: No feedback inhibition of the MAPK cascade | Model 2: Feedback inhibition of the MAPK cascade |
 |
 |
You might expect similar oscillatory behavior in proteins (cyclins and cyclin-dependent protein kinases) controlling the movement of cells through the cell cycle. We will see that in a subsequent section.