
Biology LibreTexts

28.5: Small G proteins, GAPs and GEFs

  • Page ID
    77358
  • \( \newcommand{\vecs}[1]{\overset { \scriptstyle \rightharpoonup} {\mathbf{#1}} } \)

    \( \newcommand{\vecd}[1]{\overset{-\!-\!\rightharpoonup}{\vphantom{a}\smash {#1}}} \)

    \( \newcommand{\dsum}{\displaystyle\sum\limits} \)

    \( \newcommand{\dint}{\displaystyle\int\limits} \)

    \( \newcommand{\dlim}{\displaystyle\lim\limits} \)

    \( \newcommand{\id}{\mathrm{id}}\) \( \newcommand{\Span}{\mathrm{span}}\)

    ( \newcommand{\kernel}{\mathrm{null}\,}\) \( \newcommand{\range}{\mathrm{range}\,}\)

    \( \newcommand{\RealPart}{\mathrm{Re}}\) \( \newcommand{\ImaginaryPart}{\mathrm{Im}}\)

    \( \newcommand{\Argument}{\mathrm{Arg}}\) \( \newcommand{\norm}[1]{\| #1 \|}\)

    \( \newcommand{\inner}[2]{\langle #1, #2 \rangle}\)

    \( \newcommand{\Span}{\mathrm{span}}\)

    \( \newcommand{\id}{\mathrm{id}}\)

    \( \newcommand{\Span}{\mathrm{span}}\)

    \( \newcommand{\kernel}{\mathrm{null}\,}\)

    \( \newcommand{\range}{\mathrm{range}\,}\)

    \( \newcommand{\RealPart}{\mathrm{Re}}\)

    \( \newcommand{\ImaginaryPart}{\mathrm{Im}}\)

    \( \newcommand{\Argument}{\mathrm{Arg}}\)

    \( \newcommand{\norm}[1]{\| #1 \|}\)

    \( \newcommand{\inner}[2]{\langle #1, #2 \rangle}\)

    \( \newcommand{\Span}{\mathrm{span}}\) \( \newcommand{\AA}{\unicode[.8,0]{x212B}}\)

    \( \newcommand{\vectorA}[1]{\vec{#1}}      % arrow\)

    \( \newcommand{\vectorAt}[1]{\vec{\text{#1}}}      % arrow\)

    \( \newcommand{\vectorB}[1]{\overset { \scriptstyle \rightharpoonup} {\mathbf{#1}} } \)

    \( \newcommand{\vectorC}[1]{\textbf{#1}} \)

    \( \newcommand{\vectorD}[1]{\overrightarrow{#1}} \)

    \( \newcommand{\vectorDt}[1]{\overrightarrow{\text{#1}}} \)

    \( \newcommand{\vectE}[1]{\overset{-\!-\!\rightharpoonup}{\vphantom{a}\smash{\mathbf {#1}}}} \)

    \( \newcommand{\vecs}[1]{\overset { \scriptstyle \rightharpoonup} {\mathbf{#1}} } \)

    \(\newcommand{\longvect}{\overrightarrow}\)

    \( \newcommand{\vecd}[1]{\overset{-\!-\!\rightharpoonup}{\vphantom{a}\smash {#1}}} \)

    \(\newcommand{\avec}{\mathbf a}\) \(\newcommand{\bvec}{\mathbf b}\) \(\newcommand{\cvec}{\mathbf c}\) \(\newcommand{\dvec}{\mathbf d}\) \(\newcommand{\dtil}{\widetilde{\mathbf d}}\) \(\newcommand{\evec}{\mathbf e}\) \(\newcommand{\fvec}{\mathbf f}\) \(\newcommand{\nvec}{\mathbf n}\) \(\newcommand{\pvec}{\mathbf p}\) \(\newcommand{\qvec}{\mathbf q}\) \(\newcommand{\svec}{\mathbf s}\) \(\newcommand{\tvec}{\mathbf t}\) \(\newcommand{\uvec}{\mathbf u}\) \(\newcommand{\vvec}{\mathbf v}\) \(\newcommand{\wvec}{\mathbf w}\) \(\newcommand{\xvec}{\mathbf x}\) \(\newcommand{\yvec}{\mathbf y}\) \(\newcommand{\zvec}{\mathbf z}\) \(\newcommand{\rvec}{\mathbf r}\) \(\newcommand{\mvec}{\mathbf m}\) \(\newcommand{\zerovec}{\mathbf 0}\) \(\newcommand{\onevec}{\mathbf 1}\) \(\newcommand{\real}{\mathbb R}\) \(\newcommand{\twovec}[2]{\left[\begin{array}{r}#1 \\ #2 \end{array}\right]}\) \(\newcommand{\ctwovec}[2]{\left[\begin{array}{c}#1 \\ #2 \end{array}\right]}\) \(\newcommand{\threevec}[3]{\left[\begin{array}{r}#1 \\ #2 \\ #3 \end{array}\right]}\) \(\newcommand{\cthreevec}[3]{\left[\begin{array}{c}#1 \\ #2 \\ #3 \end{array}\right]}\) \(\newcommand{\fourvec}[4]{\left[\begin{array}{r}#1 \\ #2 \\ #3 \\ #4 \end{array}\right]}\) \(\newcommand{\cfourvec}[4]{\left[\begin{array}{c}#1 \\ #2 \\ #3 \\ #4 \end{array}\right]}\) \(\newcommand{\fivevec}[5]{\left[\begin{array}{r}#1 \\ #2 \\ #3 \\ #4 \\ #5 \\ \end{array}\right]}\) \(\newcommand{\cfivevec}[5]{\left[\begin{array}{c}#1 \\ #2 \\ #3 \\ #4 \\ #5 \\ \end{array}\right]}\) \(\newcommand{\mattwo}[4]{\left[\begin{array}{rr}#1 \amp #2 \\ #3 \amp #4 \\ \end{array}\right]}\) \(\newcommand{\laspan}[1]{\text{Span}\{#1\}}\) \(\newcommand{\bcal}{\cal B}\) \(\newcommand{\ccal}{\cal C}\) \(\newcommand{\scal}{\cal S}\) \(\newcommand{\wcal}{\cal W}\) \(\newcommand{\ecal}{\cal E}\) \(\newcommand{\coords}[2]{\left\{#1\right\}_{#2}}\) \(\newcommand{\gray}[1]{\color{gray}{#1}}\) \(\newcommand{\lgray}[1]{\color{lightgray}{#1}}\) \(\newcommand{\rank}{\operatorname{rank}}\) \(\newcommand{\row}{\text{Row}}\) \(\newcommand{\col}{\text{Col}}\) \(\renewcommand{\row}{\text{Row}}\) \(\newcommand{\nul}{\text{Nul}}\) \(\newcommand{\var}{\text{Var}}\) \(\newcommand{\corr}{\text{corr}}\) \(\newcommand{\len}[1]{\left|#1\right|}\) \(\newcommand{\bbar}{\overline{\bvec}}\) \(\newcommand{\bhat}{\widehat{\bvec}}\) \(\newcommand{\bperp}{\bvec^\perp}\) \(\newcommand{\xhat}{\widehat{\xvec}}\) \(\newcommand{\vhat}{\widehat{\vvec}}\) \(\newcommand{\uhat}{\widehat{\uvec}}\) \(\newcommand{\what}{\widehat{\wvec}}\) \(\newcommand{\Sighat}{\widehat{\Sigma}}\) \(\newcommand{\lt}{<}\) \(\newcommand{\gt}{>}\) \(\newcommand{\amp}{&}\) \(\definecolor{fillinmathshade}{gray}{0.9}\)

    Search Fundamentals of Biochemistry


    Learning Goals 

    Small G Protein Structure, the GTPase Cycle, and Oncogenic Mutations

    • Describe the structural basis of the Ras GTPase cycle: explain how the conserved 20 kDa GTPase domain contains five G-elements (G1/P-loop coordinates phosphates, G2/Switch I and G3/Switch II are flexible loops that sandwich the nucleotide, G4 and G5 recognize the guanine base), how GTP binding induces conformational changes particularly in Switch I and II that create the active RasON state, and how intrinsic GTP hydrolysis through a pentavalent transition state restores the inactive RasOFF:GDP state—and explain why Ras is a poor GTPase, making GAP assistance essential for normal signal termination.
    • Explain the molecular basis of oncogenic Ras mutations and their therapeutic targeting: describe how missense mutations at G12 (G12C, G12S, G12V), G13 (G13D), or Q61 (Q61H) in the P-loop and Switch II dramatically reduce GTPase activity, locking Ras in the constitutively active RasON state and driving unregulated proliferation in ~20% of human cancers (with KRAS mutated in ~75% of Ras-mutant tumors); contrast the covalent inhibitor sotorasib/AMG 510 (which exploits the unique G12C nucleophilic cysteine to irreversibly occupy the Switch II pocket) with the novel molecular glue daraxonrasib (RMC-6236), which noncovalently recruits cyclophilin A (CypA) to create a neomorphic surface that competitively occupies the conserved SWI/SWII effector-binding lobe of RasON, inhibiting all major oncogenic Ras variants including wild-type.

    GAPs and GEFs: Regulation of Nucleotide Exchange and GTPase Activity

    • Explain the mechanism by which GTPase-activating proteins (GAPs) accelerate Ras GTP hydrolysis: describe how the intrinsically poor Ras GTPase is dramatically accelerated by GAP insertion of an arginine finger (Arg789 in RasGAP, analogous to Arg178 in Gαi) into the active site to stabilize the developing negative charge in the pentavalent transition state for GTP hydrolysis—and explain why this mechanism means that oncogenic mutations at G12/G13 (which sterically block arginine finger insertion) or Q61 (which positions the catalytic water) render Ras insensitive to GAP-mediated GTP hydrolysis and thus constitutively active.
    • Describe the mechanism by which guanine nucleotide exchange factors (GEFs) activate Ras: explain why GDP dissociation from Ras is normally extremely slow (koff ~10⁻⁵ s⁻¹, KD ~0.1 pM, half-life ~0.8 days), how the GEF SOS inserts an α-helix to displace Switch I and induce conformational changes in Switch II that open the nucleotide-binding site, dramatically increasing the GDP off-rate—and explain why GTP preferentially replaces GDP upon SOS-mediated nucleotide release (higher cellular GTP:GDP ratio) and how GRB2 (an SH2/SH3 adaptor with no enzymatic activity) recruits cytoplasmic SOS to the membrane-associated phospho-EGFR in response to EGF signaling.

    Membrane Targeting, Downstream Signaling, and the Ras Superfamily

    • Explain how lipid modifications target Ras to specific cellular membranes and regulate its signaling geography: describe how farnesylation (Cys186) and palmitoylation (Cys180 in K-Ras4A; different cysteines in H-Ras and N-Ras) of the C-terminal CAAX motif and hypervariable region direct distinct Ras isoforms to the plasma membrane, Golgi, endoplasmic reticulum, and mitochondria—and explain how PKC phosphorylation of KRas at Ser181 lowers the polybasic region's positive charge to redirect KRas to mitochondria where it inhibits anti-apoptotic Bcl-XL, while SRC-mediated phosphorylation of Tyr32/Tyr64 inhibits Ras by blocking RAF binding and promoting GAP association.
    • Describe the mechanism by which active Ras recruits and activates RAF1 kinase: explain how RasON binds the RAF1 Ras-binding domain (RBD) and how the adjacent cysteine-rich domain (CRD) inserts loop regions into the membrane bilayer, relieving 14-3-3-mediated autoinhibition; how the resulting conformational change in RAF1 enables its dimerization with BRAF (also bound to an adjacent membrane-associated Ras) to produce an active MAPK kinase signaling complex; and describe how Ras forms nanoclusters of 6–8 molecules at the membrane to amplify signaling—and contrast this with Ras-mediated prolongation of PI3Kα activity at the membrane (where Ras does not allosterically activate PI3Kα but instead stabilizes its active membrane-associated state).
    • Describe the diversity of the Ras superfamily and the functional significance of having more GAPs and GEFs than G proteins: identify the five major subfamilies (Ras for proliferation/survival, Rho for cytoskeleton/cell movement, Rab and Arf for vesicle trafficking, Ran for nuclear-cytoplasmic transport) and explain why the ~80 GEFs and ~70 GAPs for the 20 Rho family members (more regulators than substrates) provide the cell with exquisite spatial and temporal control over specific G protein activities in response to diverse cellular signals.

    G Proteins: Cellular Switch for Kinases

    In the preceding chapter sections, we discussed two types of small G proteins, Gα, part of the heterotrimeric Gαβγ complex linked to GPCR signaling, and Ras (H, K, and N). Both bind GTP and GDP and have GTPase activity. When bound to GTP, they are active, while the GDP-bound form is inactive. They have intrinsic GTPase activity, so eventually, active Ras will deactivate itself. What a perfect molecular switch to regulate signaling with this built-in off switch (the GTPase activity)! It turns out, however, that this simple on/off switch is too simple. For example, a single mutation that inhibits GTPase activity would leave the protein continuously active, which could (and does) lead to unregulated growth and tumor formation.  In addition, they are poor GTPases 

    To help with regulation, a new set of proteins called GAPs and GEFs modulate the balance of bound GTP (which activates the protein) and GDP (which inactivates the protein) in small G proteins. These are found abundantly in cells:

    • GTPase-activating protein or GAPs: As the name implies, they enhance the intrinsic GTPase activity of the small G proteins, which would decrease G protein signaling.
    • Guanine nucleotide exchange proteins or GEFs: These lead to the dissociation of bound GDP and its replacement with GTP, which would increase G protein signaling.

    Additionally, Ras is also regulated by altering its cellular location.  It is targeted to cell and organelle membranes through the post-translational addition of hydrophobic farnesyl and palmitoyl groups. At the membrane, and upon GTP binding, active Ras can bind to and activate numerous proteins, most of which are protein kinases. Ras is just one member of a large superfamily of small G proteins, all of which have GTPase activity.   

    Small G proteins

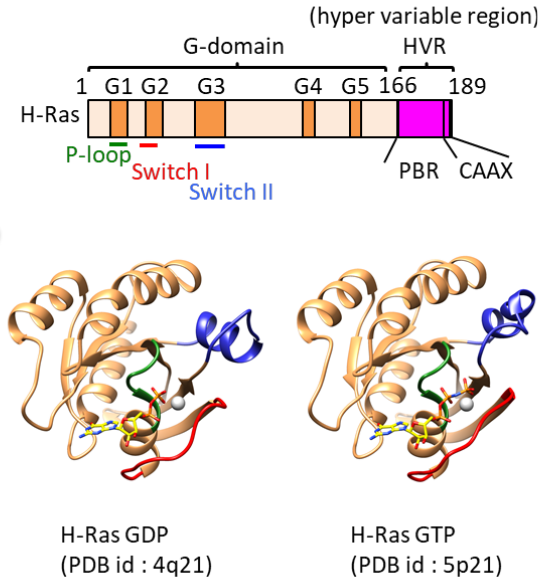
    Small G proteins in the superfamily share a common 20 kDa molecular weight catalytic (GTPase) domain, comprising five alpha helices, six beta strands, and connecting loops. Figure \(\PageIndex{1}\) shows the domain structures of the small G protein called H-Ras as an example.

    Diagram shows a protein structure with labeled regions: P-loop, Switch I, and Switch II, and stereo views of the protein's conformation.
    Figure \(\PageIndex{1}\): Domain Structure of small G proteins. Toma-Fukai et al. Molecules 2019, 24, 3308; doi:10.3390/molecules24183308. Creative Commons Attribution (CC BY) license (http://creativecommons.org/licenses/by/4.0/).

    G boxes of the guanine (G)-binding domain are highlighted in orange. The P-loop, switch I, and switch II are colored green, red, and blue, respectively.

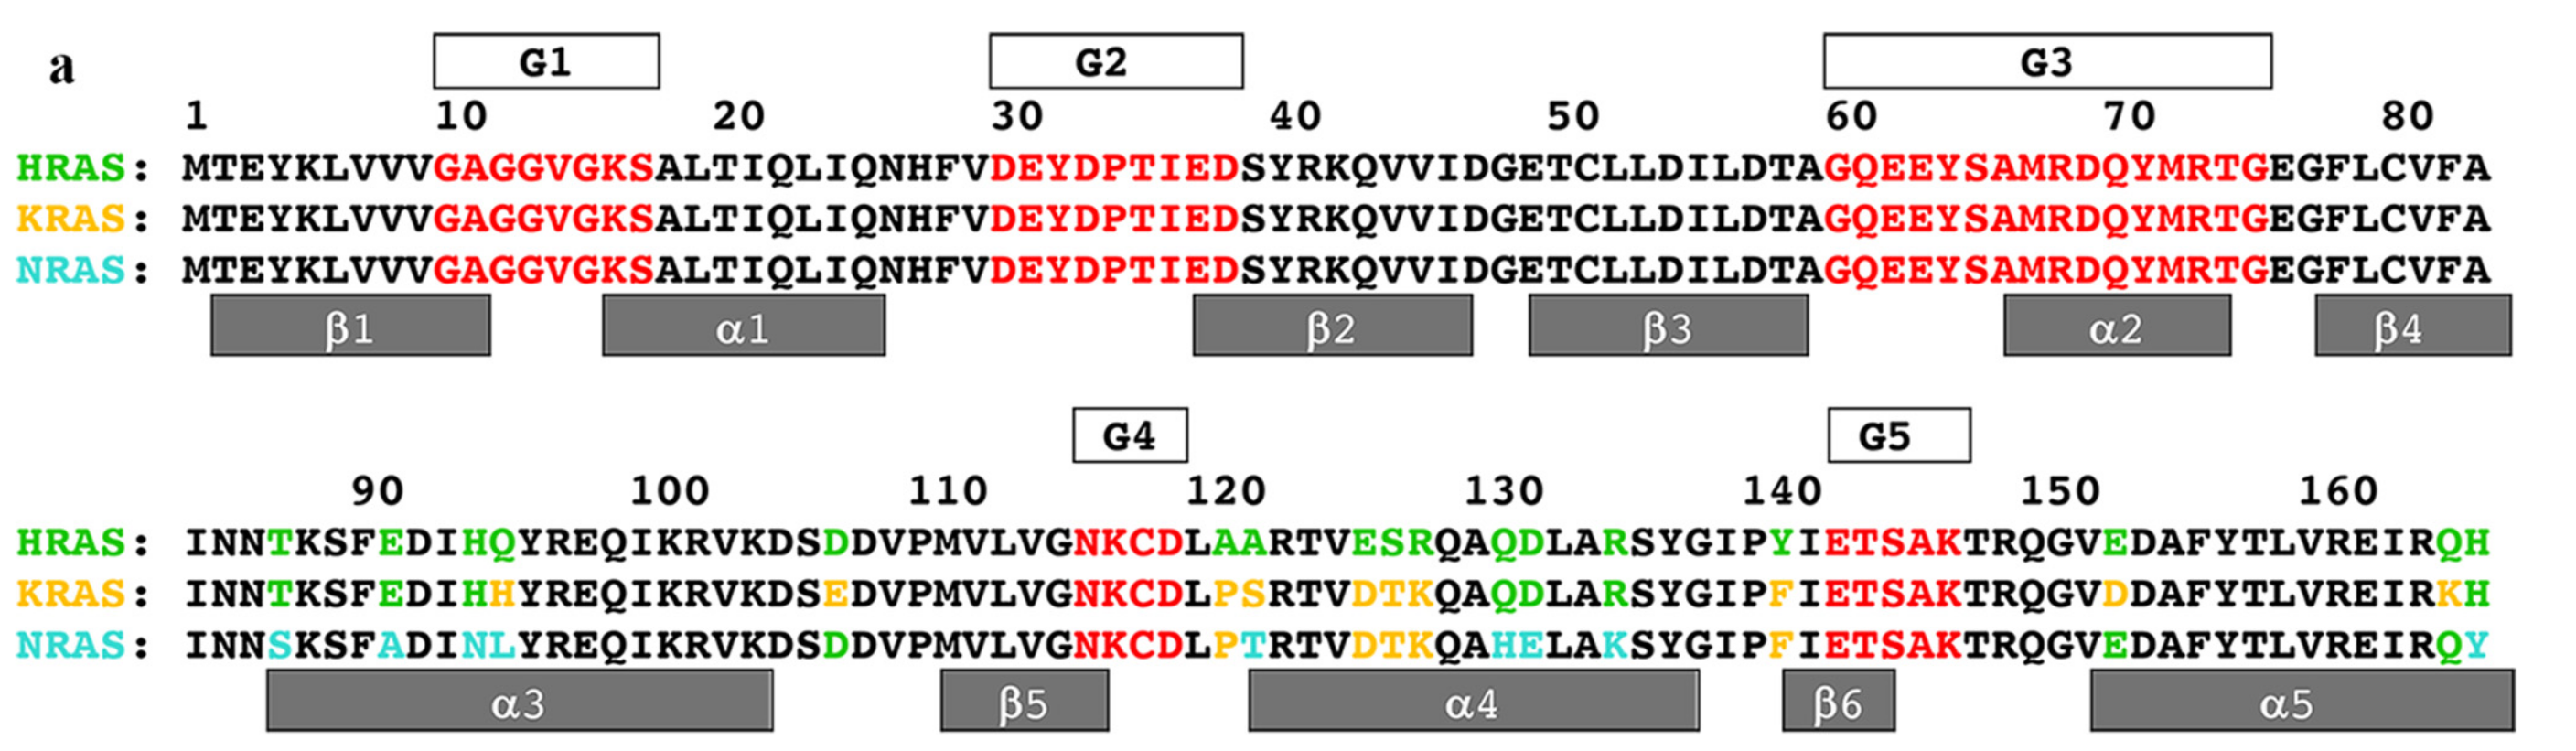
    Let's describe Ras in more detail.  Mammalian cells contain three variants of Ras, H-, N-, and K-, encoded by four genes:  HRAS, NRAS, KRAS4A, and KRAS4B. The two KRas forms arise from alternative splicing. They all bind GDP/GTP and have intrinsic, albeit weak, GTPase activity.  Their amino acid sequences (minus the C terminal 20+ amino acids) are shown below in Figure \(\PageIndex{2}\).
    The small GTPases K-Ras, N-Ras, and H-Ras have distinct biochemical properties determined by allosteric effectsFig3B.svg

    Figure \(\PageIndex{2}\):  Christian W. Johnson, Derion Reid, Jillian A. Parker, Shores Salter, Ryan Knihtila, Petr Kuzmic, Carla Mattos. The small GTPases K-Ras, N-Ras, and H-Ras have distinct biochemical properties determined by allosteric effects. Journal of Biological Chemistry, 292, 2017, 12981-12993.  ISSN 0021-9258, https://doi.org/10.1074/jbc.M117.778886.  https://creativecommons.org/licenses/by/4.0/

    Black denotes identical amino acids.  Green amino acids in HRas (top row) show differences in at least one of the Ras proteins (isoforms).  If the amino acid in HRas (top row) is the same in NRas, it is also shown in green in NRas (bottom row).  Amino acids in NRas (bottom row) that are the same as KRas (above it) are shown in yellow.  Unique amino acids in NRas (bottom row) are shown in cyan

    The five G "elements" (G1-G5) in the guanine-binding G domain, found in all GTPases, are shown in red. G1 is the P-loop, G2 is switch I, and G3 is switch II. G4 and G5 are important in binding the guanine base.  These last G elements probably confer subtle allosteric changes in the structure that account for small differences in catalytic rates of GTP hydrolysis. Changing Lys117 or Asp119 in the G4 domain decreases the affinity for guanine ligands and promotes dissociation. 

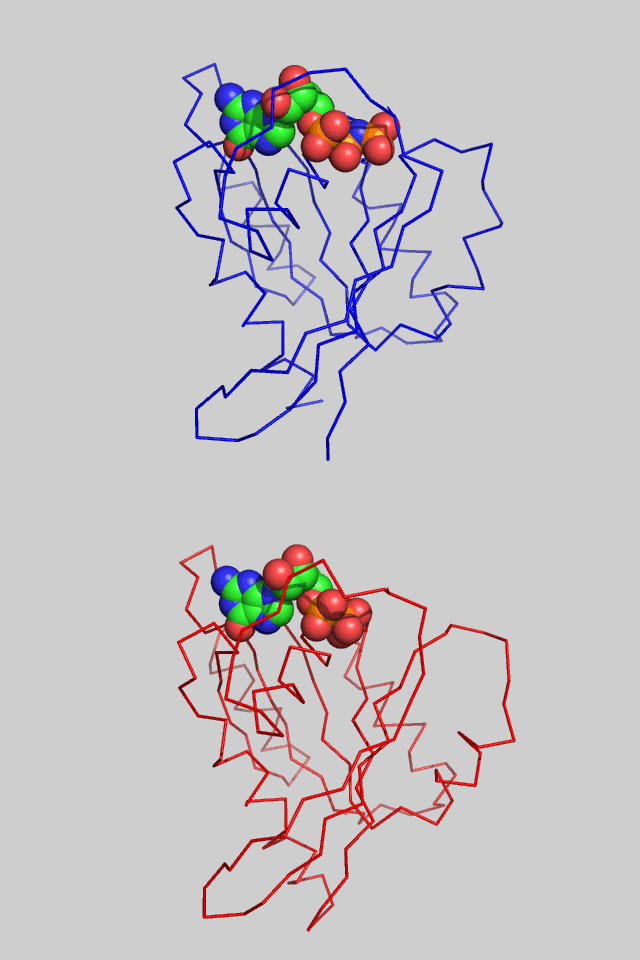
    Figure \(\PageIndex{3}\) is an animation illustrating the structural differences between the active GTP-bound form (RasON, blue, PDB ID 5P21) and the inactive GDP form (RasOFF,red, PDB ID 4Q21) of the H-Ras protein. One helix and nearby loops are perturbed, especially Switch I.

    3D molecular structure of a protein, with colored atoms representing different elements and a blue wireframe backbone.
    Figure \(\PageIndex{3}\): Structural differences between the GTP-bound form (all in blue, pdb id 5p21) and GDP form (all in red, pdb id 4q21) of Ras

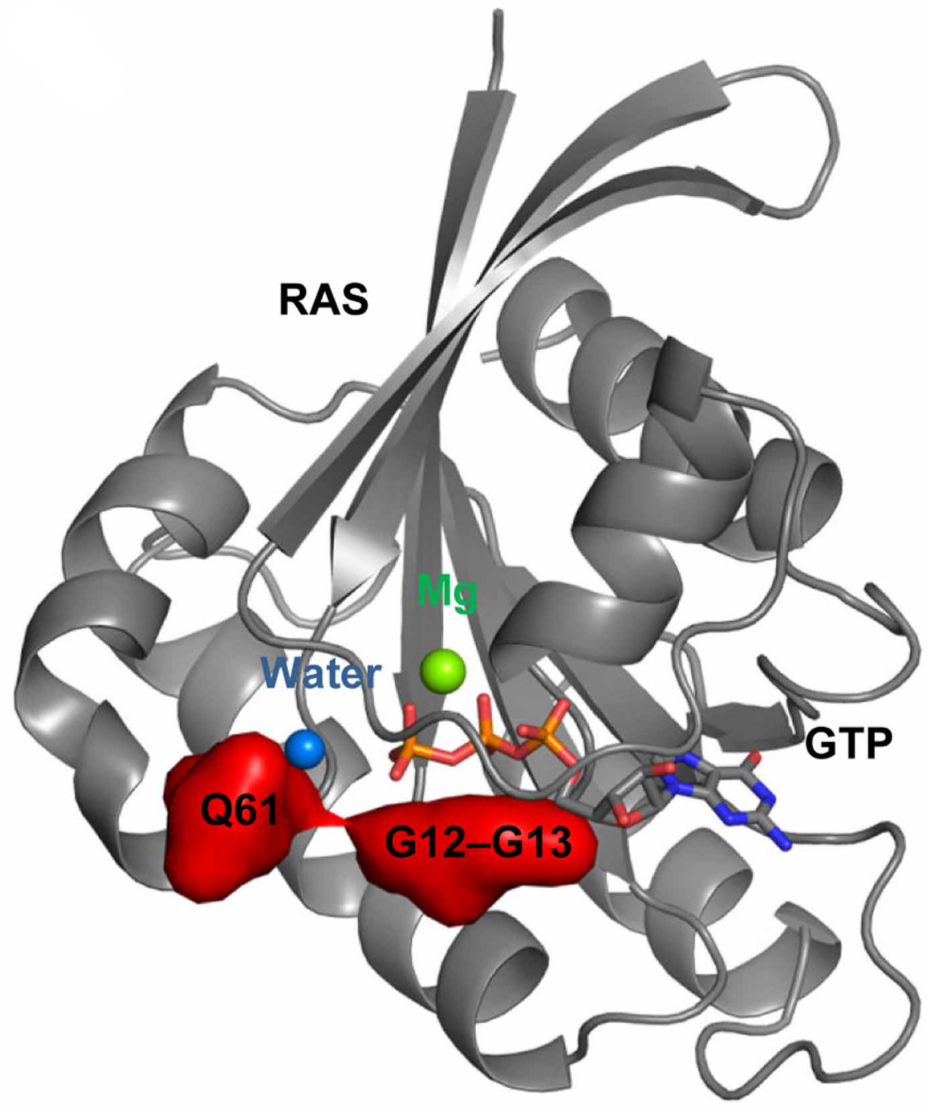
    Mutations at G1 (the P-loop) at amino acid G12 (G12C, G12S or G12V) and G13 (G13D), or in G3 (Switch II) at amino acid Q61 (Q61H) cause a large decrease in the GTPase activity of the protein, so they are continually in the "on" (constitutively-active) state, contributing to tumor formation.  In mammals, these are the most common mutations found in tumors.  Ras genes are mutated in around 20% of human cancers. About 75% of cancer patients with Ras mutations have mutated KRas, while only 7% have mutated HRas. Ras gene mutations vary by tumor type. The activity of Ras isoforms is often regulated by GTPase-activating proteins (GAPs) and guanine nucleotide exchange factors (GEFs).  Figure \(\PageIndex{4}\) shows the locations of the mutations associated with tumorigenesis. 
    3D protein structure of RAS showing GTP, magnesium (Mg), water, and key residues Q61 and G12-G13 highlighted.

    Figure \(\PageIndex{4}\): Oncogenic mutation hot spots (red surfaces) highlighted in the GTP-bound RAS structure (gray cartoon, PDB 1QRA)..  Kolch W, Berta D, Rosta E. Dynamic regulation of RAS and RAS signaling. Biochem J. 2023 Jan 13;480(1):1-23. doi: 10.1042/BCJ20220234. PMID: 36607281; PMCID: PMC9988006. Creative Commons Attribution License 4.0 (CC BY).

    Mutations (K117N, K117R, and K147R) in the G4 and G5 domains can also be oncogenic, not by decreasing the intrinsic GTPase activity but by lowering the affinity for G-nucleotides.  This would increase the fractional saturation with GTP, which is more abundant in cells than GDP.

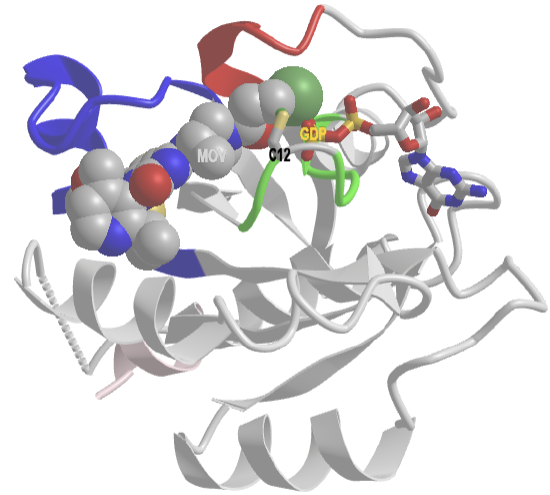
    Figure \(\PageIndex{5}\) shows an interactive iCn3D model of human KRAS G12C mutant covalently bound to AMG 510, a covalent inhibitor (6OIM). This mutation activates the Ras switch, keeping it permanently on.

    3D molecular structure of a protein, showing various colored chains and spheres representing atoms.


    Figure \(\PageIndex{5}\): Human KRAS G12C covalently bound to AMG 510 (6OIM). (Copyright; author via source). Click the image for a popup or use this external link: https://structure.ncbi.nlm.nih.gov/i...Rx2ksMNmeCB7t6

    The coloring coding is the same as in Figure 1 above:

    • P-Loop (same as G1) is green, which is important for binding the phosphates in GTP/GDP;    
    • Switch 1 (30-40) is red and contains the invariant residue Thr 35;
    • Switch 2 (60-76) is blue;  Switch 1 and 2 are flexible loops that help sandwich GTP/GDP; 
    • The truncated C-terminal of the protein is shown in light pink (the end is very disordered, so these amino acids do not have clear electron density and are not found in the final crystal structure).

    GDP is shown in colored sticks.  The covalent inhibitor, AMG 510, is shown in spacefill and labeled MOV. It is covalently attached to Cys 12 in the mutated version.

    The G12C human KRas mutation is found in about 13% of patients with non-small cell lung cancer (NSCLC), which is any epithelial lung cancer that is not small cell lung cancer.  NSCLCs include squamous cell carcinoma, large cell carcinoma, and adenocarcinoma.  Before the discovery of AMG 510, Ras was considered "undruggable" because it lacked obvious pockets for drug inhibitors.  The G12C mutation replaces glycine with cysteine, a potent nucleophile that can react with the covalent inhibitor, thereby inhibiting the constitutively active protein.  A new generation of inhibitors aims to modify various aspects of Ras activity, including its membrane localization, binding to different effectors, and nucleotide exchange.


    Recent Updates:  May 26, 2026 

    IconNewFindings2ChatGPT Image Jan 9, 2026, 07_01_06 AMPS3_3inWid.pngDiscovery of Daraxonrasib (RMC-6236) ...... James Cregg, Anne V. Edwards, Stephanie Chang, et al.,  J. Med. Chem. 2025, 68, 6, 6064–6083.  https://doi.org/10.1021/acs.jmedchem.4c02314

    Recently, a new chemotherapeutic drug, daraxonrasib (RMC-6236), which can be taken orally, has been developed that appears to extend the life of people with advanced pancreatic cancer, for which most therapies are ineffective.  This new drug targets the Ras pathway by inhibiting only the active form of Ras (Ras:GTP or RasON).  As described above, Ras was considered "undruggable" because it has no significant, unique pockets to target. Instead of binding Ras, daraxonrasib binds another protein, cyclophilin A (CypA), a peptidyl-prolyl isomerase, which acts as a molecular chaperone for protein folding.  CypA does not bind to isolated RasON, but it does in the presence of daraxonrasib.  Effectively, daraxonrasib acts as a "molecular (noncovalent) glue," attaching (noncovalently) RasON to CypA and thereby inhibiting downstream signaling targets of Ras.  The following summary of the article draws on prior learning about enzyme inhibition, binding, and thermodynamics to provide a deeper understanding of the new and potentially revolutionary step in drug design.

    For a greater understanding of Daraxonrasib ...

    Click the link below!

    Answer

    First, here is the structure of the drug, a "decorated" version of the natural product Sanglifeherin A (Figure \(\PageIndex{6}\)).

    Daraxonrasib (RMC-6236).svg

    daraxonrsib.png

    Click the image for a popup or use this external link: External Link:  https://www.ncbi.nlm.nih.gov/Structu...accfdcc6c7204c 

    Now let's look at the structure of the ternary complex of KRas(ON), daraxonrasib, and CypA to see how the inhibitor works.   Figure \(\PageIndex{7}\) shows an interactive iCn3D model of the noncovalent interactions of the human wild-type KRas (ON) complex with cyclophilin A (CypA) and the noncovalent drug Daraxonrasib (RMC-6236) (9BG9).  KRas is in the active (ON) state and is bound to a GTP analog, GNP, with a nonhydrolyzable imido bridge connecting the last phosphate.

    Human wildtype KRas complex with cyclophilin and the noncovalent drug Daraxonrasib (RMC-6236) (9BG9).png

    Figure \(\PageIndex{7}\): Interactions of human wildtype KRasON complex with cyclophilin A (CypA) and the noncovalent drug Daraxonrasib (RMC-6236) (9BG9). (Copyright; author via source). Click the image for a popup or use this external link:https://www.ncbi.nlm.nih.gov/Structu...ab7c7e3d3a2367 

    Wild-type human KRasON is shown in cyan, with bound Mg2+ and GNP shown as spheres and sticks. Peptidyl-prolyl isomerase (cyclophilin) is in gray.  The noncovalent inhibitor Daraxonrasib is shown as sticks and labeled A1AHB.  Noncovalent interactions (except for close-contact nonpolar ones) of the drug with both protein chains are shown as labeled sticks. Note that there is only one interaction between the KRas and Daraxonrasib, a pi-pi stacking interaction between Y64 and the drug. 

    There are, however, many more close-contact nonpolar interactions between KRasON and Daraxonrasib in the ternary complex. Figure \(\PageIndex{8}\) shows an interactive iCn3D model of these interactions of CypA-bound wildtype KRas with the Daraxonrasib (9BG9).

    Nonpolar interactions of human wildtype KRas bound to CPA with the Daraxonrasib (9BG9).png

    Figure \(\PageIndex{8}\): Nonpolar interactions of human wildtype KRas bound to CypA with the Daraxonrasib (9BG9). (Copyright; author via source). Click the image for a popup or use this external link: https://www.ncbi.nlm.nih.gov/Structu...21c62dc1de3b88.

    The Peptidyl-prolyl isomerase (cyclophilin) chain is not shown.  The dotted lines represent the close contact (nonpolar interactions, excluding the π-π ring stacking) between the inhibitor and KRas.

    It might seem crazy to produce a drug that binds tightly to a non-Ras protein (CypA) and that doesn't bind to Ras at all in the absence of CypA to develop an inhibitor of Ras.  However, because of the lack of obvious drug pockets on Ras, the idea was to create a new surface (neomorphic) that somewhat resembles the surface of downstream proteins that recognize RasON (the GTP-bound form of Ras). When presented with that neomorphic surface, RasON could bind to either it or a natural downstream protein signaling partner  

    The investigators chose the protein CypA to create a new binding surface for RasON for the following reasons:

    CypA is abundant and widely expressed, even in tumor cells CypA alone has no affinity for Ras in the absence of conformational changes driven by ligand binding, so normal activities of CypA are unaffected in the absence of the drug. CypA binds to a natural product (Sanglifeherin A) and alters its shape Sanglifeherin A can be converted using classical structure-activity relationships (SARs) to produce a new drug, in this case Daraxonrasib, that binds CypA and, through conformational changes, creates a new neomorphic surface that selectively binds RasON.


    Studies show that the drug is well-tolerated in normal cells.

    An astute student would recognize that Daraxonrasib would bind CypA and then wild-type Ras in nontumor cells as well, thereby inhibiting the normal activity of Ras. Isn't that a problem? It appears not to be a problem for several reasons:

    Tumor cells "evolve" to become highly dependent on sustained Ras signaling (oncogene addiction), whereas in normal cells, Ras is transiently activated only in the presence of growth factors.  In normal cells, RasON deactivates through self-catalyzed GTP hydrolysis, with and without GAPs.   The drug is highly selective for Ras-dependent tumor cells, not for normal or other tumor cells. Normal cells can use redundant signaling pathways (such as PI3K and JAK-STAT) to bypass Ras signaling.  The coupled equilibrium shown above is driven to the far right by high and constitutive RasON concentrations.

    In effect, the drug creates a new "induced-fit" competitive inhibitor of Ras.  That inhibitor is a new binding surface that can compete with the binding surface of downstream protein targets of Ras.  The Daraxonrasib:CypA binds in the conserved SWI/SWII region, which is the conserved lob of Ras to which downstream targets like RAF and PI3K bind. It's the region with the largest conformational change between the Ras:GDP (RasOFF) and Ras:GTP (RasON) states.   The mutations that promote oncogenesis (G12S, G13X, and Q61X) also stabilize the active Ras conformation in this region.

    What is also amazing is that the drug can bind not only wild-type RasON but also common mutants that shift Ras to RasON by inhibiting their intrinsic GTPase activity. Daraxonrasib interacts with mostly conserved and nonpolar residues  (P34, I36, A59, Q61, Y64, M67) in the SWI/SWII effector binding lobe of Ras, but not with the mutant sites at G12, G13, and Q61, which are left open.  This allows Daraxonrasib to affect wild-type and mutant Ras variants (WT, G12V, G12C, G12R, G13D, Q61H), including NRas and HRas.

    Let's consider the binding equilibrium for the coupled reactions. Since Ras has no affinity for daraxonrasib alone, we'll start the chemical equations with the binding of daraxonrasib (INHIB) to CyPA, followed by the binding of KRas: 

    \begin{equation}
    \text { Inhib }+ \text { CypA } \stackrel{\mathrm{K}_{\mathrm{D} 1}}{\rightleftharpoons} \text { inhib:CypA }+ \text { KRas } \stackrel{\mathrm{K}_{\mathrm{D} 2}}{\rightleftharpoons} \text { KRas:inhib:CypA }
    \end{equation}

    From this come these equations of the binary dissociation constants:

    \begin{equation}
    \begin{aligned}
    &\mathrm{K}_{\mathrm{D} 1}=\frac{[\text { Inhib }][\text { CypA }]}{[\text { Inhib: CypA }]}\\
    &\mathrm{K}_{\mathrm{D} 2}=\frac{[\text { Inhib: CypA }][\mathrm{KRas}]}{[\mathrm{KRas}: \text { Inhib: CypA }]}
    \end{aligned}
    \end{equation}

    From surface plasmon resonance binding measurements, KD1 = 57 nM.  KD2 was inferred from competitive inhibition effects that the daraxonrasib:CypA complex had on the binding of downstream protein targets of KRasON.  The values varied among the wildtype and mutants (35-229 nM).
     

    Since these are coupled, noncovalent reactions, we can write another "hypothetical" reaction in which all 3 reactants combine in a single reversible step to form a single product (the ternary complex).  This is an example of a thermodynamic cycle you studied in introductory chemistry courses.

    \begin{equation}
    \text { Inhib }+ \text { CypA }+ \text { KRas } \stackrel{\mathrm{K}_{\text {INHIB }}}{\rightleftharpoons} \text { KRas:inhib:CypA }
    \end{equation}

    The effective inhibition constant of RasON activation, KINHIB, can then be written as below:

    \begin{equation}
    \mathrm{K}_{\mathrm{Inhib}}=\mathrm{K}_{\mathrm{D} 1} \mathrm{~K}_{\mathrm{D} 2}=\frac{[\mathrm{Inhib}][\mathrm{CypA}]}{[\mathrm{Inhib}: \mathrm{CypA}]} \frac{[\mathrm{Inhib}: \mathrm{CypA}][\mathrm{KRas}]}{[\mathrm{KRas}: \mathrm{Inhib}: \mathrm{CypA}]}=\frac{[\mathrm{Inhib}][\mathrm{CypA}][\mathrm{KRas}]}{[\mathrm{KRas}: \mathrm{Inhib}: \mathrm{CypA}]}
    \end{equation}

    Improving either KD1 or KD2 (i.e., decreasing the dissociation constants) increases the effective potency (affinity) of daraxonrasib as reflected by a decreased KINHIB.  Y64 on Ras forms an extra stabilizing cation (pyridine ring) -π interaction with the pyridine ring of the daraxonrasib (INHIB) and also accepts a hydrogen bond with the W121 sidechain of CypA, which contributes to a 20-fold enhanced binding (as reflected in KD1= 55 nM).  For wildtype and mutant KRasON, KINHIB varied from 2-12 nM. 

    KINHIB values (units of nM2) can't be directly compared to KD values (IC50) at a given intracellular CypA concentration. An equation similar to those derived in Michaelis-Menten kinetics relates IC50 and KM for a specific enzymatic process in a defined system:

    \begin{equation}
    K_i=\frac{I C_{50}}{1+\frac{[S]}{K_m}}
    \end{equation}

    Clearly, IC50 = Ki only when [S] << KM.  This shows that, for enzyme systems (or other protein-binding systems), the substrate concentration must be specified for any calculated IC50

    The potencies in an actual cellular system would be better measures.  In vitro, the KD for statin interactions with HMGCoA Reductase is around 2-250 nM, but because the reductase concentration is so high in cells, the effective inhibitory concentration in cells for half-maximal inhibition (EC50) of statins in a defined cellular or organismal system can be 10-100-fold higher. EC50 is affected by a drug's permeability across the membrane, its binding to off-site targets, and the intracellular concentrations of binding targets. Intracellular potency values (measured by EC50) are in the low nM range for daraxonrasib, better than those of statins and their intracellular effects. 

    We can obtain a better comparison of binding efficacy using this equation that relates ΔG0 to KD

    \begin{equation}
    \Delta \mathrm{G}^0=-\mathrm{RT} \ln \mathrm{~K}_{\mathrm{eq}}=\mathrm{RT} \ln \mathrm{~K}_{\mathrm{D}}
    \end{equation}

    You should remember from introductory chemistry that ΔG0 is a state function, and from thermodynamic cycles (linked equilibrium equations), this simple additive equation results:

    \begin{equation}
    \Delta G_{t \text { total }}^{\circ}=\Delta G_{D 1}^{\circ}+\Delta G_{D 2}^{\circ}
    \end{equation}

    The comparative values for RasON and HMGCoA Reductase are shown in Table \(\PageIndex{1}\) below

    Drug complex KD or KINHIB ΔG0 
    atorvastatin:HMGCoA Reductase K≈ 8 nM -11.1 kcal/mol.
    Daraxonrasib:CypA KD1 = 55 nM −9.9 kcal/mol
    Daraxonrasib:CypA:KRAS G12C KD2 = 35 nM ΔG0 = −10.1 kcal/mol
    Daraxonrasib total, G12C KINHIB ~1.9 nM² ΔG0  = −20.0 kcal/mol


    Table \(\PageIndex{1}\):  Comparative binding and thermodynamic values for RasON and HMGCoA Reductase

    Hence, the thermodynamic driving force for total complex formation and inhibition is much more favorable for Daraxonrasib than for atorvastatin.

    In a way, you can think of Daraxonrasib as an effective inducible fit competitive inhibitor of Ras activity.  Figure \(\PageIndex{9}\) below illustrates how binding of Daraxonrasib alters the surface of CypA such that the neomorphic CypA surface can be considered an induced fit competitive inhibitor of the surface of downstream protein targets of Ras (such as PI3K and RAF1).

    KRAS_CYPA_RAF1_INHIB.svg

    Figure \(\PageIndex{9}\):  Neomorphic CypA surface can be considered an induced fit competitive inhibitor of the surface of downstream protein targets of Ras

    .


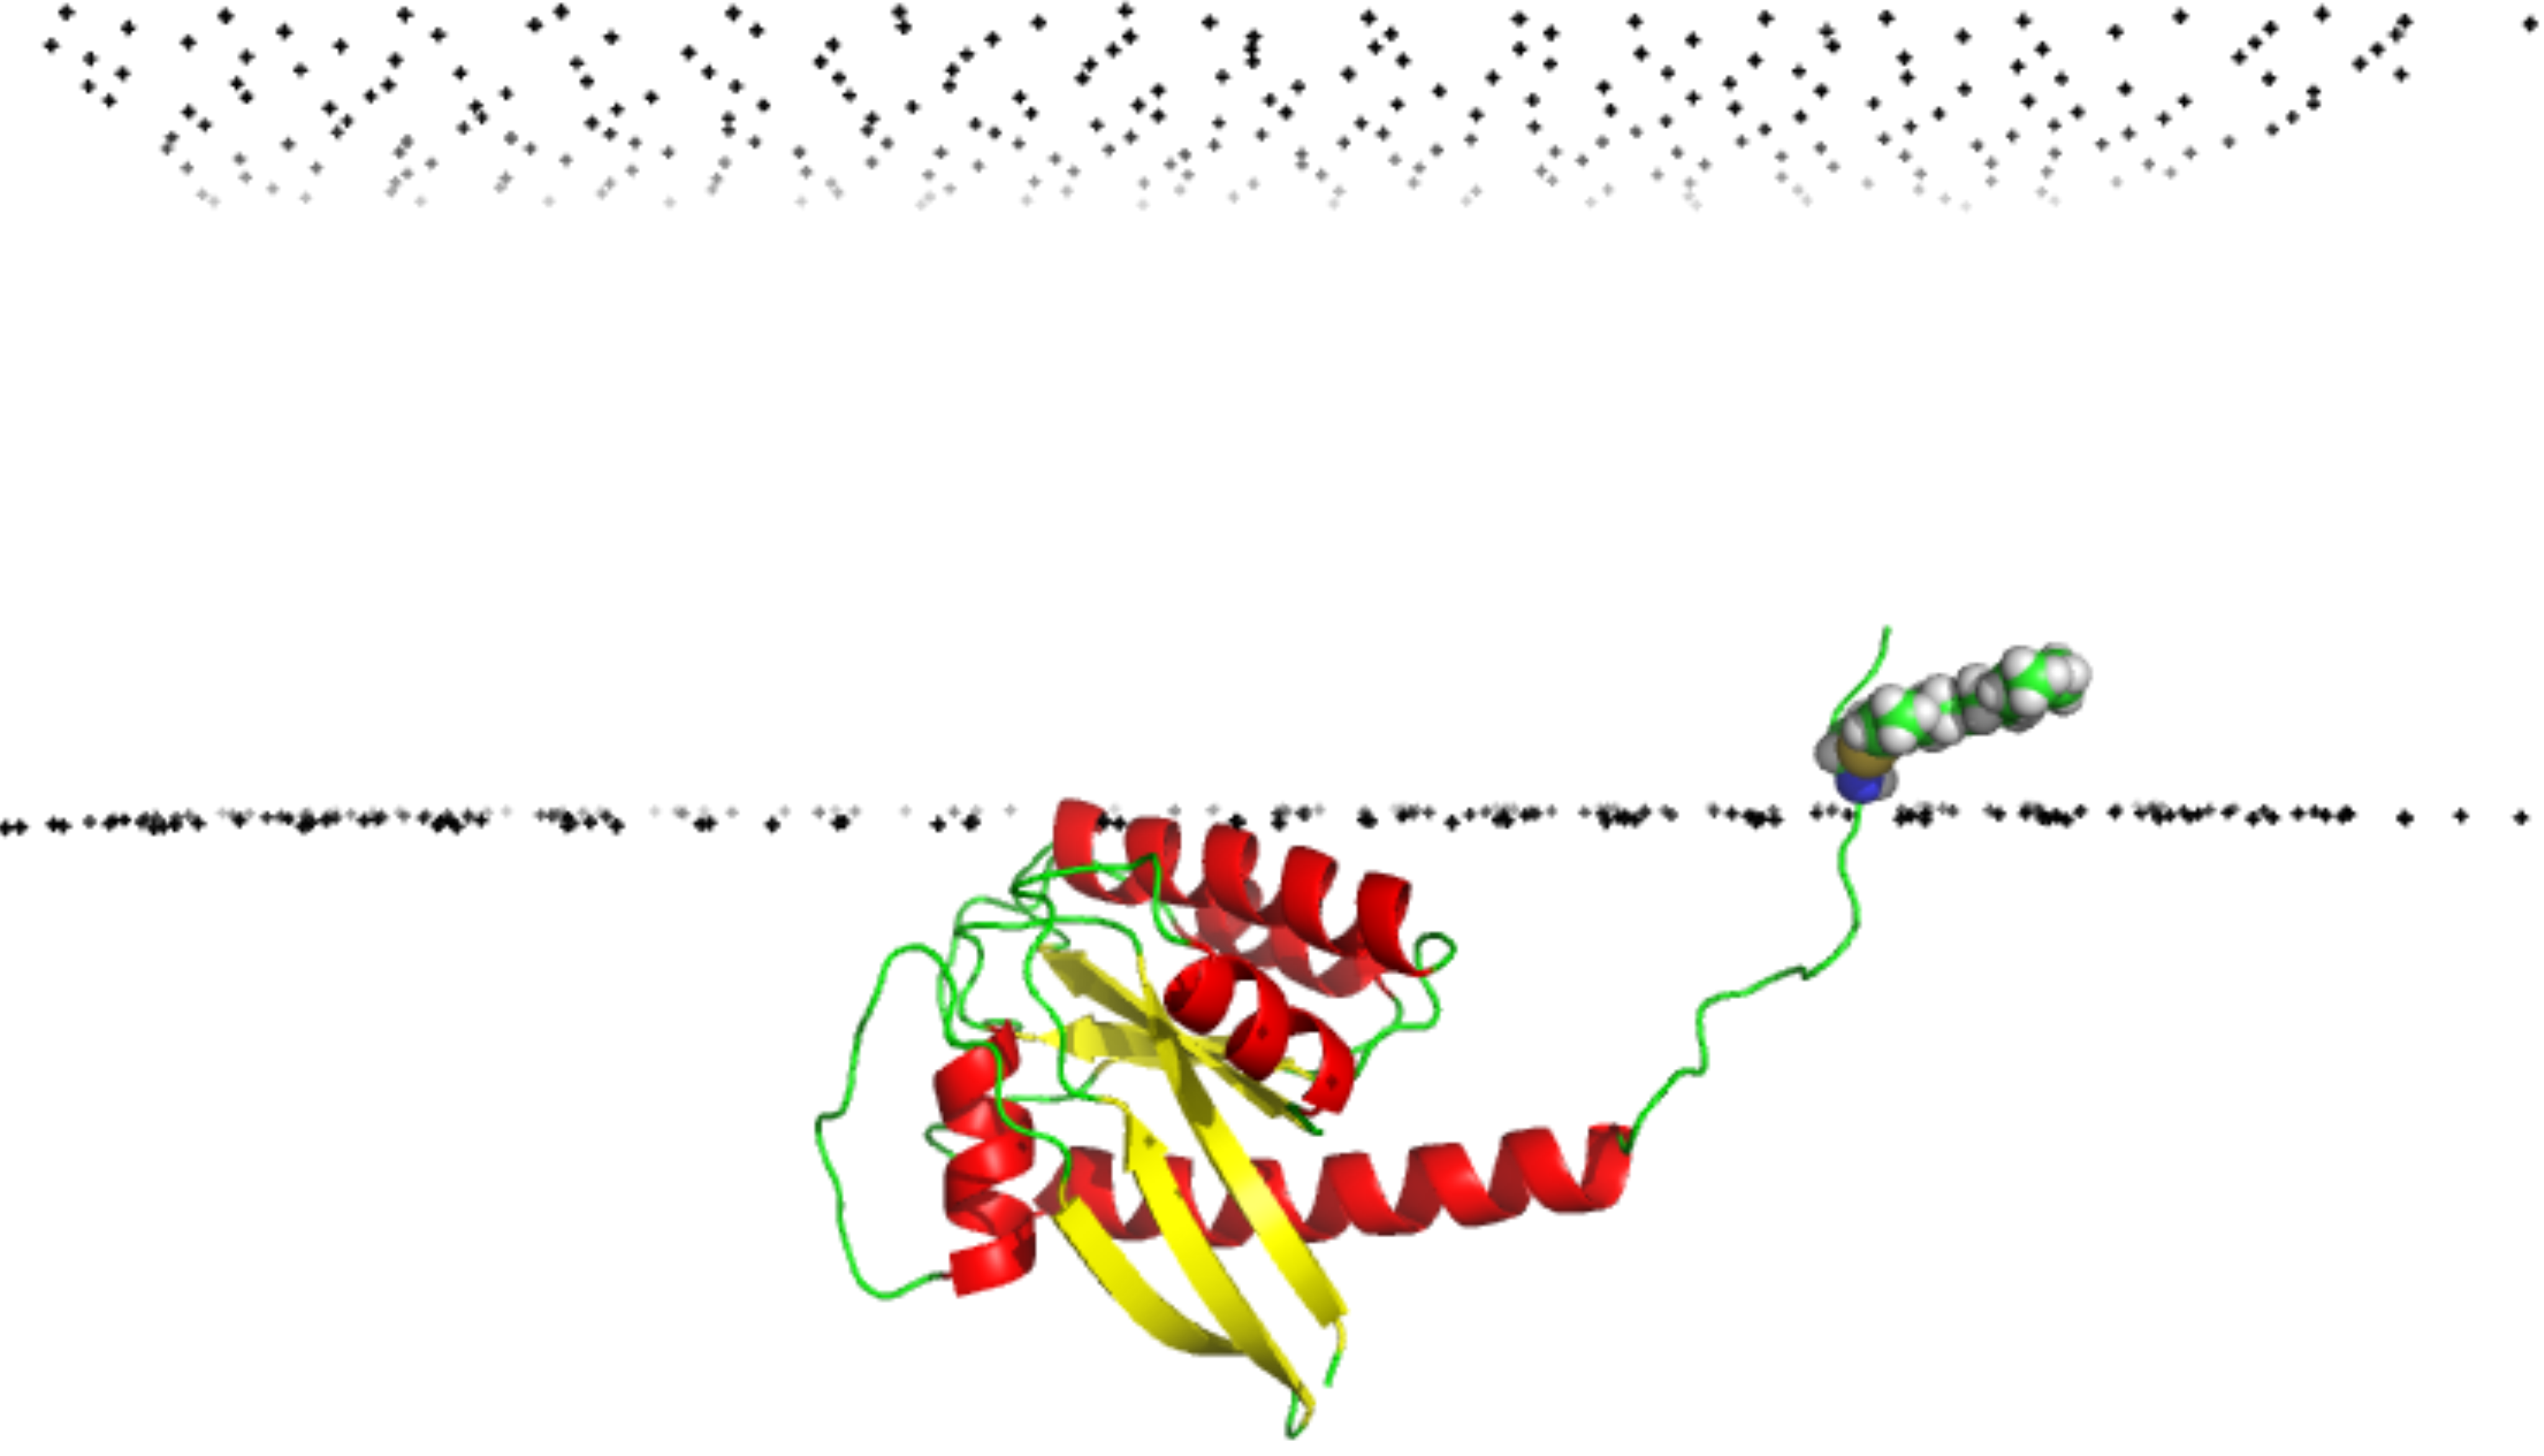
    The above structures of Ras lack the last 20 amino acids of the C-terminal end with the polybasic region and the C-terminal CAAX of the hypervariable region that mainly differentiates Ras from other small G-proteins. The last residues of K-Ras from 180-186 are CVKIKKCIIM.  C180 and the K side chains are palmitoylated post-translationally, whereas C186 is farnesylated.  These post-translational lipidations target the otherwise soluble enzyme to the membrane. Figure \(\PageIndex{10}\) below shows a model of K-Ras targeted to the intracellular side of the bilayer (two sets of black "dummy" atoms represent lipid molecules) through the attachment of a farnesyl group on Cys185.  Cys-farnesyl 185 is shown in spacefill.
    3D molecular structure featuring red and yellow helices with green strands, and a small gray and white molecule attached.

    Figure \(\PageIndex{10}\): A model of K-Ras targeted to the intracellular side of the bilayer (two sets of black "dummy" atoms representing lipid molecules) through the attachment of a farnesyl group on Cys185.  Cys-farnesyl 185 is shown in spacefill. The full-length structure was obtained through NMR spectroscopy (7KYZ, Model 1) and added to the PC bilayer (represented by dummy atoms) using MolCube.

    Indeed, all Ras proteins are localized to different membranes (plasma and organelles) through the post-translational addition of hydrophobic anchors to the C-terminal hypervariable region.  They can be activated at different rates at the plasma, endoplasmic reticulum, and Golgi membranes. Hence, the downstream signaling from Ras likely emanates in waves from various locations in the cell.

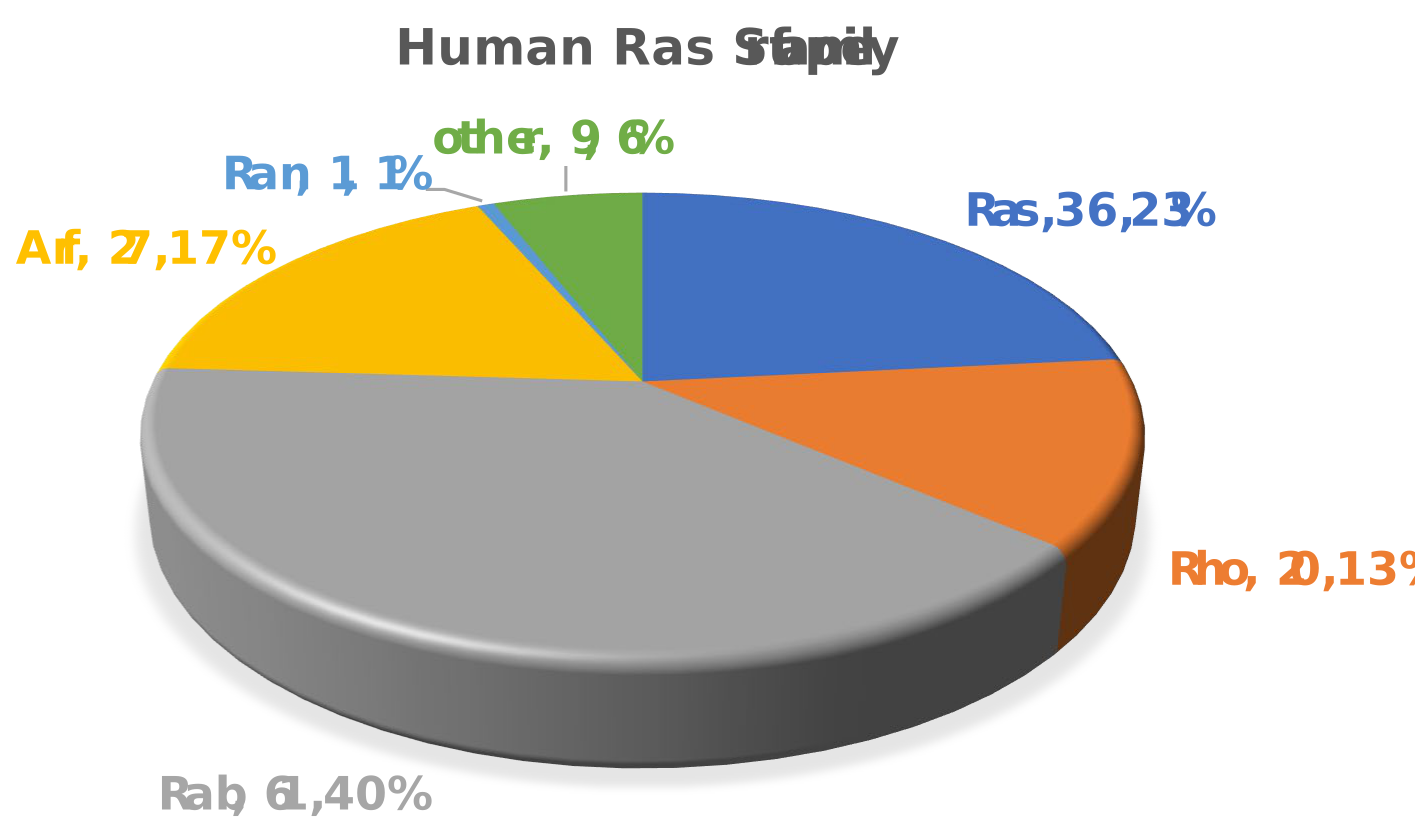
    There are about 150 members of the human Ras superfamily, as shown in Figure \(\PageIndex{11}\) and Table \(\PageIndex{2}\) below.  They are divided into Ras, Rho, Rab, Arf, Ran, and "other" subfamilies.

    3D pie chart divided into six segments, each a different color, with corresponding labels positioned around it.
    Figure \(\PageIndex{11}\): Members of the human Ras superfamily

    Table \(\PageIndex{2}\) shows common Ras superfamily functions

    Ras regulation of gene expression, cell proliferation, survival, and differentiation
    Rho regulation of actin cytoskeleton, cell shape, and movement, and cell interactions with the extracellular matrix
    Rab vesicle trafficking, endocytosis, secretion
    Arf vesicle trafficking, endocytosis, secretion, microtubule assembly
    Ran nuclear-cytoplasmic transport, mitotic spindle

    Regulation of small G proteins: GAPs and GEFs

    Given the critical importance of small G proteins, it is biologically sensible that their on/off activity would be exquisitely regulated. Indeed, they are. Two families of proteins have evolved to regulate them by determining whether GTP or GDP is bound to the protein, resulting in an active and inactive small G protein, respectively. One family, GTPase-activating proteins (GAPs), facilitates the hydrolysis of bound GTP, leading to the inhibition of the protein. The other family is GTP exchange proteins (GEFs), which facilitate the exchange (replacement) of bound GDP with GTP, thereby activating the protein.

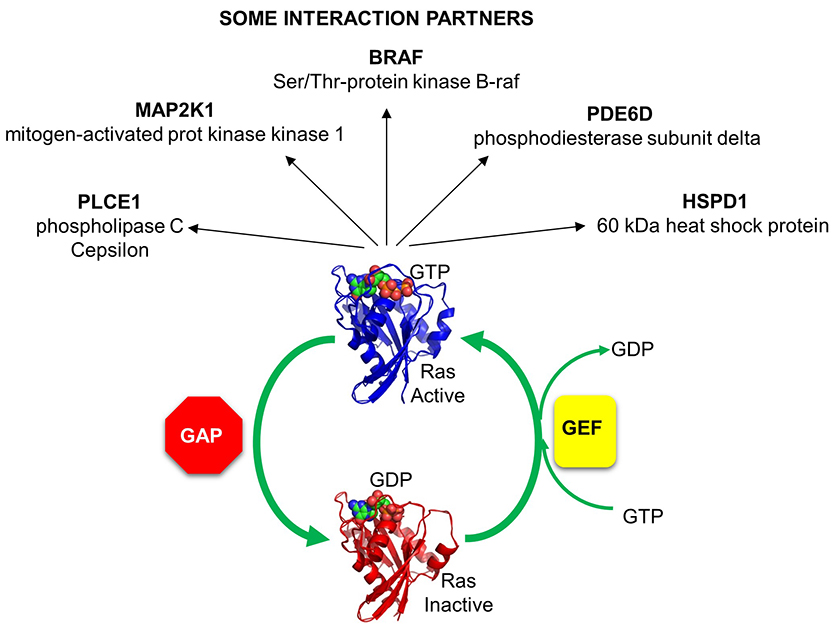
    The activity of Ras GAPs and GEFs, as well as various proteins interacting with Ras, is depicted in Figure \(\PageIndex{12}\).

    Diagram illustrating protein interactions, featuring nodes labeled MAPP, PLK1, PA28, and HCSP, connected by arrows to a central complex.

    Figure \(\PageIndex{12}\): The activity of Ras GAPs and GEFs, as well as various proteins interacting with Ras

    It may seem crazy, but the number of GEFs and GAPs is greater than the number of small G proteins. As shown in Figure \(\PageIndex{4}\), there are 20 Rho G proteins, but about 80 GEFs and 70 GAPs for them. This number presumably allows greater control over the specificity of reactions mediated by the Rho G protein.

    GAPs - GTPase-activating Proteins

    The hydrolysis of the gamma phosphate of GTP by water in Ras proceeds by a pentavalent transition state with two axial and three equatorial ligands to the phosphorus. Developing charge in the transition state would usually be stabilized by catalytic residues in the catalytic domain of Ras. However, Ras is a poor GTPase. That's where GAPs come in. In the Ras/GAP complex, GAP positions its Arg789 to stabilize the transition state for Ras-bound GTP cleavage. This Arg789 is in a similar position to Arg178 in the Galpha inhibitory (Gαi) subunit of a heterotrimeric G protein, which inhibits GPCR signaling. Both of these arginines have similar catalytic functions.

    Figure \(\PageIndex{13}\) shows an interactive iCn3D model of Ras-GAP complex (1WQ1)

    3D representation of a protein structure with segments in gray, red, blue, and yellow, showing different secondary structures.
    Figure \(\PageIndex{13}\): Ras-GAP complex (1WQ1) (Copyright; author via source). Click the image for a popup or use this external link: https://structure.ncbi.nlm.nih.gov/i...MJiLGpT4w6kP69

    Ras is shown in traditional secondary-structure colors, while GAP is shown in gray. GDP-AlF3, a GTP analog, is shown in color spacefill. Arginine 789 in GAP is shown in spacefill with CPK colors and labeled R789. It is positioned to stabilize the bound GTP in the complex and its cleavage transition state.

    GEFs - GTP Exchange Factor

    Once bound to Ras, GDP dissociates very slowly. Values of 10-5 sec-1 have been reported for the first-order dissociation rate constant of GDP from a small G protein in an isolated system. Assuming that diffusion controls the on-rate constant for the complex, the dissociation constant KD=koff/kon for the G protein:GDP complex would be 0.1 pM, and its half-life would be 0.8 days, similar to the lac repressor:DNA operator complex. Hence, the protein, when bound to GDP, is essentially locked in the off position. What if it needs to be reactivated quickly? How can the rate at which GDP dissociates be increased so that GTP could replace it? If it were to dissociate, GTP could quickly replace it based on simple equilibrium conditions, since the GTP concentration is much higher in cells than that of GDP. 

    One could envision several ways to change the rate at which GDP dissociates. In organic chemistry, a favorite student response to many questions is to invoke steric effects. In biochemistry, the correlate is conformational changes. How could you change the conformation of Ras such that it might favor GTP binding and GTP association? This could occur through conformational changes in Ras associated with ligand binding, or, more likely, through a post-translational modification, such as phosphorylation, as part of a signaling process. For small G proteins, another mechanism is evoked: the binding of another protein, a GTP Exchange Factor or a GEF, which promotes GTP exchange for the bound GDP. If the Ras:GEF:GDP complex has a 10,000 increase in koff for GTP, the half-life of the bound GDP is 7 seconds. There are 80 GEFs in the human genome. If you think about it, in GPCR-coupled signaling, the ligand-bound GPCR is a GEF for the Gα subunit of the heterotrimeric Gαβγ protein.

    The crystal structure of the Ras GEF SOS in complex with Ras provides a detailed understanding of the mechanism. SOS (son of sevenless), a cytoplasmic protein, is recruited to the cell membrane where active Ras is found, tethered there by a hydrophobic farnesyl attachment.  Figure \(\PageIndex{14}\) shows an interactive iCn3D model of H-Ras and SOS (a GEF) complex (1bkd).

    3D molecular structure showing a protein with a light blue ribbon model, featuring additional colored segments in gray, red, green, and blue.

    Figure \(\PageIndex{14}\): Ras and SOS (a GEF) complex (1bkd) (Copyright; author via source). Click the image for a popup or use this external link: https://structure.ncbi.nlm.nih.gov/i...XJP4Fajqc9eEL6

    SOS is shown in cyan, while H-Ras is shown in gray.  As in the figures above, the P-Loop (same as G1) is green,, Switch 1 (30-40) is red and contains the invariant residue Thr 35 and Switch 2 (60-76) is blue.

    The actual biological unit (functional structure) is a hetero 8-mer (A4B4) with C4 symmetry. The iCn3D model shows just a heterodimer for clarity.  SOS as a GEF affects nucleotide binding to Ras in two essential ways. An alpha helix from SOS displaces Switch 1 (amino acids 30-38, shown in red) in Ras, which opens the binding site for the guanine nucleotides. Additional conformational changes in Switch II (59–72, blue) in Ras and interference from the side chains of the SOS alpha helix interfere with the binding of the phosphates on the bound nucleotide. This promotes the dissociation of the bound nucleotide and Mg2+. Now, GTP can preferentially rebind. How?

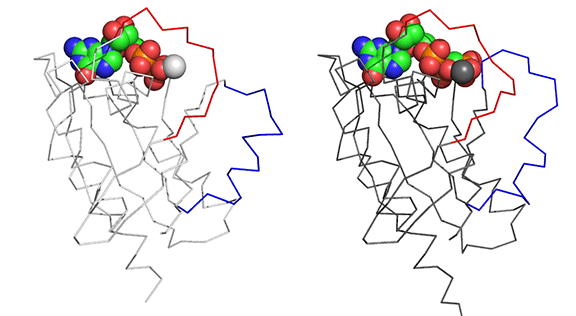
    Before we answer that question, let's explore the conformational differences just in the structure of Ras in the Ras:GDP complex (4q21) and Ras:GTP analog (6q21). These differences are shown in Figure \(\PageIndex{15}\). The light gray is Ras:GDP, and the dark gray is Ras:GCP (a GTP analog - the larger spacefill molecule).  The red backbone is Switch 1, and the blue is Switch 2.  

    3D molecular structure with colored atoms (red, green, blue) and a wireframe backbone, illustrating a chemical compound.

    Figure \(\PageIndex{15}\): Conformational differences just in the structure of Ras in the Ras:GDP complex (4q21) and Ras:GTP analog (6q21)

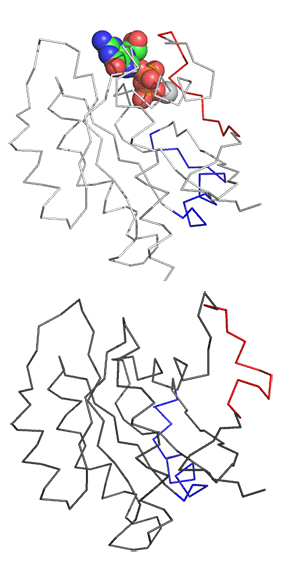
    Now let's look at the difference between  Ras in the Ras:GDP complex (4q21) and Ras in the Ras:SOS (1bkd) complex. These differences are shown in Figure \(\PageIndex{16}\). The light gray backbone is Ras:GDP alone, with the GDP shown in CPK colors and spacefill.  The dark gray backbone depicts just the Ras protein from the Ras:SOS protein complex.  In both, the red backbone is Switch I and the blue backbone is Switch 2.   
    3D molecular structure with colored atoms (red, blue, green) and white bonds, representing a complex organic molecule.


    Figure \(\PageIndex{16}\): Structure difference in Ras (light gray) in the Ras:GDP complex (4q21) and Ras (dark gray) in the Ras:SOS (1bkd) complex

    Note the large shift in Switch 1 in the Ras structure, going from the Ras:GDP to the Ras in the Ras:SOS complex. This leaves a gaping hole from which GDP can escape. Now, how does the opening of the active site and release of bound GDP facilitate GTP binding?

    The conformational changes that occur when RAS binds to SOS open up the active site, allowing GDP to dissociate. GTP can now replace it because, from an equilibrium point of view, Ras and other small G proteins favor GTP binding, as the concentration of GTP in the cell is higher than that of GDP. Additionally, some noncovalent interactions with the extra phosphate on GTP may also contribute.

    Figure \(\PageIndex{17}\) shows a cartoon showing the changes in Ras on GEF binding as illustrated in these coupled chemical equilibria:

    GEFloose:Ras:GDPtight ↔ GEFtight:Ras:GDPloose ↔ GEFtight:Ras
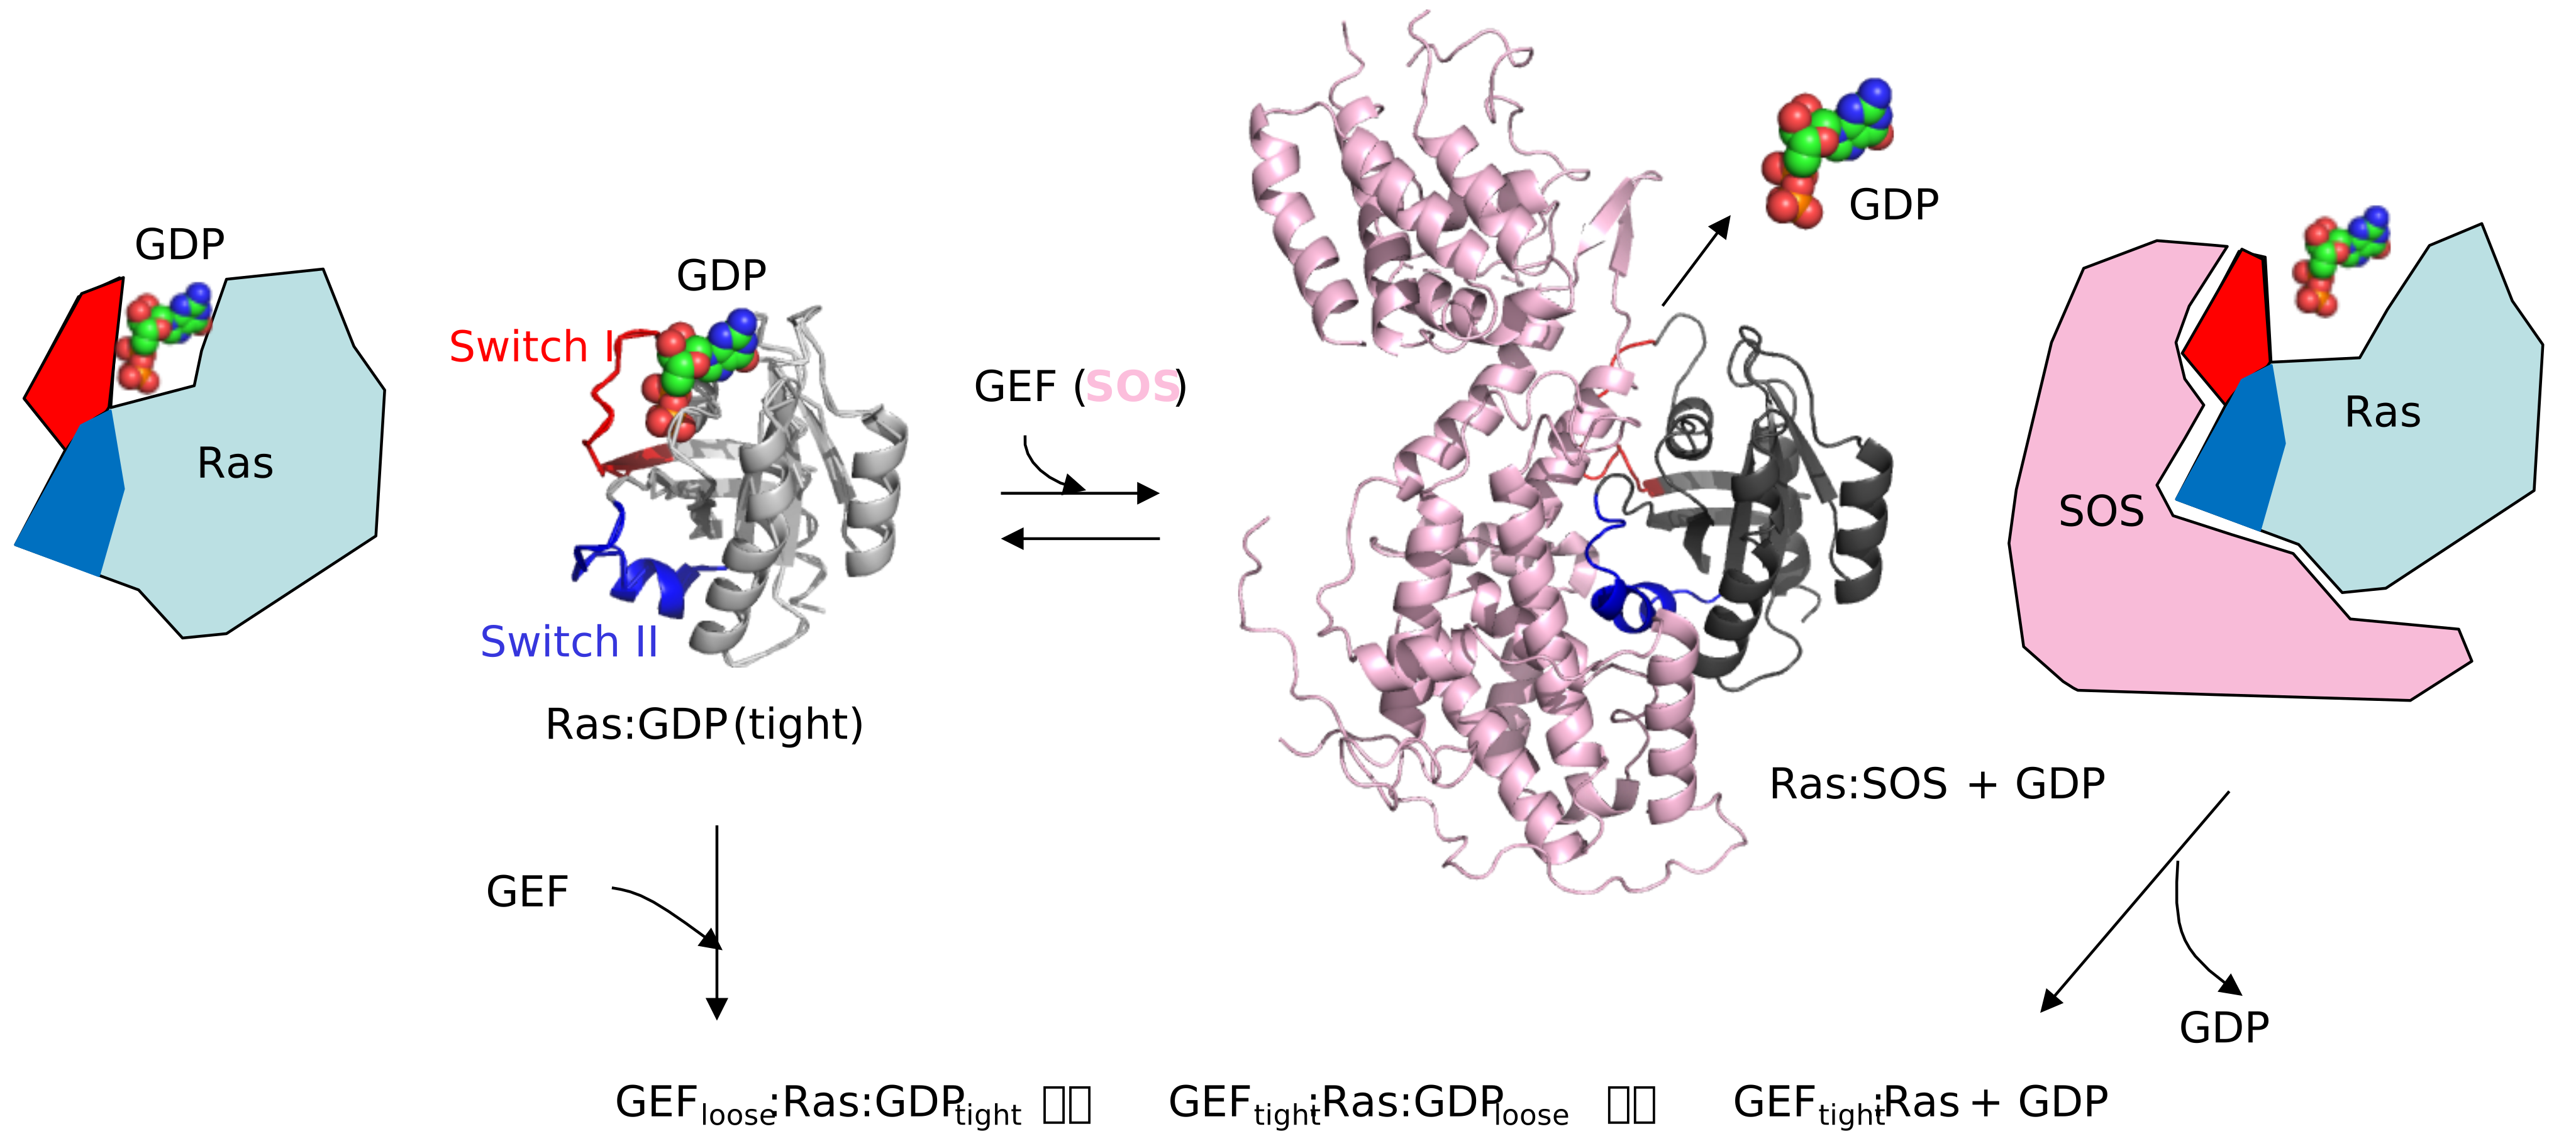
     

    Diagram illustrating the structural transition of a protein, featuring multiple formations and molecular interactions.

    Figure \(\PageIndex{17}\): Chemical equation for Ras:GEF:GDP interactions


    Ras Activation and Signaling

    Upstream activation of Ras

    Now, let's place Ras activity in the context of large signaling pathways in which it participates. Just a note to beginning students of signal transduction, who might default to thinking that every signaling protein is a membrane receptor, a kinase, a phosphatase, or another protein that causes post-translational modification of other proteins.  Ras is none of these.  It's just a very small globular protein that can cleave bound GTP, but it does so quite poorly.  Yet it lies at the center of the control of many signaling pathways, and when it gets dysregulated, cancer often arises.

    First, Ras signaling requires its association with membranes or membraneless cytoplasmic protein granules.  Targeting of Ras to membranes requires its lipidation (palmitoylation and farnesylation) in the hypervariable region, as well as the involvement of a host of enzymes and other proteins.  We won't discuss those or their regulation.  We will start with inactive Ras associated with membranes.  Figure \(\PageIndex{18}\) summarizes Ras:membrane interactions.
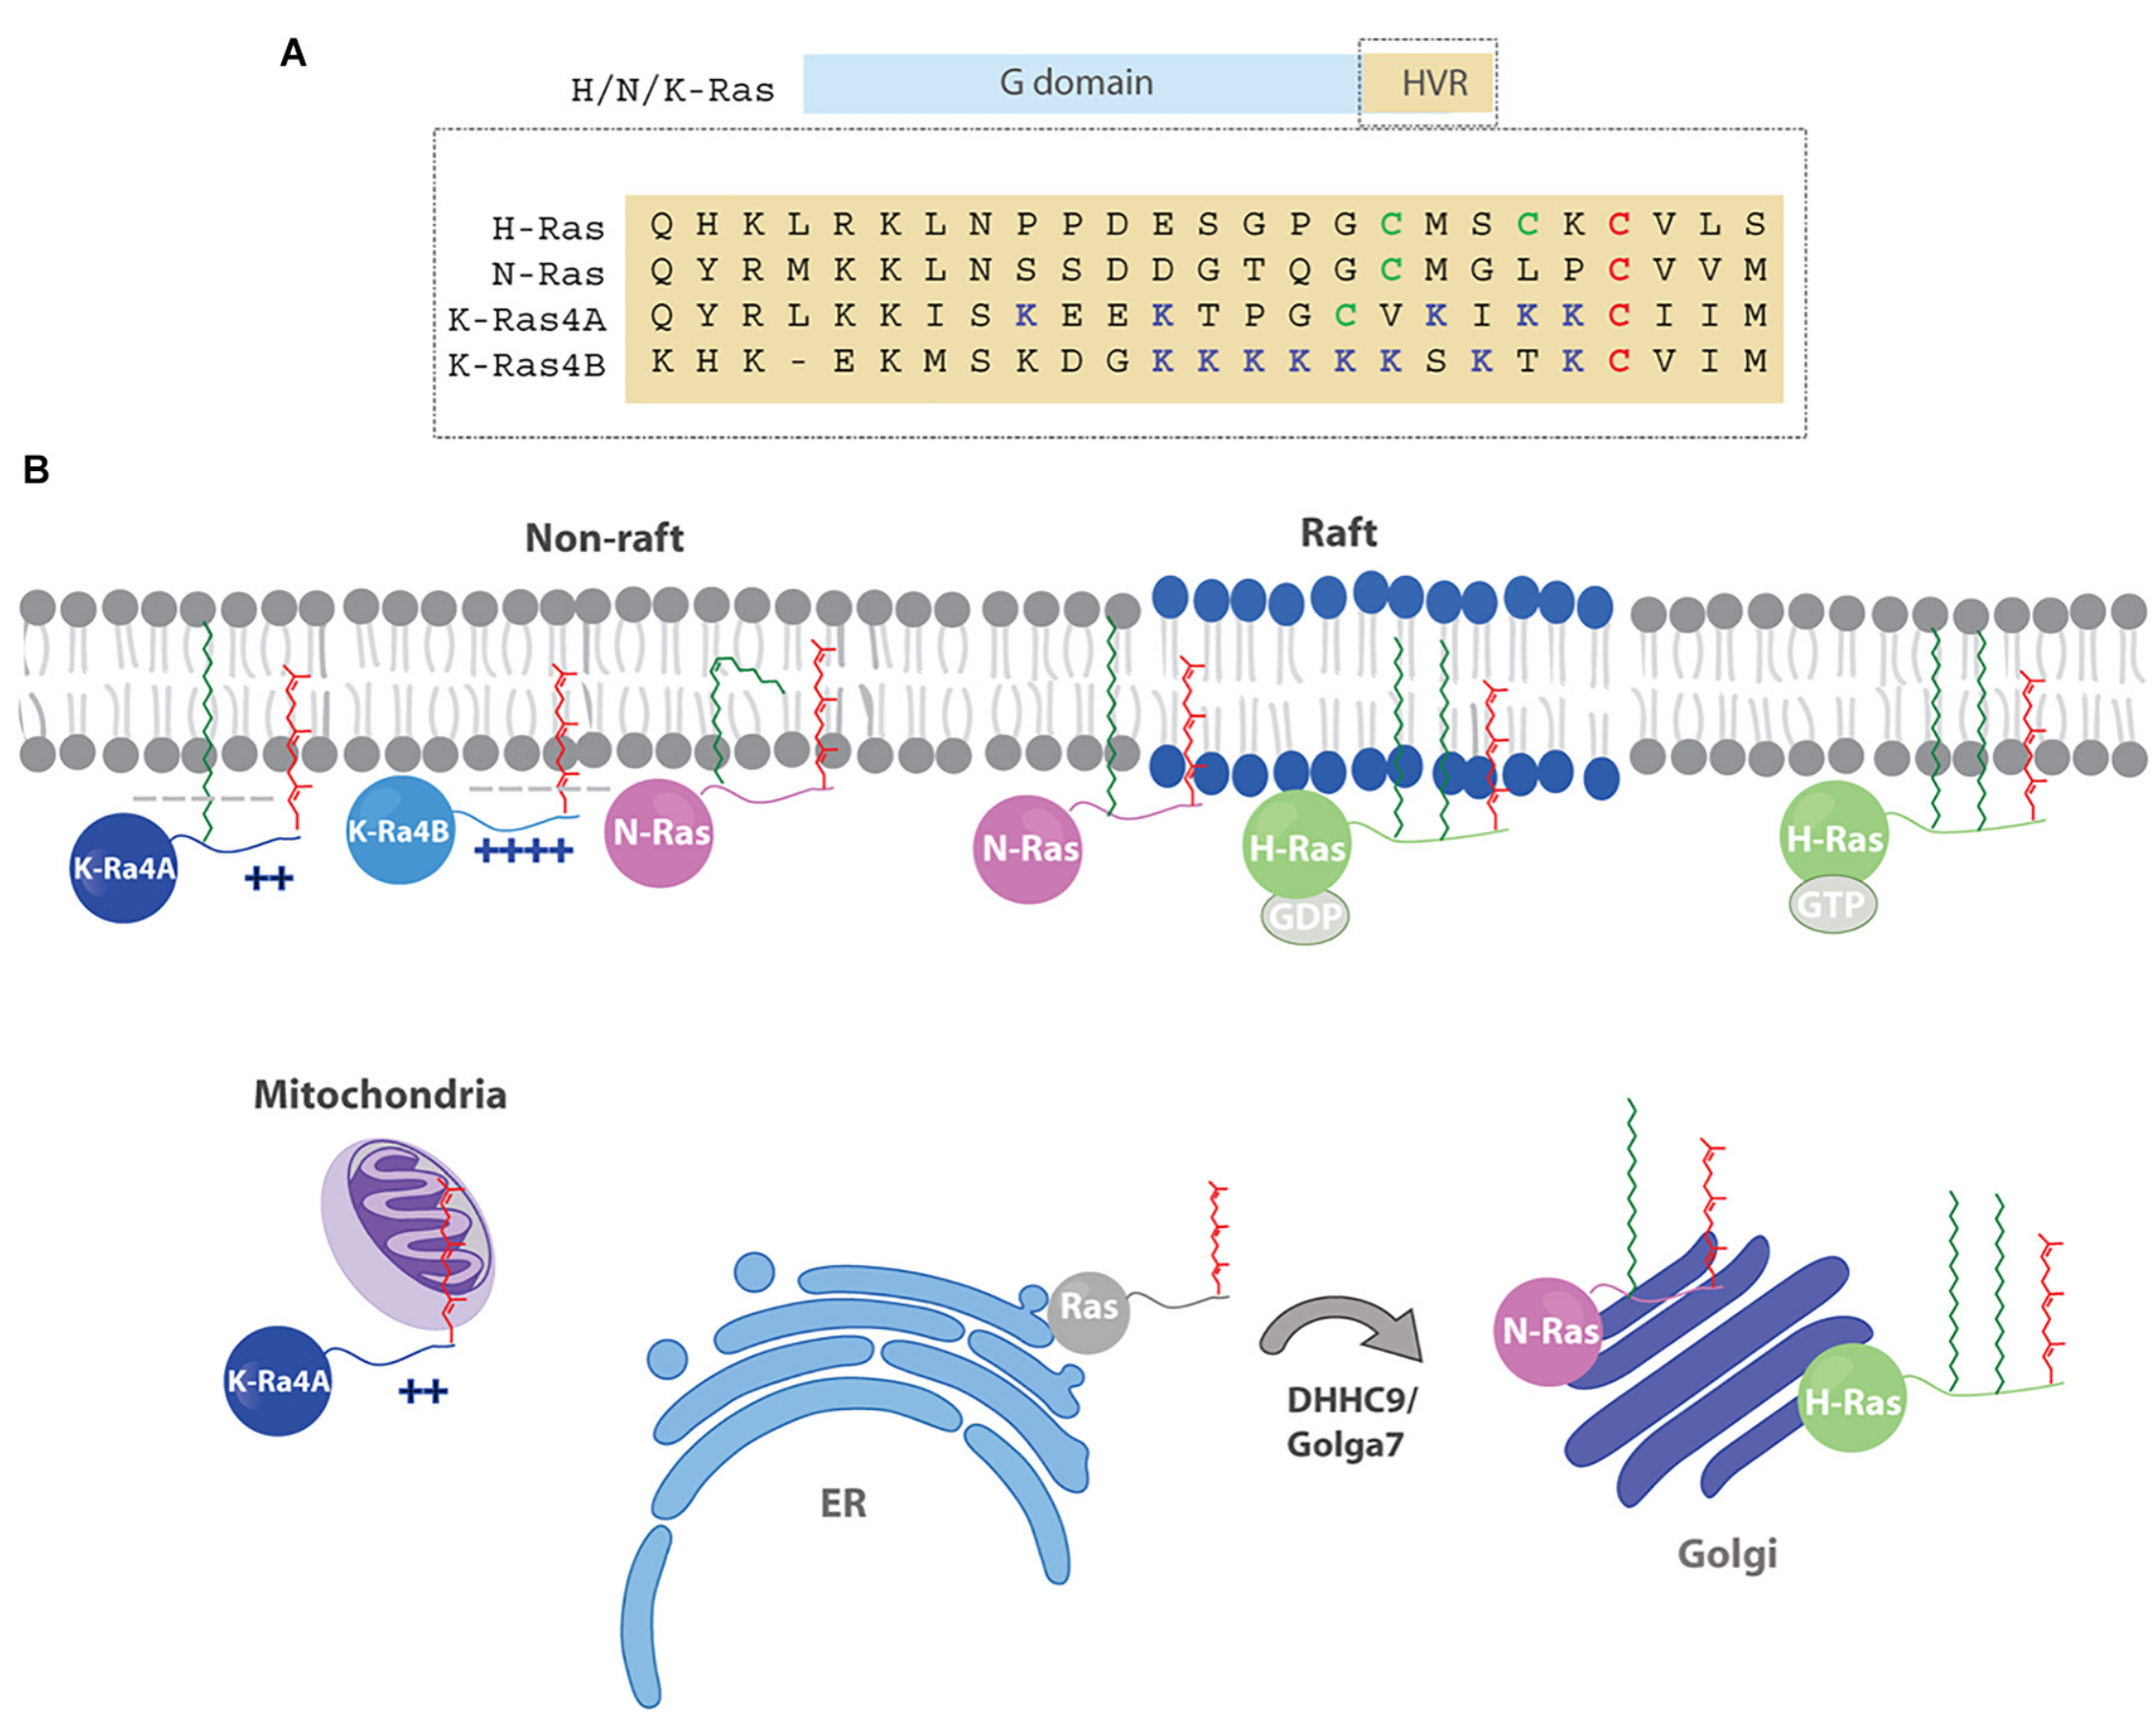
    Illustration showing Ras protein domains, membrane localization, and transport to organelles like mitochondria, ER, and Golgi.

    Figure \(\PageIndex{18}\):  Busquets-Hernández C, Triola G. Palmitoylation as a Key Regulator of Ras Localization and Function. Front Mol Biosci. 2021 Mar 17;8:659861. doi: 10.3389/fmolb.2021.659861. PMID: 33816563; PMCID: PMC8010249.  Creative Commons Attribution License (CC BY)

    Panel (A) The Ras isoforms contain a highly homologous G domain (90%) and a C-terminal hypervariable region (HVR) that comprises the last 24 amino acids. The HVR exhibits a low degree of homology between isoforms (∼ 10%) and presents different post-translational lipid modifications. Red cysteines (C) are farnesylated, green cysteines (C) are palmitoylated, and blue lysines (K) are polybasic residues. 

    Panel (B) Ras membrane distribution is dynamic. It depends on membrane-targeting motifs, including polybasic sequences and lipids, as well as palmitoylation state, which together modulate Ras trafficking and localization to specific membranes, such as the plasma membrane (PM), endomembranes, and subdomains. Hence, farnesylated H/N-Ras become palmitoylated at the Golgi apparatus by DHHC9/Golga7 and are then transferred to the plasma membrane (PM) via the secretory pathway. After depalmitoylation, H/N-Ras traffic back to the Golgi to be reacylated. Due to the presence of two palmitoyl moieties, H-Ras gets enriched in the PM, whereas N-Ras is predominantly localized at the Golgi. Once in the membrane, H-Ras segregates into distinct microdomains, including rafts and non-rafts, in a GDP/GTP-dependent manner. Palmitoylated N-Ras associates preferentially with raft/non-raft boundary regions, although an N-Ras protein modified with an unsaturated palmitoleic acid shows preferential accumulation in fluid domains. The localization of K-Ras4A on the PM relies on the presence of polybasic regions and a palmitoylated cysteine, whereas K-Ras4B is palmitoylation-independent. After depalmitoylation, K-Ras4A travels to the mitochondria and binds HK1.

    Once at the membranes, the rate of Ras activation is influenced by three factors:

    1. the rate of bound GTP hydrolysis
    2. the rate of GTP/GDP binding and exchange
    3. the rate of binding of downstream effector proteins (GAPs and GEFs) that regulate its activity

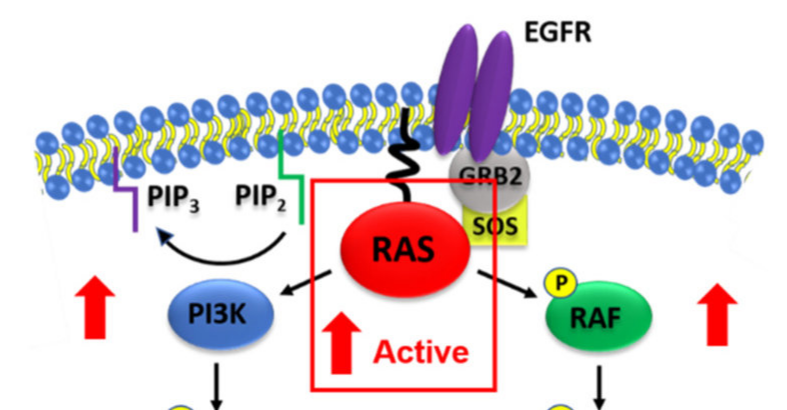
    Let's examine a concrete example we described in the previous section (28.4) that involves signaling through the epidermal growth factor receptor (EGFR).  When the receptor binds the extracellular signal (epidermal growth factor), it forms a dimer.  The intracellular domains of the now dimeric EGFR autophosphorylate themselves on selected tyrosine side chains. This recruits a protein called Growth factor receptor-bound protein 2 (GRB2), which has an SH2 (Src Homology 2) domain that binds phosphotyrosine motifs in proteins. GRB2 acts as an adaptor protein: in addition to its SH2 domain, it has two SH3 (Src Homology 3) domains that bind proline-rich motifs on other signaling proteins, including the Sos of sevenless homolog (SOS), a major GEF that we discussed above. GRB2 does not have enzymatic activity.  SOS then interacts with the membrane-associated Ras.  These events are illustrated in Figure \(\PageIndex{19}\) below.

    Diagram illustrating cell signaling pathway involving EGFR, RAS, PI3K, and RAF, highlighting RAS as active.

    Figure \(\PageIndex{19}\):  Near downstream signaling molecules after activation of EGFR.  Mattox TE, Chen X, Maxuitenko YY, Keeton AB, Piazza GA. Exploiting RAS Nucleotide Cycling as a Strategy for Drugging RAS-Driven Cancers. Int J Mol Sci. 2019 Dec 24;21(1):141. doi: 10.3390/ijms21010141. PMID: 31878223; PMCID: PMC6982188.  Creative Commons Attribution (CC BY) license (http://creativecommons.org/licenses/by/4.0/).

    Downstream activation by Ras

    When membrane-bound Ras interacts with the GEF SOS, it is activated.  Active Ras can then activate a plethora of downstream signaling molecules by binding to them and allosterically altering their activity (remember that Ras is not a kinase or other post-translational modification agent). Figure \(\PageIndex{20}\) illustrates 12 classes of downstream signaling proteins activated by Ras.  We'll explore some of them in future chapter sections.
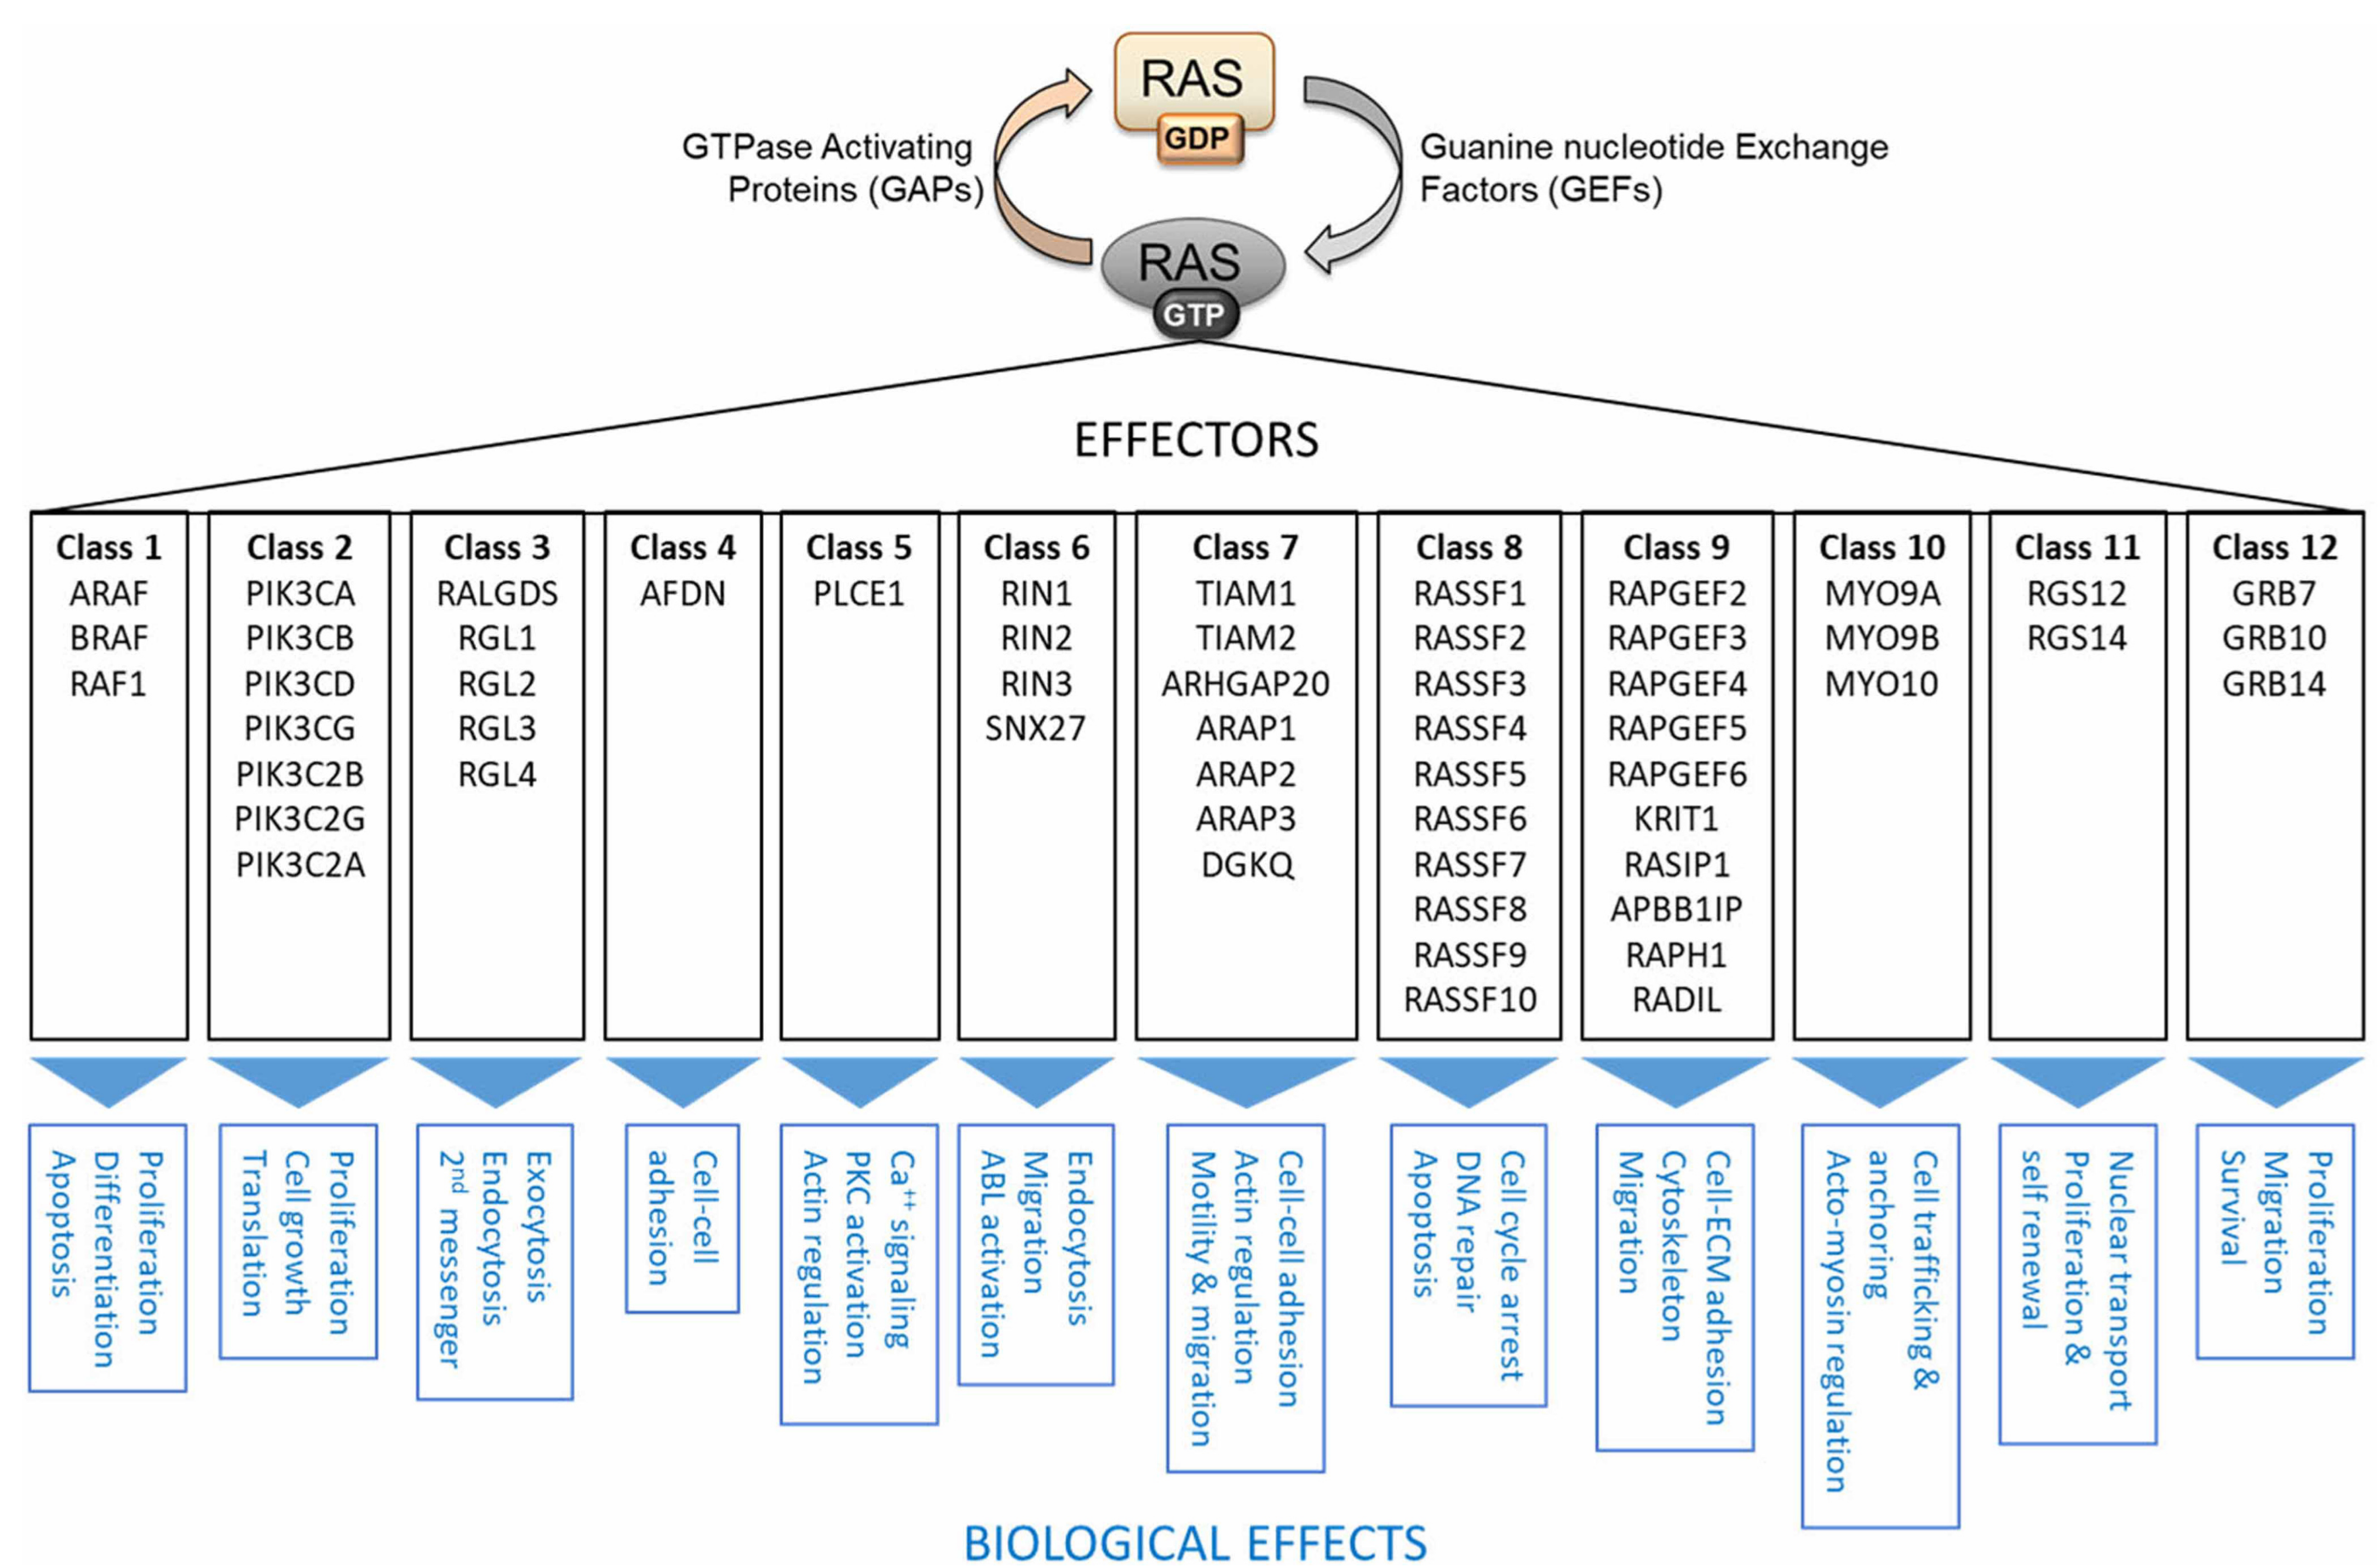
    Diagram showing RAS pathway with classes of effectors and their biological effects, including cell proliferation, adhesion, and apoptosis.

    Figure \(\PageIndex{20}\): RAS activation cycle and RAS effectors.  Fifty-six bona fide RAS effectors can be grouped into 12 classes according to sequence homology and regulation of downstream biochemical and biological processes.  Kolch W, Berta D, Rosta E.  Ibid.

    We'll focus on just two downstream proteins: RAF1 kinase and EGFR (which we discussed above).  For many years, nobody knew how Ras activated signaling.  That changed when it was discovered that Ras binds RAF1 kinase.  RAF1 contains three conserved regions: CR1, CR2, and CR3 (the kinase domain).  CR1 contains the Ras-binding domain (RBD) and a cysteine-rich domain (CRD) that interacts with membrane bilayers.  Figure \(\PageIndex{21}\) shows the domain structures of RAF1 and KRas, along with a truncated construct of Raf1 that contains just the RBD connected by a linker to the CRD of Raf1.  Using surface plasmon resonance experiments (shown in panel B), it is clear that the binding of the RBD-CRD segment occurs with a higher affinity/lower KD (=ligand concentration at half-maximal saturation) than just the RBD segment.
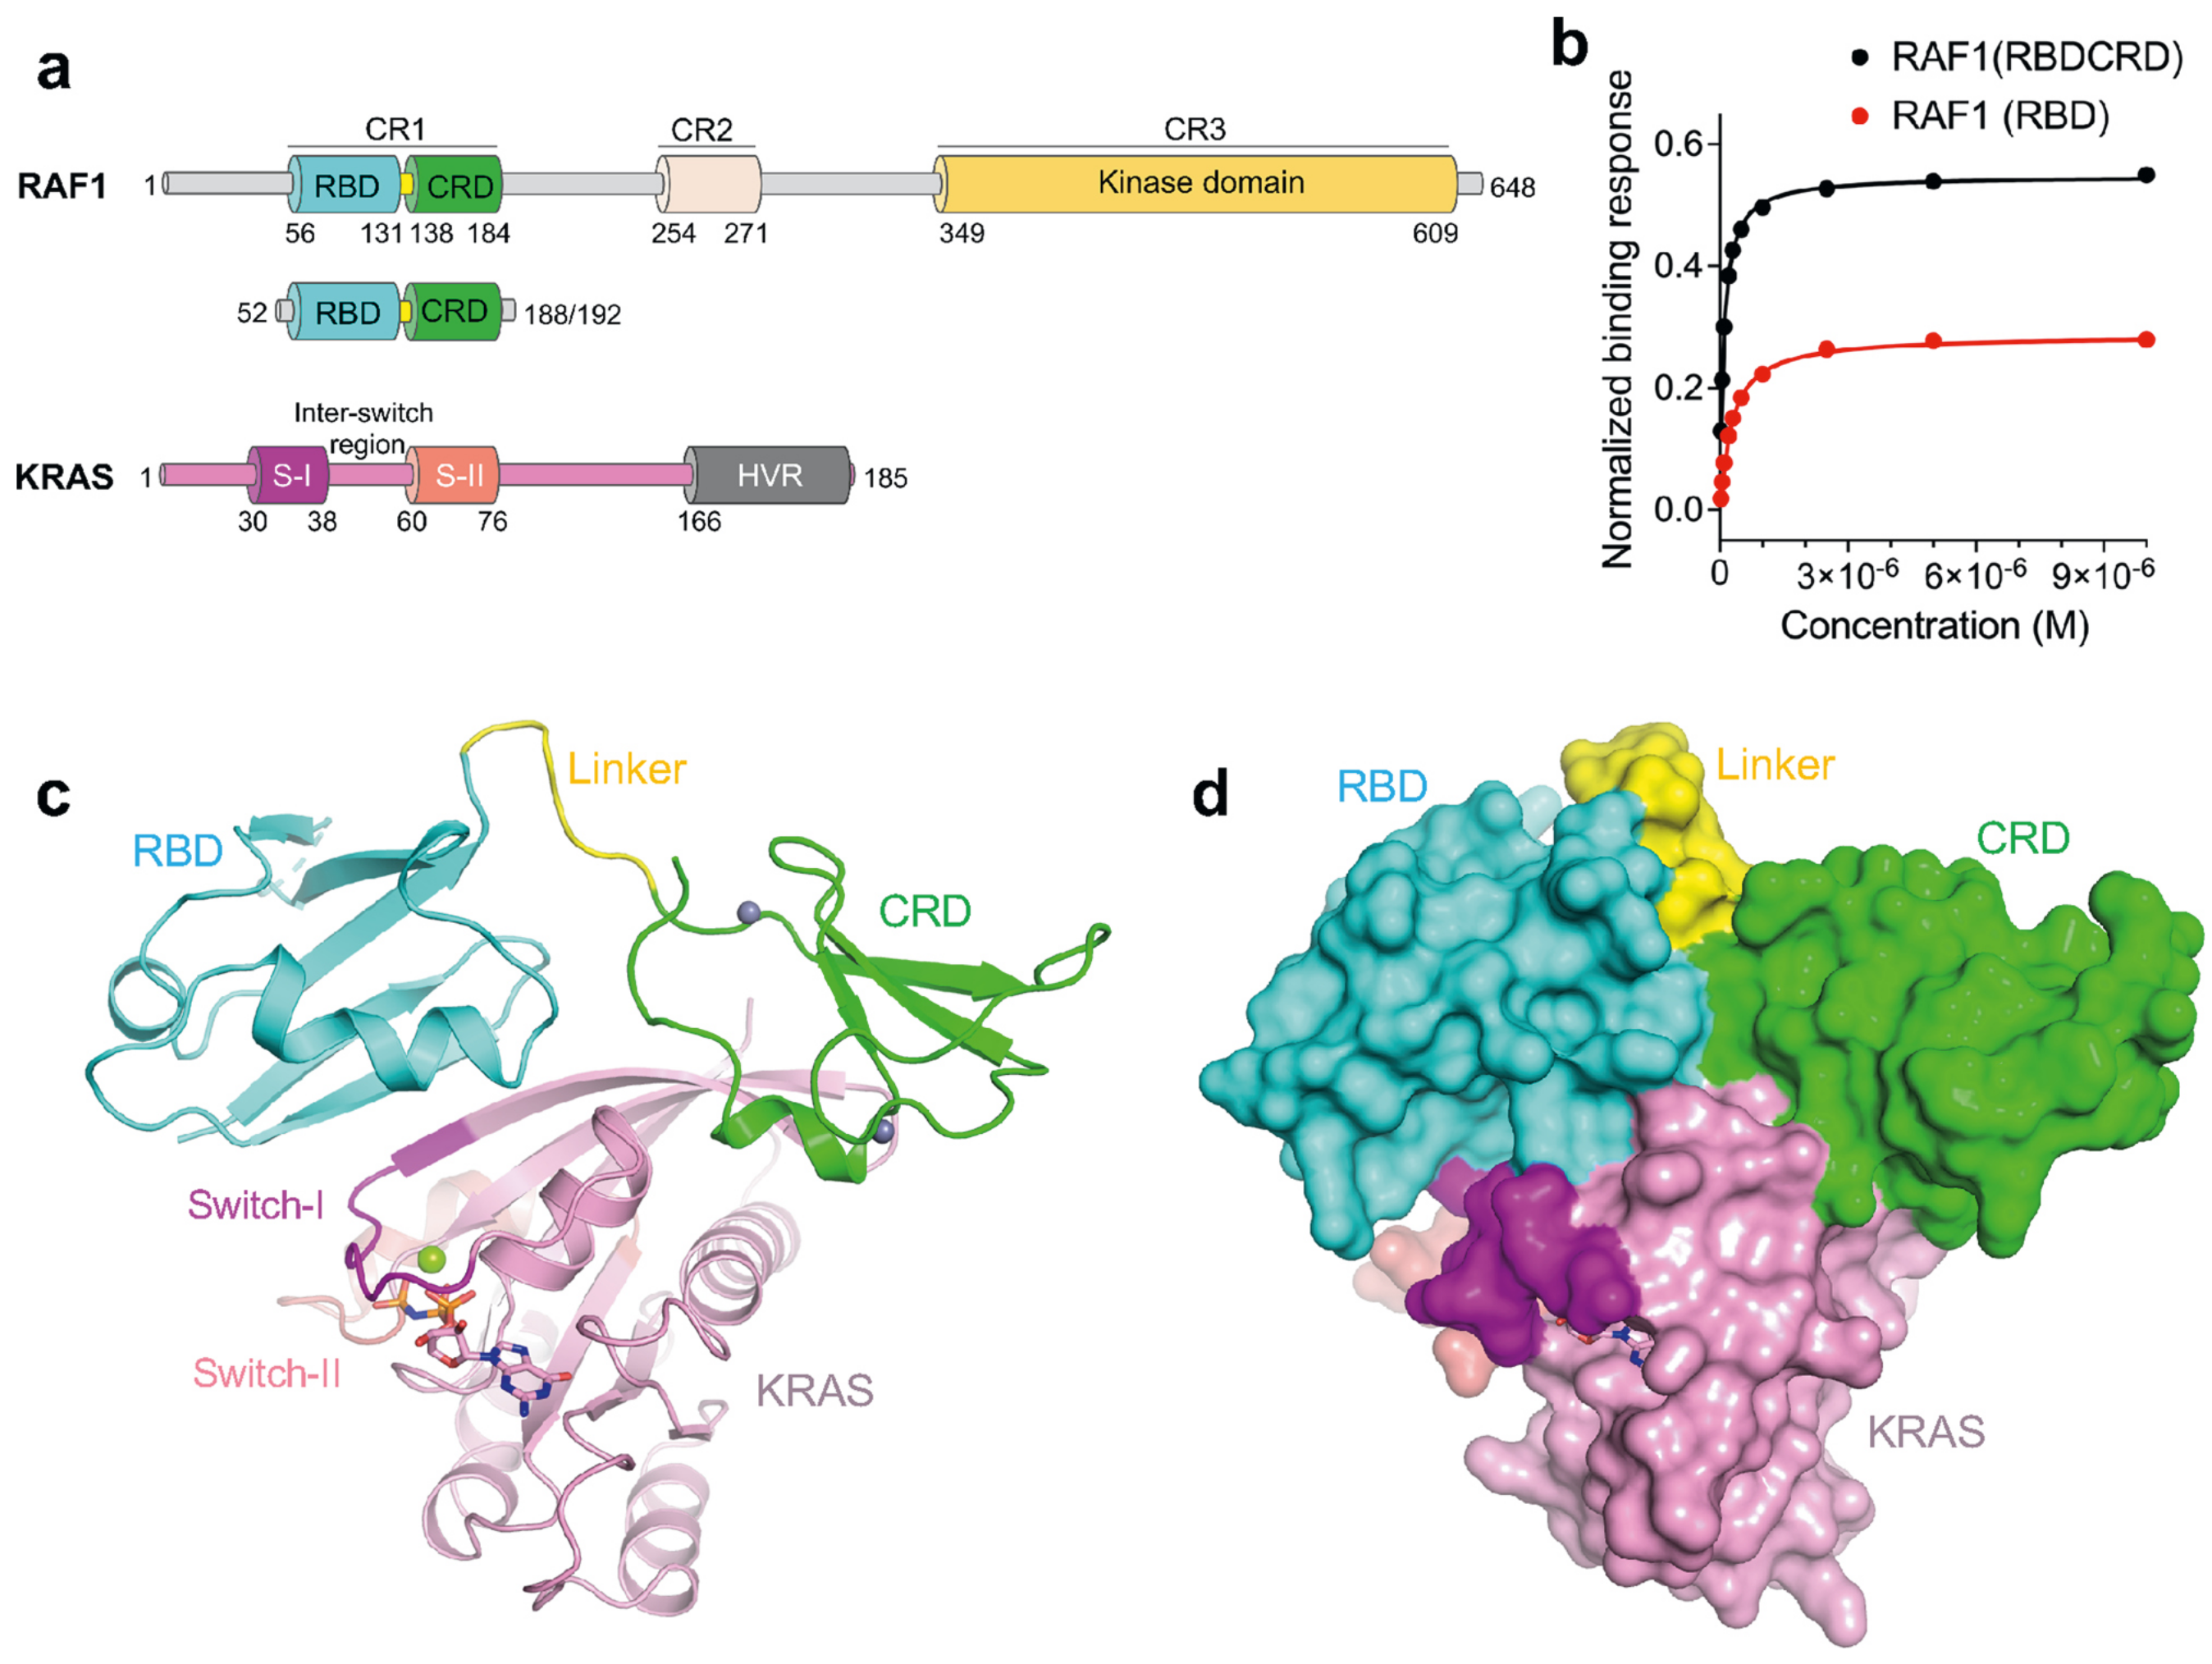
    Diagrams of RAF1 and KRAS proteins showing domains, binding responses, and structural models with labeled regions.

    Figure \(\PageIndex{21}\): Structure of the KRAS-RAF1(RBDCRD) complex and SPR analysis.   Tran, T.H., Chan, A.H., Young, L.C. et al. KRAS interaction with RAF1 RAS-binding domain and cysteine-rich domain provides insights into RAS-mediated RAF activation. Nat Commun 12, 1176 (2021). https://doi.org/10.1038/s41467-021-21422-x.  Creative Commons Attribution 4.0 International License, http://creativecommons.org/licenses/by/4.0/.

    Panel a:  Domain architecture of RAF1 and KRAS. Key domains and their boundaries are shown. The RAF1 construct, containing the RBD and CRD regions used in this study, is shown below the full-length RAF1. The G-domain of KRAS4b(1–169) used in this study contains switch-I (S-I) and switch-II (S-II) regions with the inter-switch region present between them. 

    Panel b: Steady-state binding isotherms derived from the representative SPR experiments used for measuring the binding affinities of RAF1(RBDCRD) and RAF1(RBD) to KRAS-GMPPNP. Source data is provided as a Source Data file. 

    Panels cd: The overall structure of the complex formed by GMPPNP-bound KRAS and RAF1(RBDCRD) in c cartoon, and d surface representations. GMPPNP is shown as sticks, and Mg2+ (green) and Zn2+ (gray) are shown as spheres. KRAS is colored in pink, with the switch I and switch II regions highlighted in magenta and salmon, respectively. RBD, CRD, and the linker present between them are colored cyan, green, and yellow, respectively.

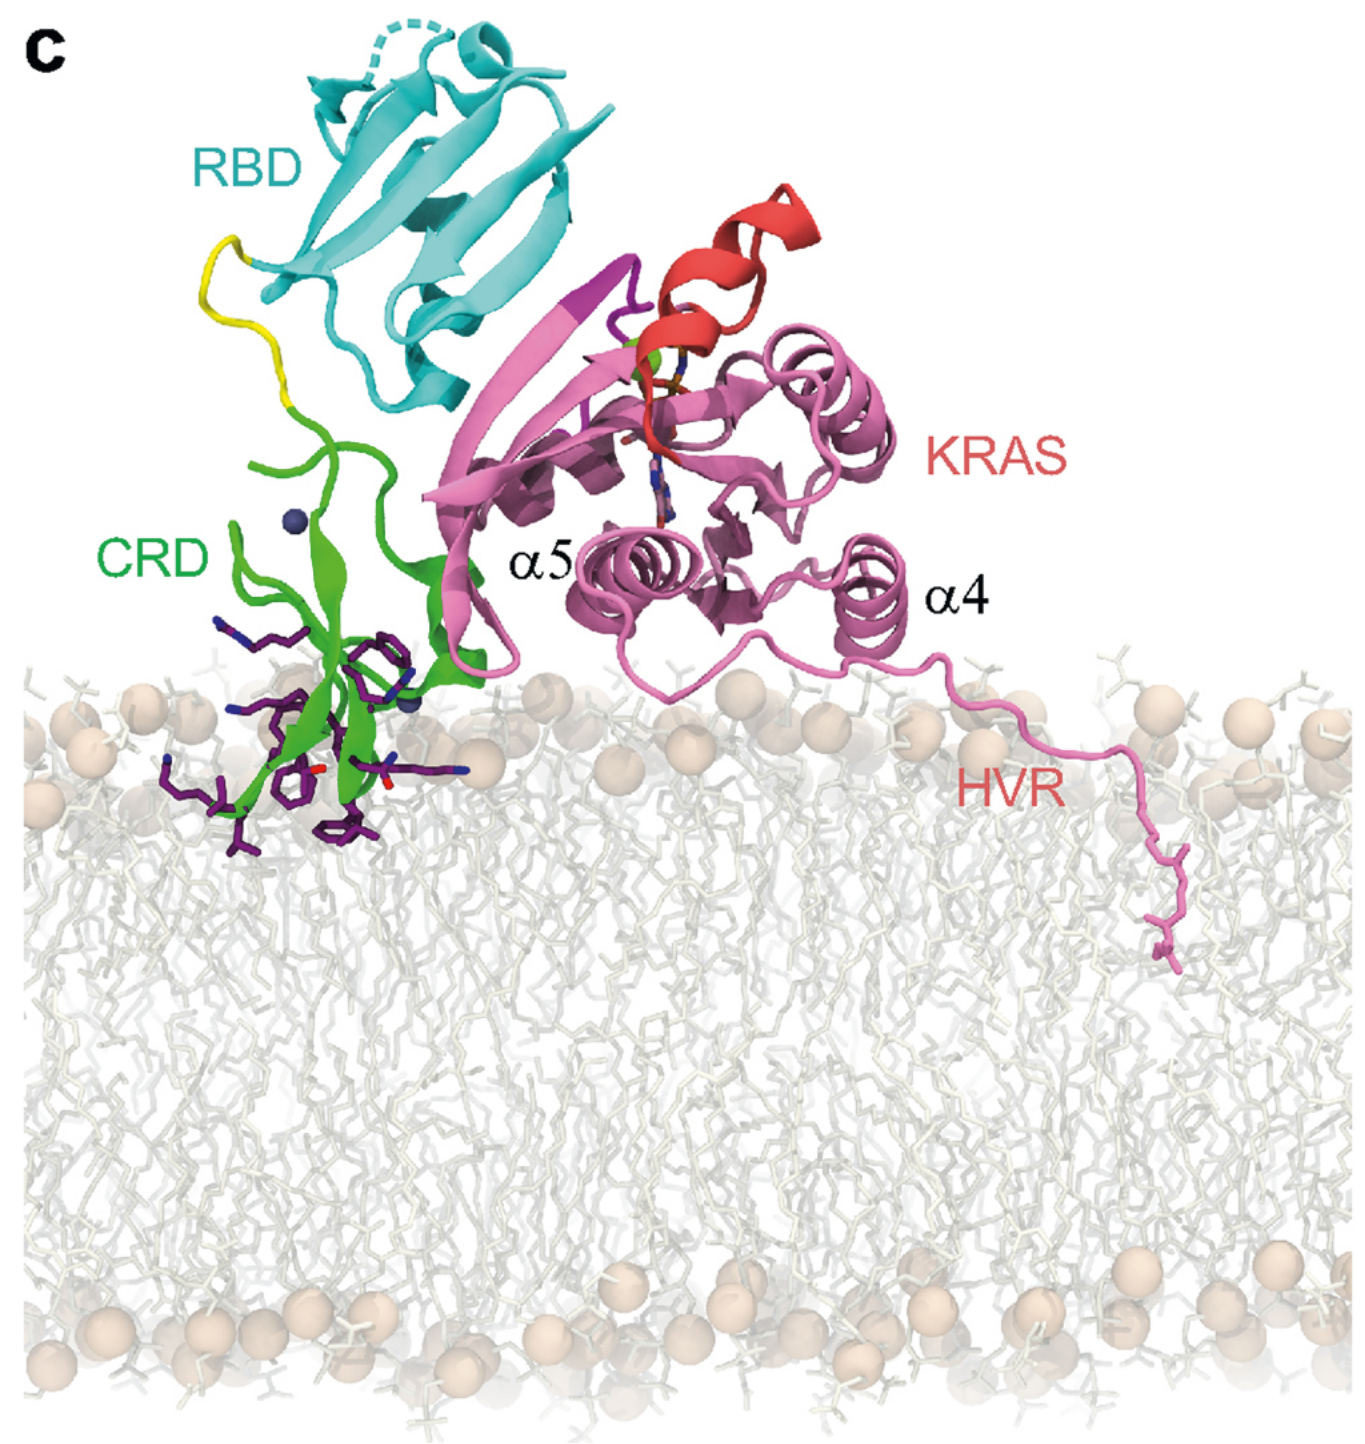
    Figure \(\PageIndex{22}\) shows a model of the CRD-loop-RBD construct from Rak1 and KRas interacting with each other and a membrane bilayer.
    3D molecular structure illustrating protein components: RBD, CRD, KRAS, alpha helices, and HVR above a membrane layer.

    Figure \(\PageIndex{22}\): Membrane-interacting residues in CRD, and a model showing the crystal structure of KRAS-RBDCRD at the membrane.  Tran, T.H., Chan, A.H., Young, L.C. et al. Ibid.

    Crystallographic KRAS-RBDCRD oriented with KRAS helices α4 and α5 in membrane contact, as observed in MD simulations of KRAS28. Lipids are sticks with spheres for headgroup phosphorus atoms; KRAS-RBDCRD has the same color-coding as the preceding figure.

    Side chains of CRD residues 143RKTFLKLAF151 and 157KFLLNGFR164 are sticks with purple carbon atoms. The interaction of helices 4 and 5 in KRas results in the insertion of two CRD loops (143RKTFLKLAF151 and 157KFLLNGFR164) into the membrane.

    Figure \(\PageIndex{23}\) offers a model that shows that binding of an autoinhibited monomer of Raf1 to membrane-associated KRas leads to conformational changes within Raf1 and relief of autoinhibition, allowing Raf1 to dimerize with another Raf (in this case BRaf) also bound to an adjacent membrane-associated KRas.  Before binding to KRas, Raf1 is bound to the dimeric protein 14-3-3 (an adapter protein in some signaling pathways), which interacts with  "phosphorylated serines present in CR2 and CR3, keeping RAF in an autoinhibited state." 
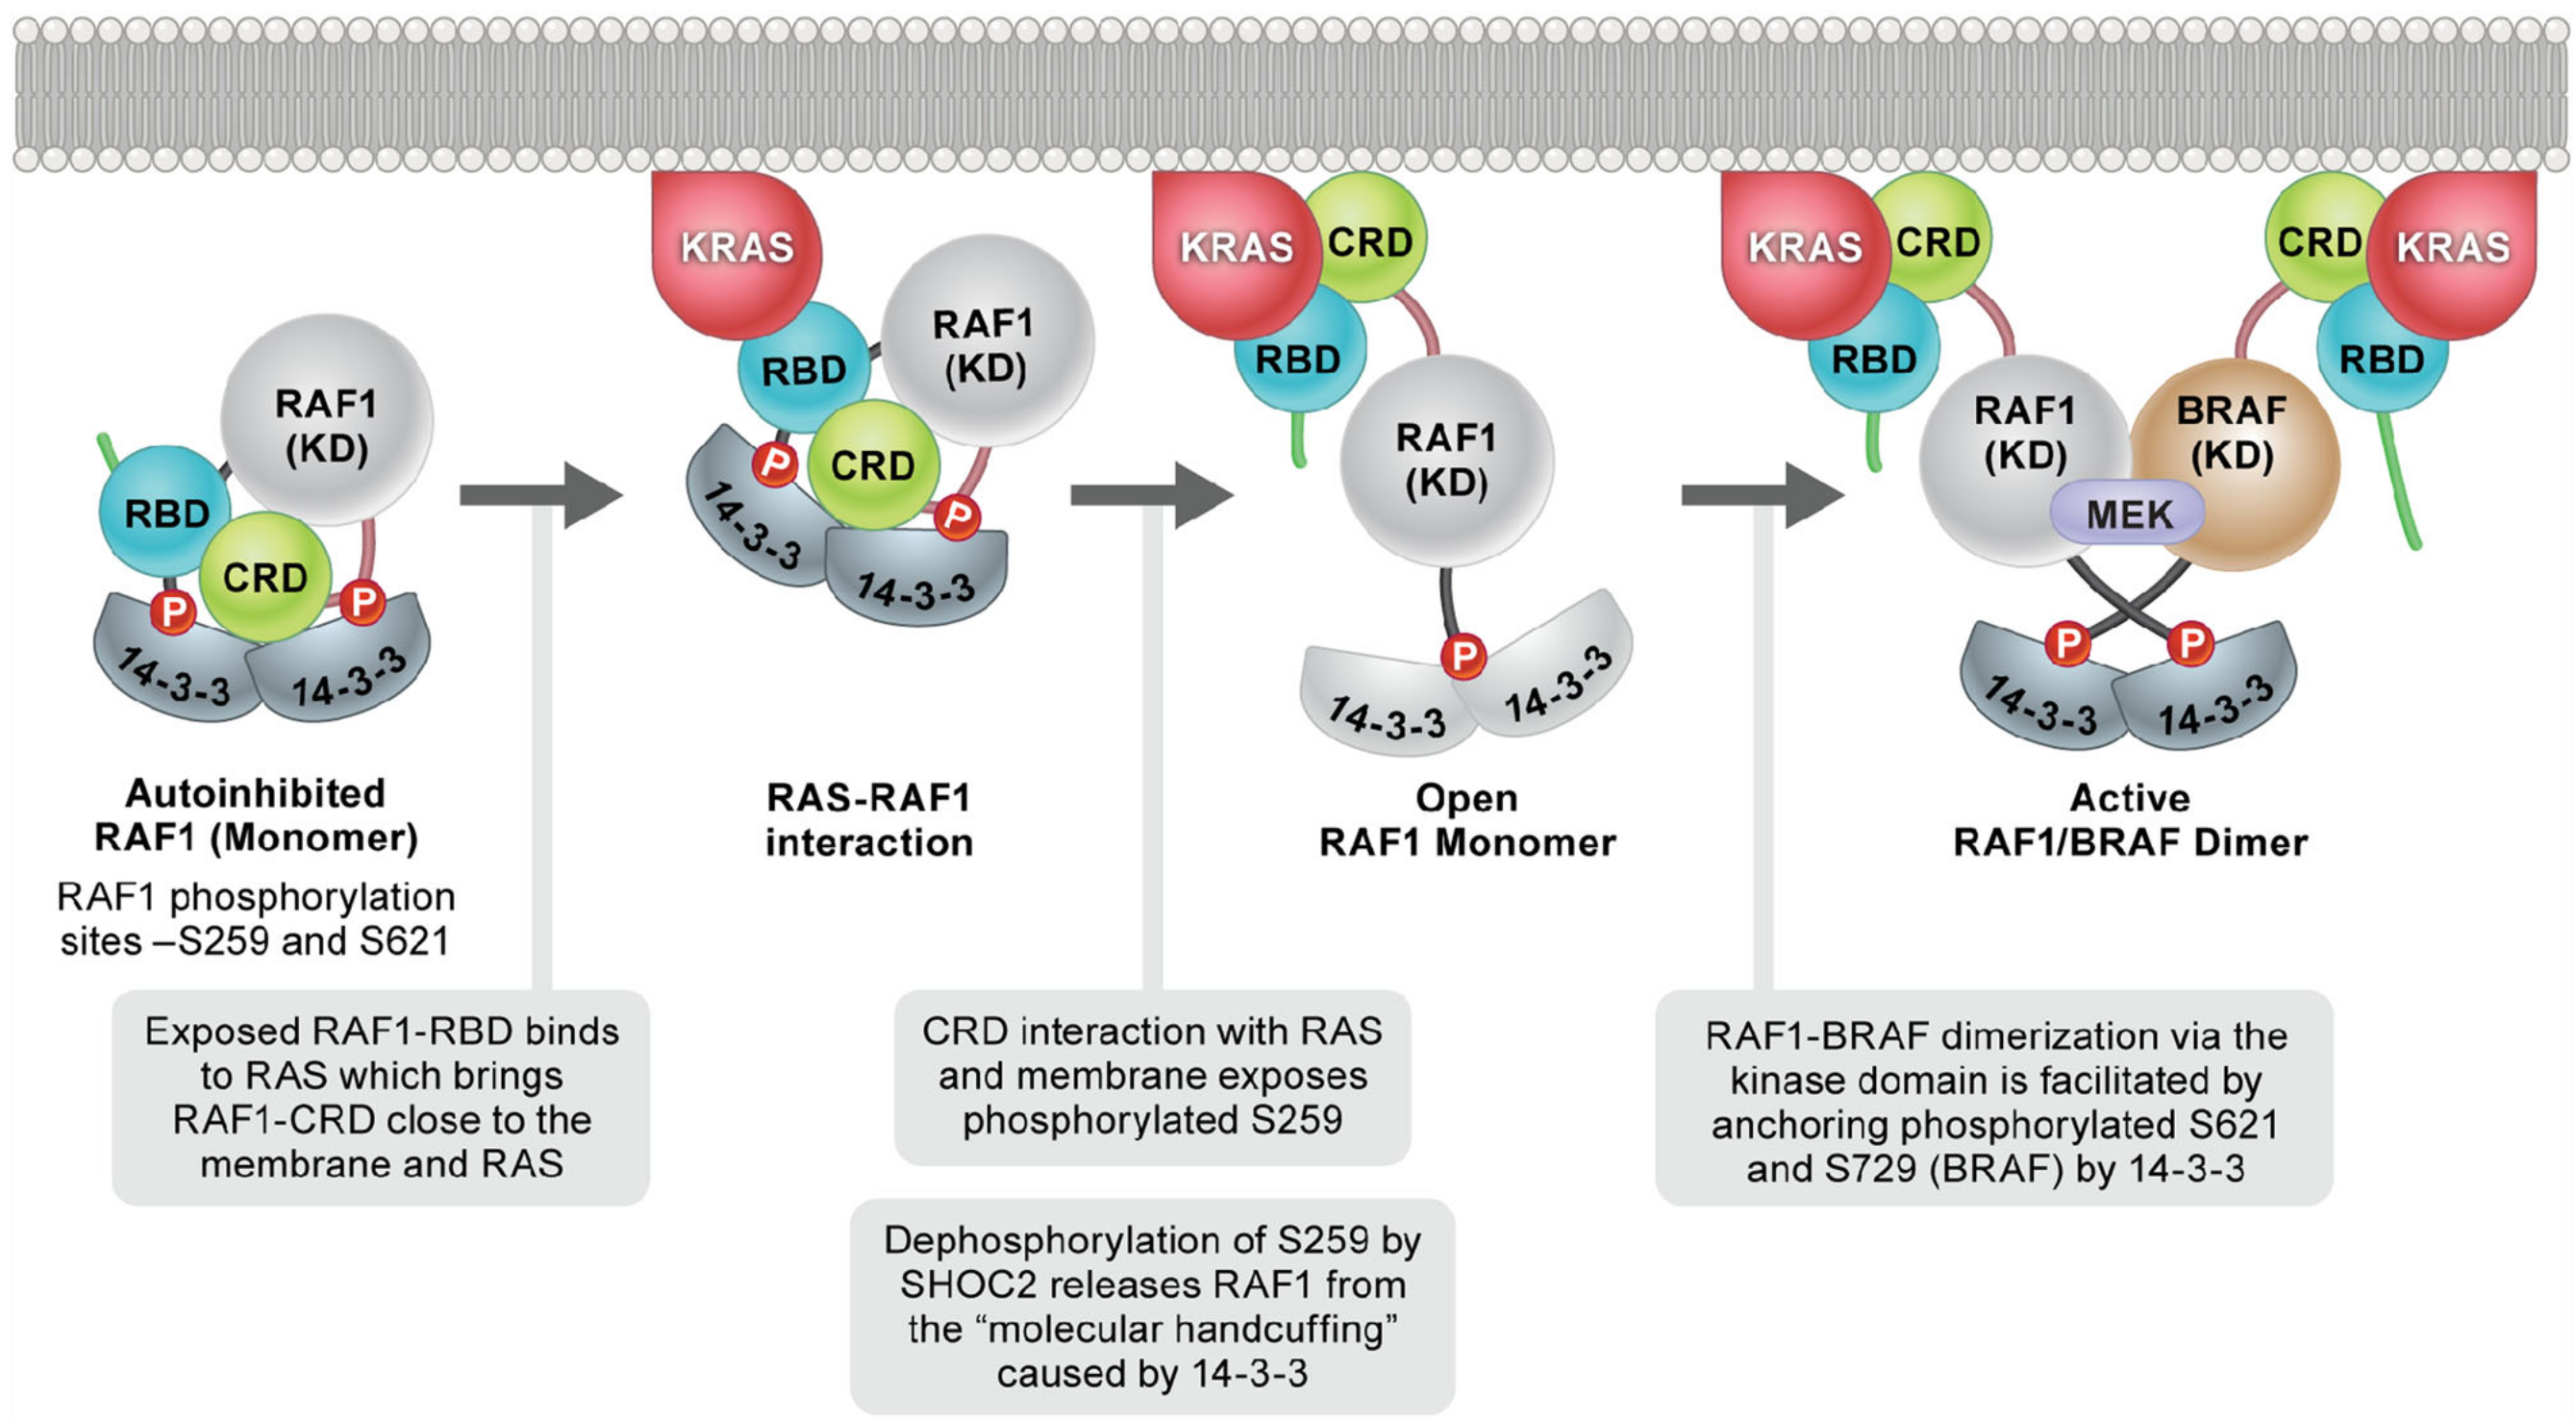
    Diagram illustrating the activation of RAF1 and its interaction with KRAS and BRAF, detailing phosphorylation events and binding sites.

    Figure \(\PageIndex{23}\): Membrane-interacting residues in CRD, and a model showing the crystal structure of KRAS-RBDCRD at the membrane.  Tran, T.H., Chan, A.H., Young, L.C. et al. Ibid. 

    Crystallographic KRAS-RBDCRD is oriented with KRAS helices α4 and α5 in membrane contact, as observed in MD simulations of KRAS. Lipids are sticks with spheres for headgroup phosphorus atoms; Side chains of CRD residues 143RKTFLKLAF151 and 157KFLLNGFR164 are sticks with purple carbon atoms.  Effectively, the interaction between Ras and Raf results in Raf dimerization, thereby activating Raf.

    Further simulations show that additional Ras proteins associate to form a nanocluster of 6-8 Ras proteins at the membrane.   This is illustrated in the bottom left of Figure \(\PageIndex{24}\) below (although the number of Ras monomers is likely overrepresented).
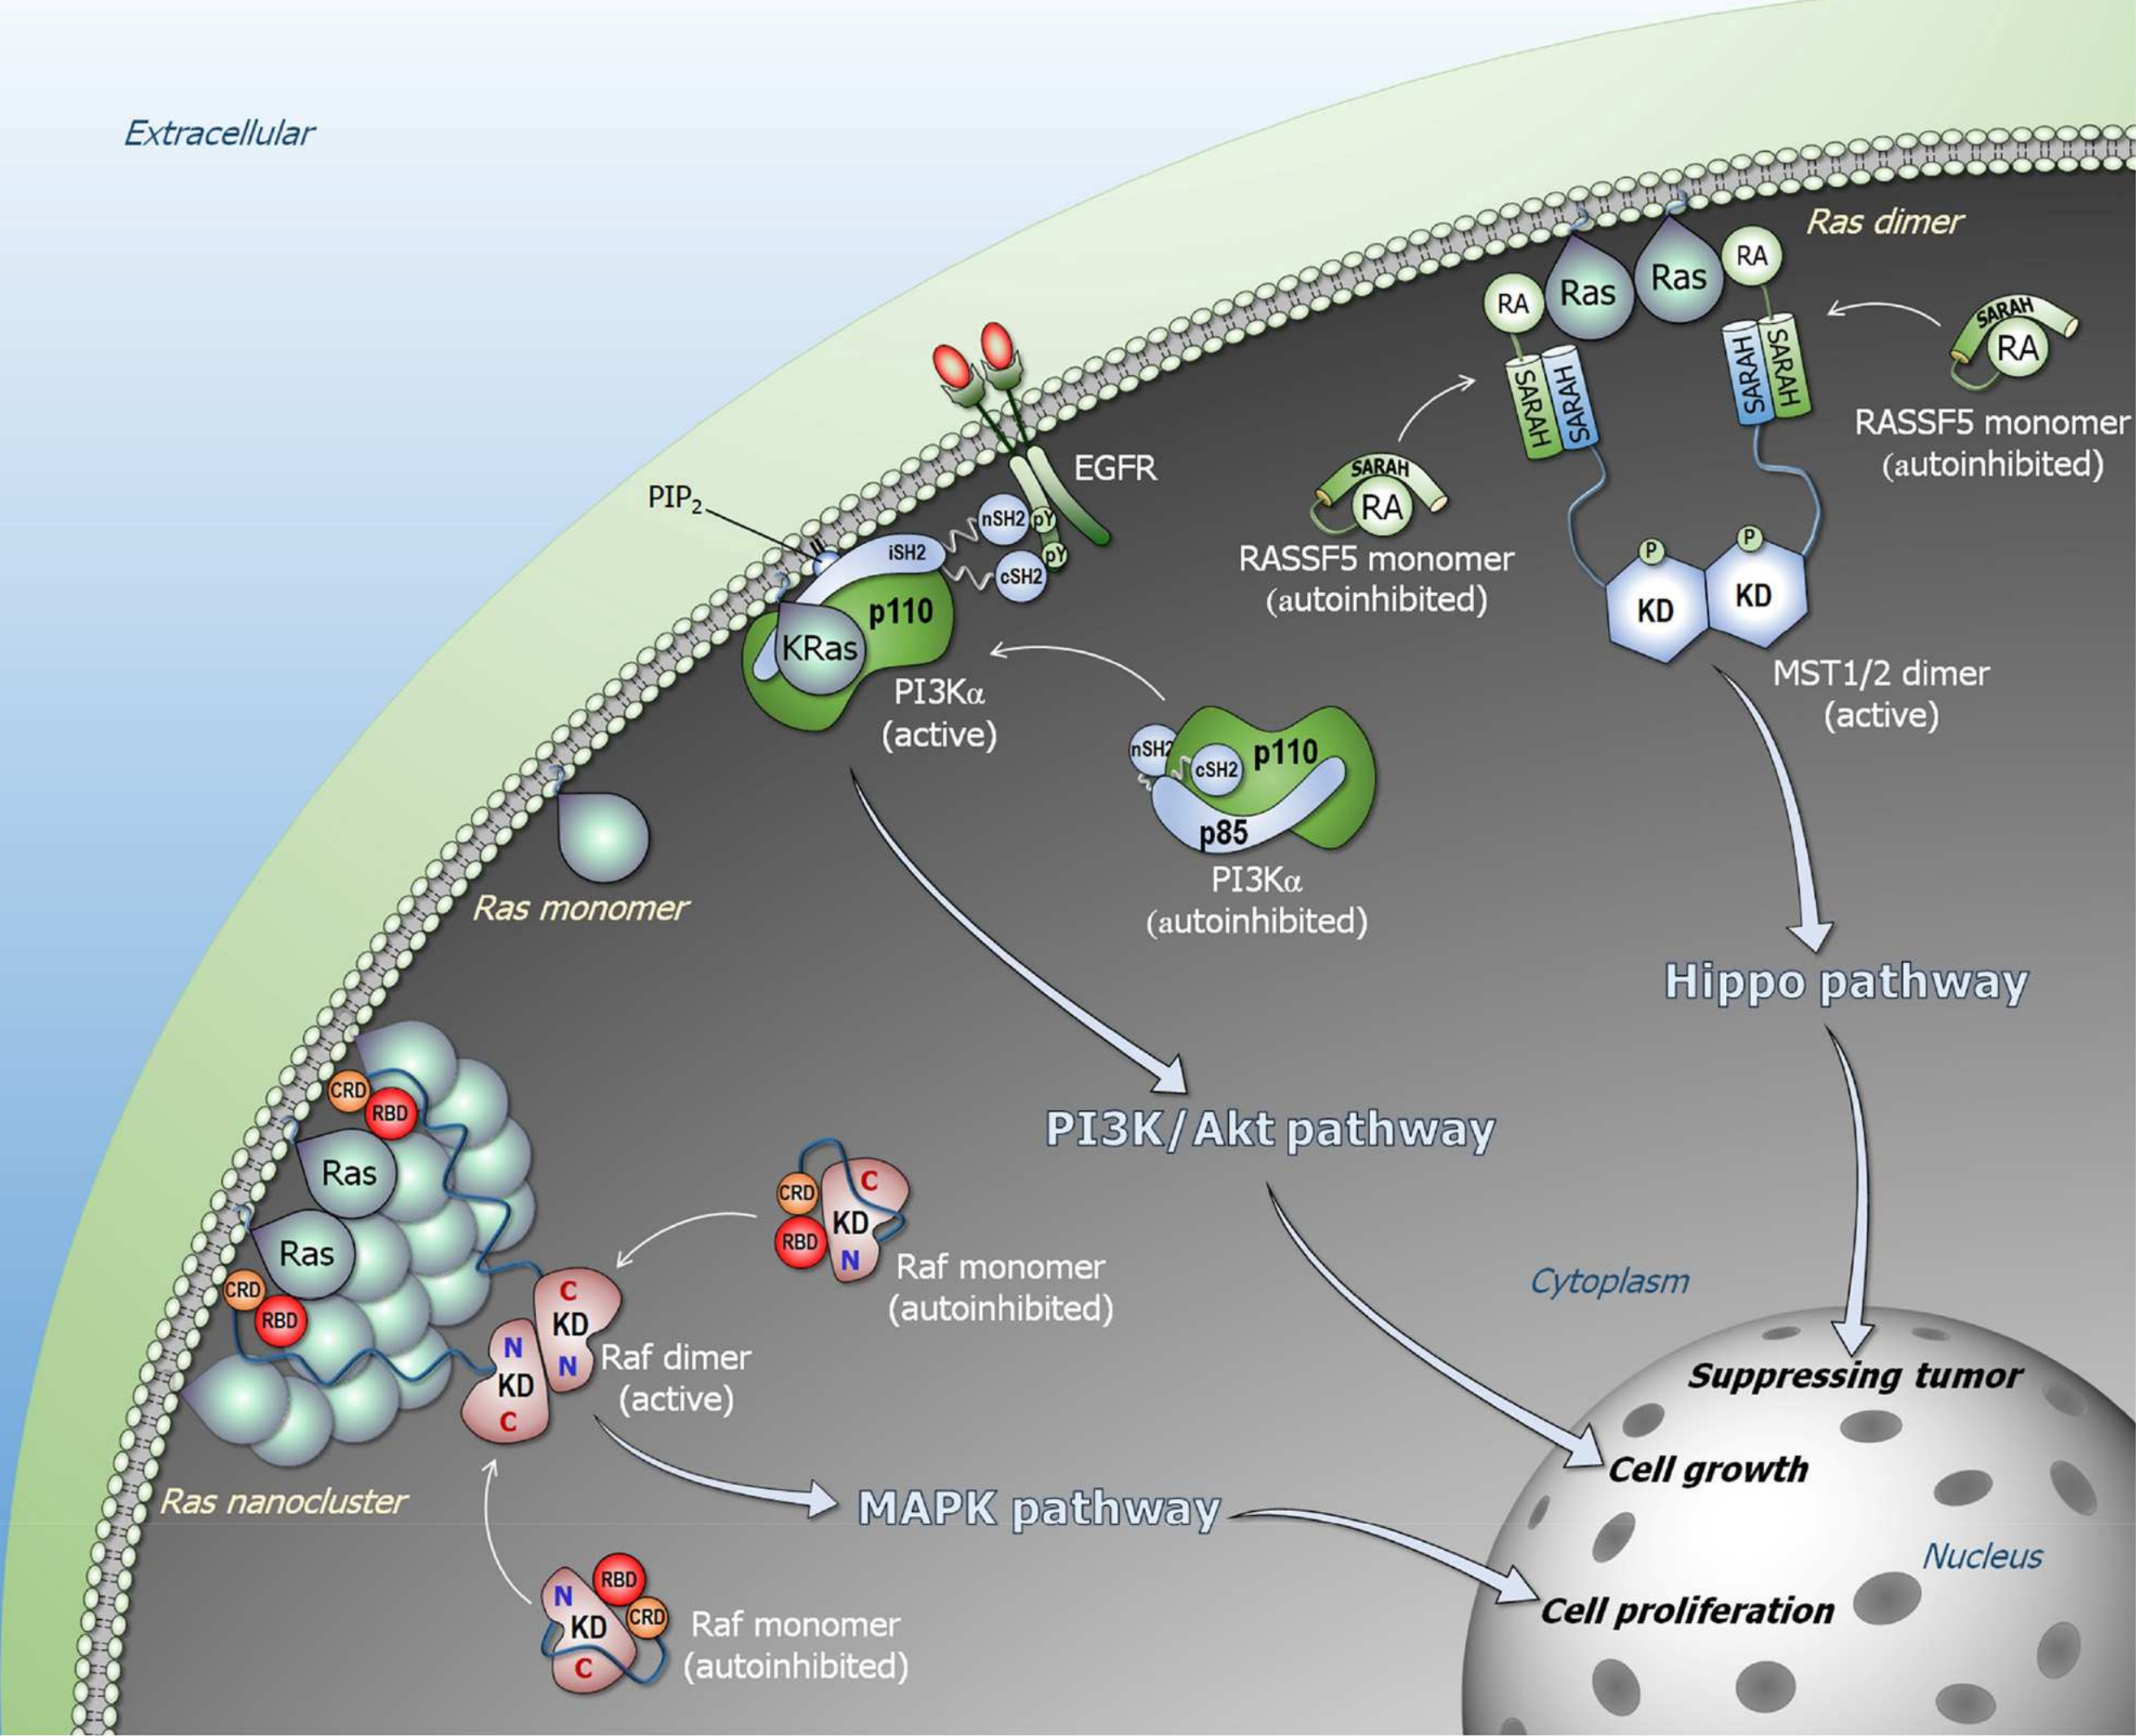
    Diagram illustrating signaling pathways involving Ras, PI3K/Akt, and Hippo, detailing molecular interactions and cellular effects.

    Figure \(\PageIndex{24}\): Ras signaling pathways. Ras forms nanoclusters and promotes Raf dimerization in the Raf/MEK/ERK (MAPK) pathway (lower left). Nussinov R, Tsai C-J, and Jang H (2019). Does Ras Allosterically Activate Raf and PI3K? Front. Oncol. 9:1231. doi: 10.3389/fonc.2019.01231.   Creative Commons Attribution License (CC BY)

    A similar mechanism underlies the activation of the membrane-associated kinase PI3Kα by Ras, as illustrated in the middle of the figure above (this is also described in more detail in Figure 15). The autoinhibited (or latent) form of PI3Kα converts to an active form on binding to the autophosphorylated cytoplasmic domain of the EGFR.  Ras does not allosterically activate PI3Kα per se, but when bound to PI3Kα, it prolongs its active state at the membrane, thereby facilitating extended signaling. 

    Post-translational Modification of Ras

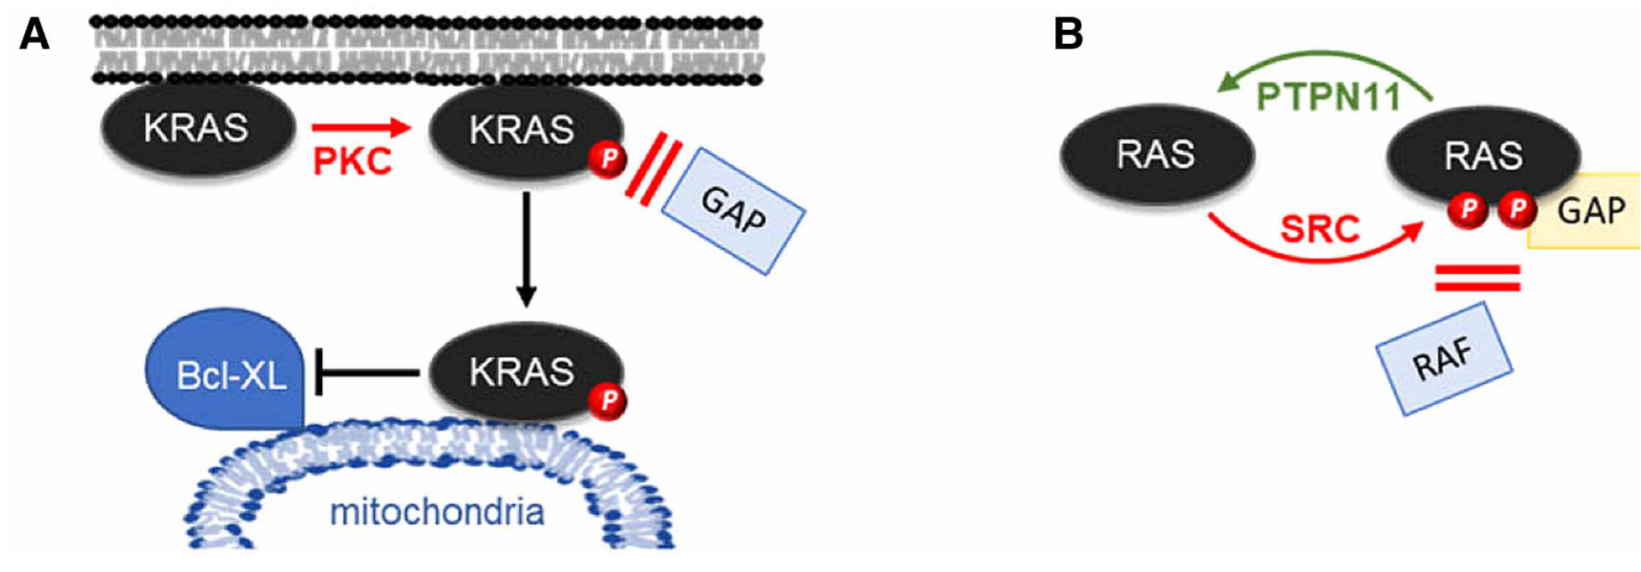
    You might have guessed that Ras can be further regulated by post-translational modifications, in addition to lipidation.   Two examples are shown in Figure \(\PageIndex{25}\) below.  

    Diagram illustrating signaling pathways involving KRAS and RAS, highlighting interactions with PKC, Bcl-XL, PTPN11, SRC, and RAF.

    Figure \(\PageIndex{25}\): RAS regulation by posttranslational modifications. 

    Panel (A): Protein kinase C (PKC) phosphorylation of KRas at S181 in the polybasic region (lowering the net positive charge on that region).  This keeps KRas activated by preventing GAP binding.  It also induces mitochondrial translocation of KRas, which promotes apoptosis by binding to and inhibiting the anti-apoptotic Bcl-XL protein.

    Panel (B): SRC (a protein kinase) can also phosphorylate tyrosines 32 and 64.  This inhibits Ras by interfering with RAF binding and promoting association with GAPs.  Kolch W, Berta D, Rosta E.  Ibid.

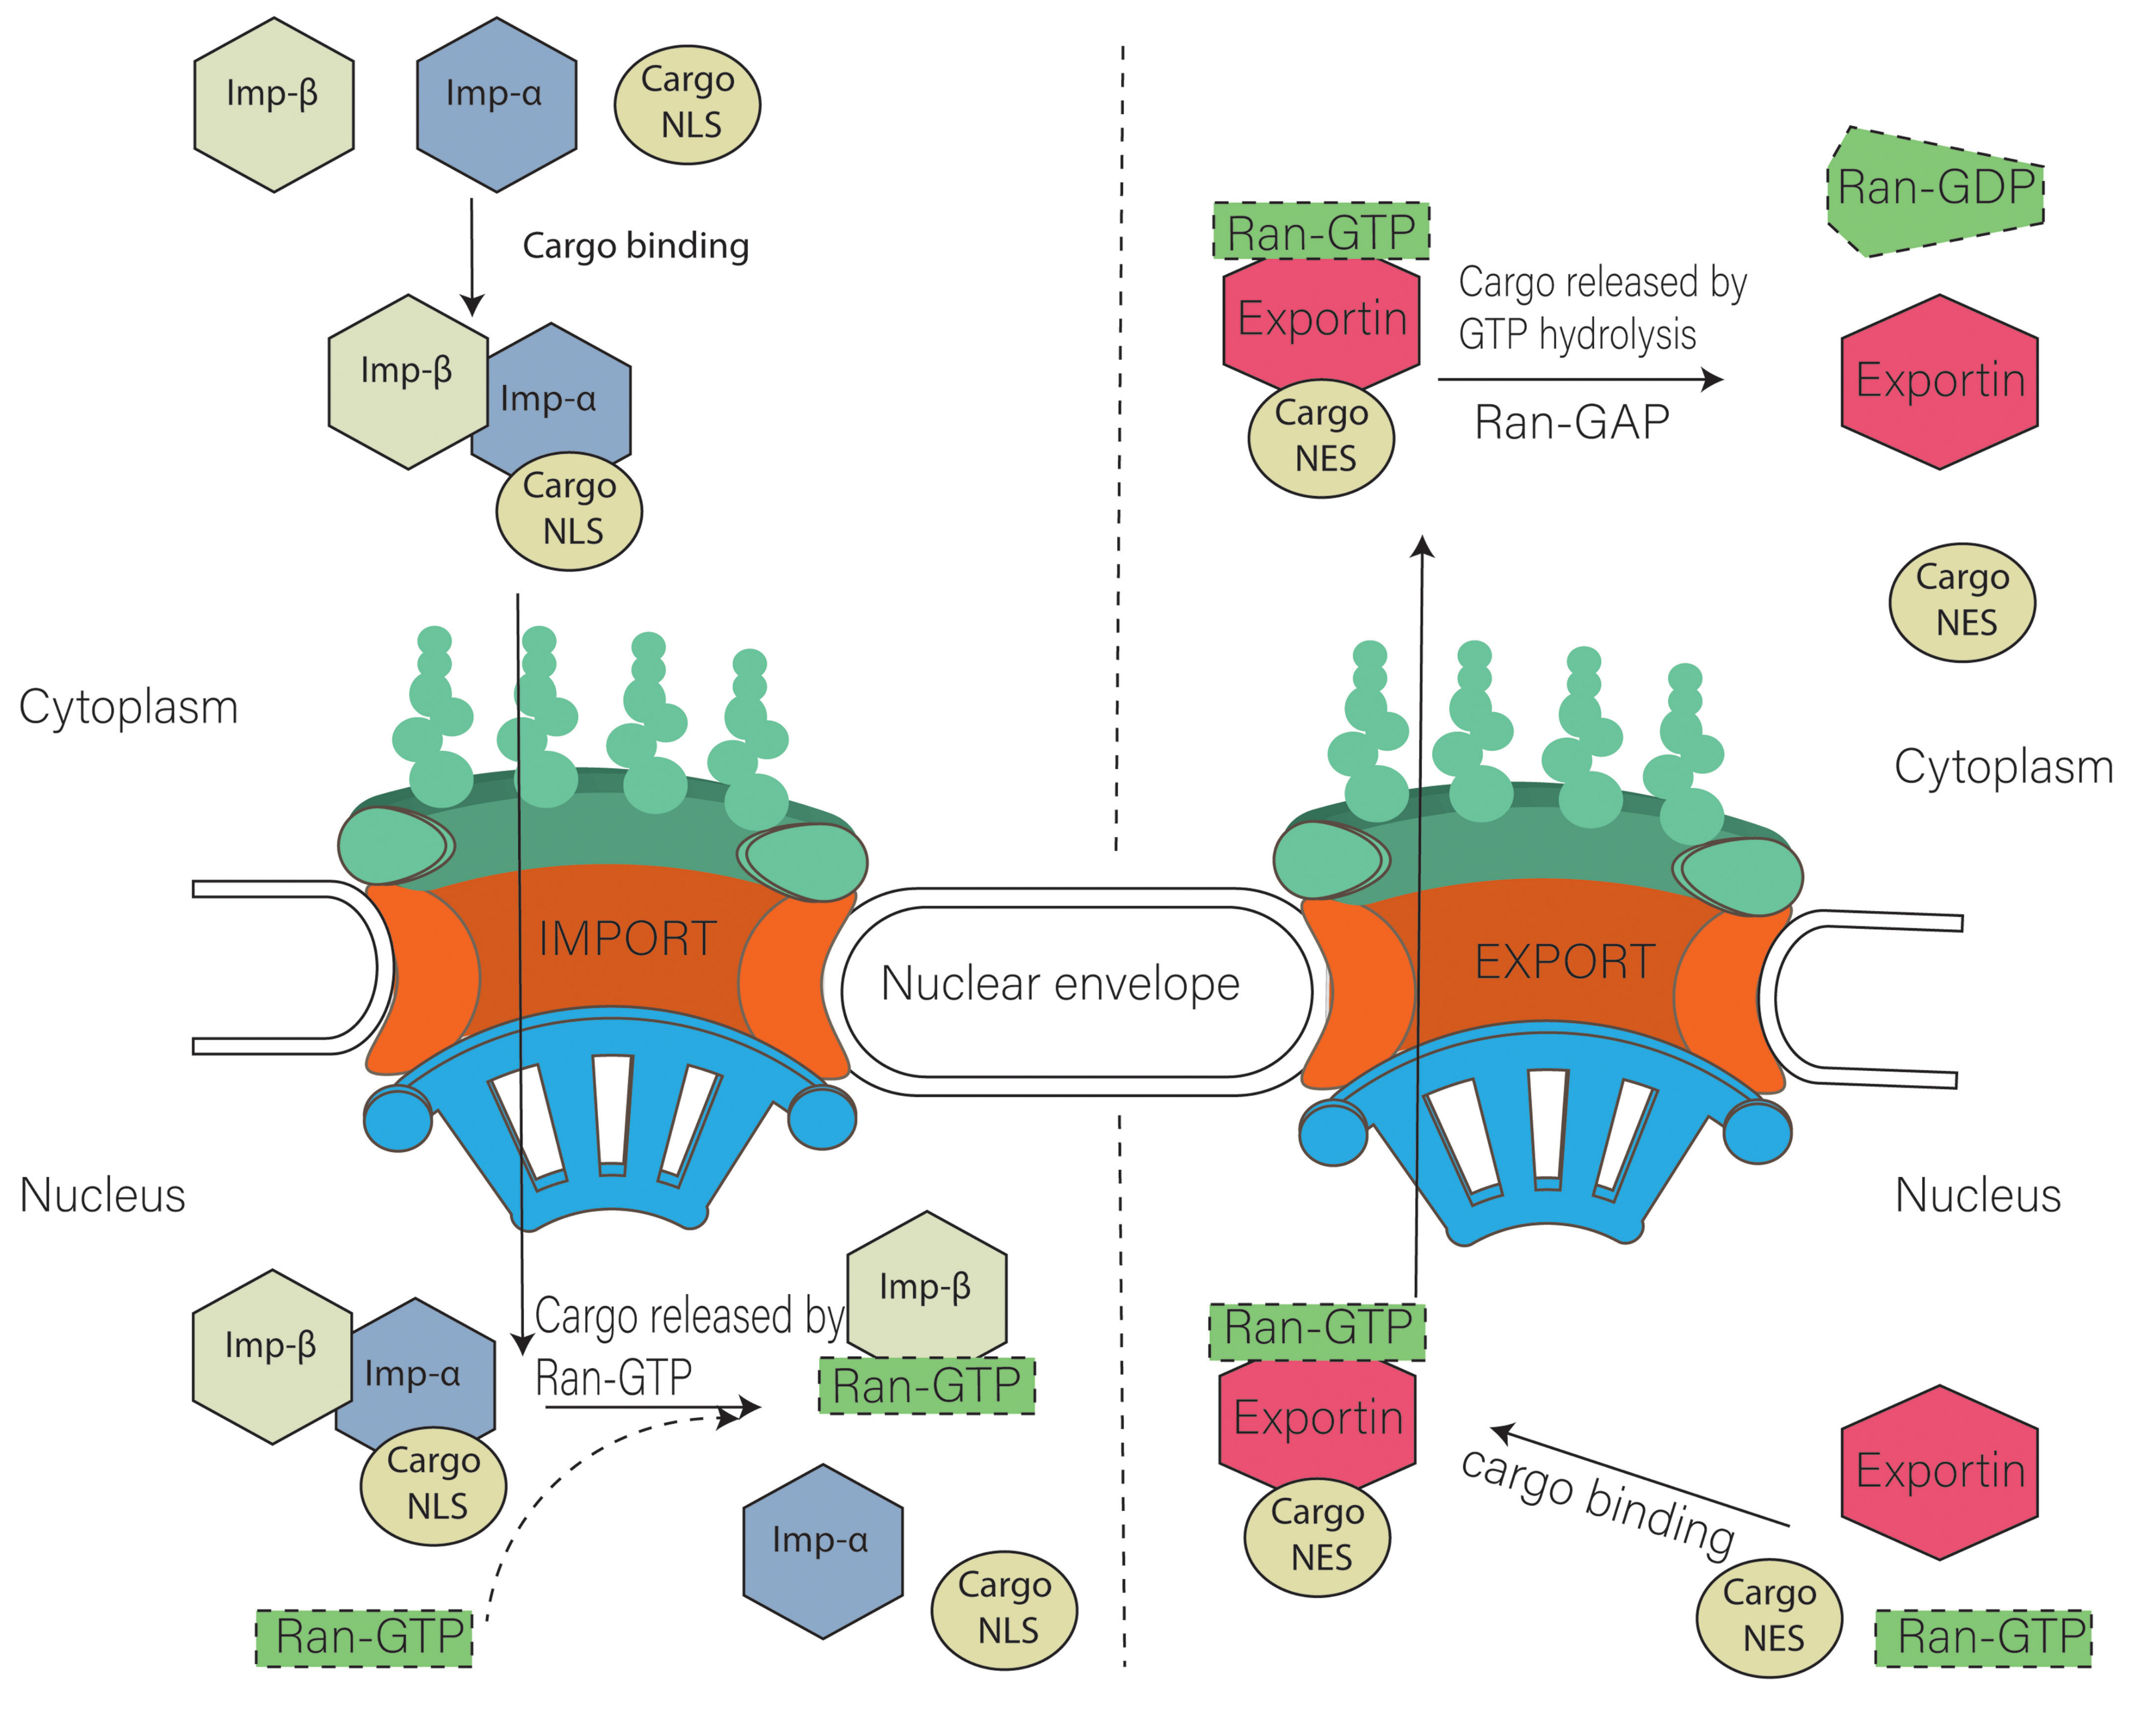
    Before leaving this chapter section, let's review one more small G protein, Ran.  Ran acts as a mediator of protein movement across the nuclear membrane, as discussed in Chapter 11.5.  It's mainly in the GDP-bound form in the cytoplasm and the GTP-bound form in the nucleus. It switches between a cytoplasmic GDP- and a nuclear GTP-bound state by nucleotide exchange and GTP hydrolysis. Nuclear import receptors with bound cargo protein containing a nuclear import signal bind RAN-GTP in the nucleus, leading to the release of importin and the cargo protein. In contrast, cargo proteins with a nuclear export signal bind exportins and RAN-GTP in the nucleus and move into the cytoplasm, where the RAN-bound GTP is hydrolyzed on binding a RAN-GAP. This cycle is illustrated in Figure \(\PageIndex{26}\).

    Diagram illustrating nuclear transport, detailing import and export mechanisms involving proteins, Ran-GTP, and cargo binding.

    Figure \(\PageIndex{26}\): Model of nuclear import and export. Cargo containing NLS (Nuclear localization signal) is imported with the help of Importin α and Importin β heterodimer. Nuclear export of cargo containing a NES (nuclear export signal) is facilitated by exportins. Ran GTP is also required during that process. Khan Asmat Ullah, Qu Rongmei, Ouyang Jun, Dai Jingxing. Front. Physiol., 03 April 2020 | https://doi.org/10.3389/fphys.2020.00239. Creative Commons Attribution License (CC BY).

    Summary

    (Summary written by Claude, Sonnet 4.6, Anthropic)

    Small G proteins are universally conserved molecular switches that cycle between an active GTP-bound state and an inactive GDP-bound state, regulating diverse cellular processes from proliferation and cytoskeletal organization to vesicle trafficking and nuclear transport. The ~150-member human Ras superfamily shares a conserved ~20 kDa GTPase domain organized around five G-elements: the P-loop (G1) coordinates phosphate binding; Switch I (G2) and Switch II (G3) are flexible loops that undergo large conformational changes upon GTP vs. GDP binding to create the active and inactive states; and G4/G5 recognize the guanine base and confer subtle allosteric differences among isoforms.

    The intrinsic GTPase activity of Ras is very poor, making regulatory proteins essential. GTPase-activating proteins (GAPs) insert an arginine finger (Arg789 in RasGAP) into the Ras active site to stabilize the pentavalent transition state for GTP hydrolysis, dramatically accelerating GTP cleavage and signal termination. GDP dissociation from Ras is equally sluggish (koff ~10⁻⁵ s⁻¹, half-life ~0.8 days), effectively locking Ras in the inactive state unless a guanine nucleotide exchange factor (GEF) intervenes. The GEF SOS inserts an α-helix that displaces Switch I and destabilizes nucleotide contacts in Switch II, opening the binding site for rapid GDP departure. Because cellular GTP concentrations greatly exceed GDP, GTP preferentially rebinds to reactivate Ras. The large numbers of GEFs (~80) and GAPs (~70) for just the 20 Rho family members illustrate how this regulatory architecture provides spatially and temporally precise control over G protein activity in response to diverse signals.

    Ras is activated downstream of receptor tyrosine kinases through a defined adaptor cascade: EGF binding induces EGFR dimerization and autophosphorylation on cytoplasmic tyrosines, recruiting the SH2-domain adaptor GRB2, which uses its SH3 domains to recruit cytoplasmic SOS to the membrane, where it activates membrane-targeted Ras. Membrane targeting of Ras requires post-translational lipidation—farnesylation at Cys186 and palmitoylation at additional cysteines in the C-terminal hypervariable region—that directs distinct Ras isoforms to different cellular membranes (plasma membrane, Golgi, ER, mitochondria), generating spatially distinct signaling waves. Once activated, RasON engages at least 12 classes of downstream effectors; the best-characterized is RAF1, which binds through its Ras-binding domain (RBD) while its cysteine-rich domain (CRD) inserts into the membrane bilayer, relieving 14-3-3-mediated autoinhibition and enabling RAF1-BRAF heterodimerization and MAPK pathway activation. Ras also prolongs PI3Kα activity at the membrane, and forms nanoclusters of 6–8 molecules that amplify downstream signaling.

    Dysregulation of the Ras cycle is among the most common events in human cancer: missense mutations at G12 (G12C, G12S, G12V), G13 (G13D), or Q61 (Q61H) sterically block arginine finger insertion by GAPs or disrupt the catalytic water orientation, locking Ras in the RasON state in ~20% of all human cancers (KRAS mutated in ~75% of Ras-mutant tumors). For decades Ras was considered "undruggable." The covalent inhibitor sotorasib (AMG 510) exploits the unique nucleophilicity of the G12C-mutant cysteine to irreversibly occupy the Switch II pocket adjacent to the GDP-binding site—effective for KRAS G12C but not other mutations. The recently approved daraxonrasib (RMC-6236) takes a completely different approach: rather than binding Ras directly, it acts as a molecular glue that noncovalently recruits cyclophilin A (CypA) to wild-type and mutant RasON. Drug binding allosterically reshapes CypA's surface into a neomorphic interface that occupies the conserved SWI/SWII effector-binding lobe of RasON—the same surface used by downstream targets including RAF and PI3K—thereby competitively inhibiting signaling from all major oncogenic Ras variants. This exploits the tumor cell's oncogene addiction (constitutively elevated RasON) while sparing normal cells where Ras is only transiently active. Beyond the Ras subfamily, the Ras superfamily illustrates how a single molecular switching mechanism—GTP binding and hydrolysis regulated by GAPs and GEFs—has been adapted for diverse cellular functions including cytoskeletal control (Rho), vesicle trafficking (Rab, Arf), and nuclear transport (Ran, where the RanGTP/RanGDP gradient across the nuclear envelope drives both importin-mediated cargo import and exportin-mediated cargo export).


    This page titled 28.5: Small G proteins, GAPs and GEFs is shared under a not declared license and was authored, remixed, and/or curated by Henry Jakubowski and Patricia Flatt.