15.1: Insulin Signaling in the Liver
- Page ID
- 15013


Introduction
In this section, we will discuss insulin signaling and glycogen synthesis. Insulin is released in the fed state, and leads to glucose uptake where it can be stored, if not needed, for glycogen synthesis. Recall that glycogen is a large polymer of glucose residues connected in the main chain by alpha 1 → 4 linkages and with branching side chains about every 12 – 15 residues at the alpha 1 → 6 positions. The reducing ends of the carbohydrate (two for each polymer) are connected to the glycogenin dimeric protein at the center of the macromolecule (Figure \(\PageIndex{1}\)). With the branching nature of the polymer, many non-reducing ends of the molecule are present, allowing easy access and fast release of glucose for energy utilization.
Most of the body’s pools of glycogen are stored in the liver, with 10% of the liver biomass in glycogen granules, and in the skeletal muscle, with glycogen comprising 2% of the biomass of the muscle. Each glycogen polymer may have upwards of 30,000 glucose residues, making the glycogen polymer visible using standard microscopic techniques. Storage of glycogen within muscle tissue is used by the muscle cells as a source of energy to fuel muscle contraction. In the liver, the purpose of glycogen storage is different. Glycogen stored at this location is used to maintain the homeostatic balance of blood glucose levels. The liver is the primary organ that can actively transport glucose into the bloodstream. Our only other major source of glucose within the blood is our diet.

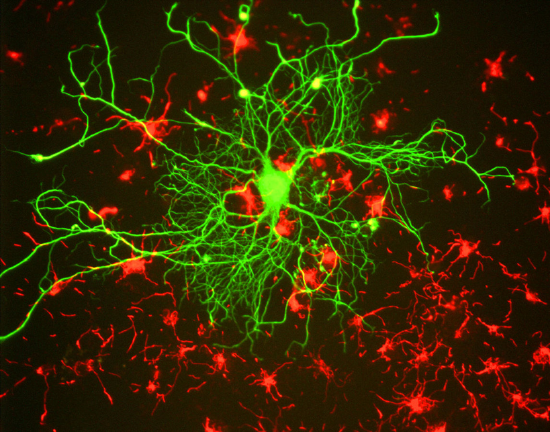
Blood glucose homeostasis is critical for brain function (Figure \(\PageIndex{2}\)). The brain has a huge energy demand, but nearly zero storage of key energy molecules required for ATP production. Furthermore, glucose and ketone bodies are the only energy sources that can pass the blood-brain barrier and be utilized by the brain for ATP production. Note that ketone bodies are only produced during starvation, or disease states such as diabetes, and are not a regular source of energy for the brain. Thus, glucose is critical for brain function. Nearly 10% of the whole body’s energy is used for nerve impulse transmission by the brain. If blood flow to the brain carrying critical oxygen and glucose is impeded, people will lose consciousness within approximately 20 seconds! And brain death/permanent damage occurs within 4 minutes of blood flow cessation. This exemplifies the importance of the liver in maintaining blood glucose levels, as well as the importance of oxygen maintenance.
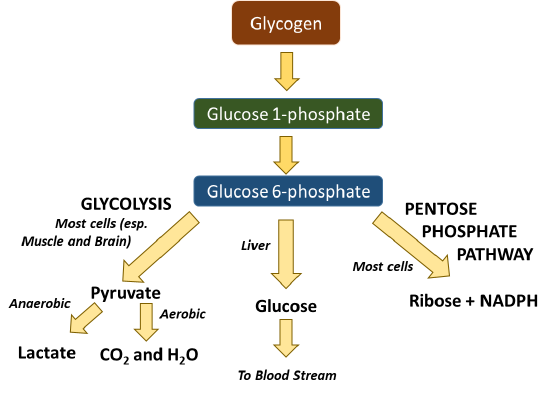
Glycogen in the liver or muscle can be broken down into glucose 1-phosphate (Figure \(\PageIndex{3}\)). This can be interconverted to glucose 6-phosphate which is then readily used in many cellular processes. The process of glycolysis (or the breakdown of glucose into pyruvate) occurs in all cells and produces a small amount of ATP in the process. Further processing of pyruvate can occur anaerobically (or in the absence of oxygen) to produce lactate, or the process can continue to occur in the aerobic pathway to complete oxidation to carbon dioxide and water in the Kreb cycle. Note that oxygen from breathing is used to create the water within this pathway. This fuels the process of oxidative phosphorylation within the mitochondria and produces large quantities of ATP (from 30-36 molecules/glucose). Within the liver, glucose can be freed from glycogen and released back into the bloodstream to maintain homeostatic levels. Glucose 6-phosphate can also be utilized as a precursor for other major macromolecules such as ribose and deoxyribose, as well as the hexosamine compounds commonly found cushioning joints or attached to proteins of the plasma membrane.
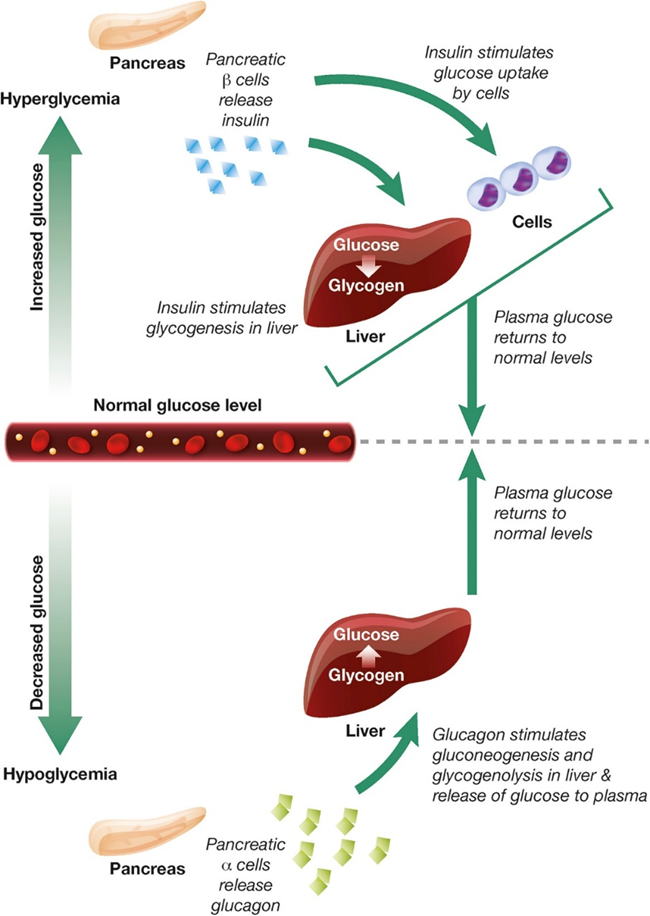
In healthy individuals, hormone signaling is critical to maintaining blood glucose homeostasis. Within this system, the hormones glucagon and insulin work together to maintain normal plasma glucose levels ( Figure \(\PageIndex{4}\)). During hyperglycemia, pancreatic beta (β) cells release insulin, which stimulates glucose uptake by energy-consuming cells and the formation of glycogen in the liver. During hypoglycemia, pancreatic alpha (α) cells release glucagon, which stimulates gluconeogenesis and glycogenolysis in the liver and the release of glucose to the plasma.
The first area we will focus our attention on will be the mechanism utilized by insulin to reduce blood glucose levels. Figure \(\PageIndex{5}\) shows the structure of the pancreas and its anatomical relationship with the liver and the stomach. The pancreas is the sensor organ that detects blood glucose levels. It is responsible for signaling to the liver to either remove or release glucose in response to changing levels. Notably, the pancreas also produces most of the digestive enzymes utilized by the body, including proteases, amylases, and lipases.
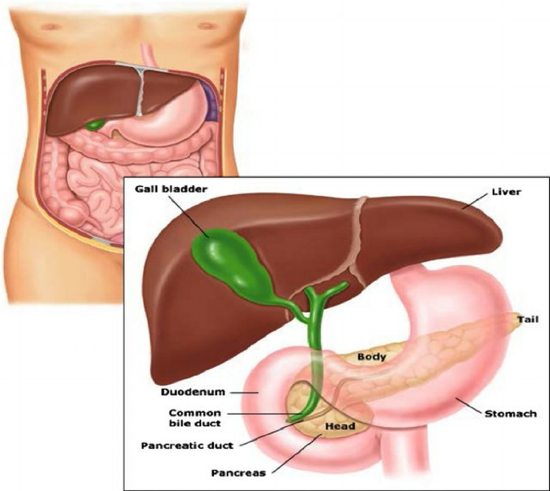
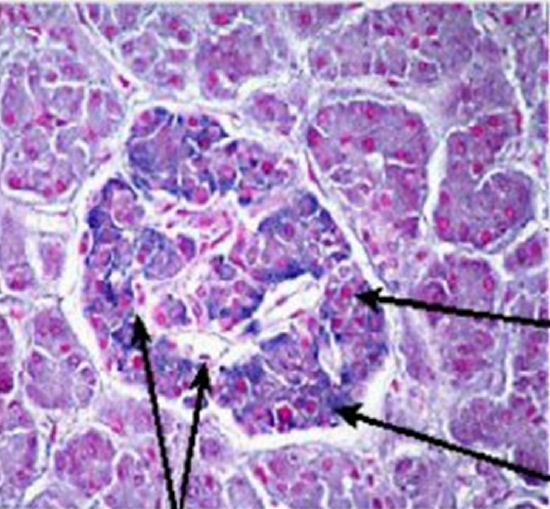
Figure \(\PageIndex{6}\): shows a light microscope image of the pancreatic islet cells. They are responsible for the production of glucagon and insulin. The islets are distinguished from the surrounding tissue by a continuous connective tissue capsule and extensive vascularity.
Insulin is a peptide hormone composed of 51 amino acids as shown in Figure \(\PageIndex{7}\). It is initially synthesized as preproinsulin, which is converted to proinsulin after the signal peptide is removed. Two disulfides are made in the ER (catalyzed by protein disulfide isomerase) along with selective proteolytic cleavage to form insulin. Mature insulin consists of A and B chains that were connected in proinsulin by the C-peptide.

Figure \(\PageIndex{7}\): Conversion of preproinsulin to mature insulin. Vasiljević, J. et al. Diabetologia 63, 1981–1989 (2020). https://doi.org/10.1007/s00125-020-05192-7. http://creativecommons.org/licenses/by/4.0/.
Figure \(\PageIndex{8}\) shows interactive iCn3D models of human insulin (3I40) and human proinsulin (2KQP). (Copyright; author via source). Click the image for a popup or use the external link provided:
| Human insulin (3I40) | Human Proinsulin (2KQP) |
|
Colored code to show secondary structure External link: https://structure.ncbi.nlm.nih.gov/i...A3QZdZpfEMxR17 |
The "future" A chain in mature insulin is shown in magenta, the C-peptide connecting the A and B chains is shown in yellow, and the future B chain is in cyan. External link: https://structure.ncbi.nlm.nih.gov/i...nQJXhrEfHD1GH9 |
.png?revision=1&size=bestfit&width=364&height=276)
.png?revision=1&size=bestfit&width=538&height=273)
The maturation of preproinsulin to insulin is shown in more detail in Figure \(\PageIndex{9}\). The peptide is first translated on ribosomes linked to the rough endoplasmic reticulum (ER), where a signal peptide docks the peptide to the ER membrane. The proinsulin is folded and the signal peptide is cleaved. It is transported to the Golgi where it is further packaged into secretory vesicles. Within the secretory vesicles, the proinsulin is cleaved to release the C-peptide. The A and B peptides are held together by disulfide bridges and form the active insulin component.
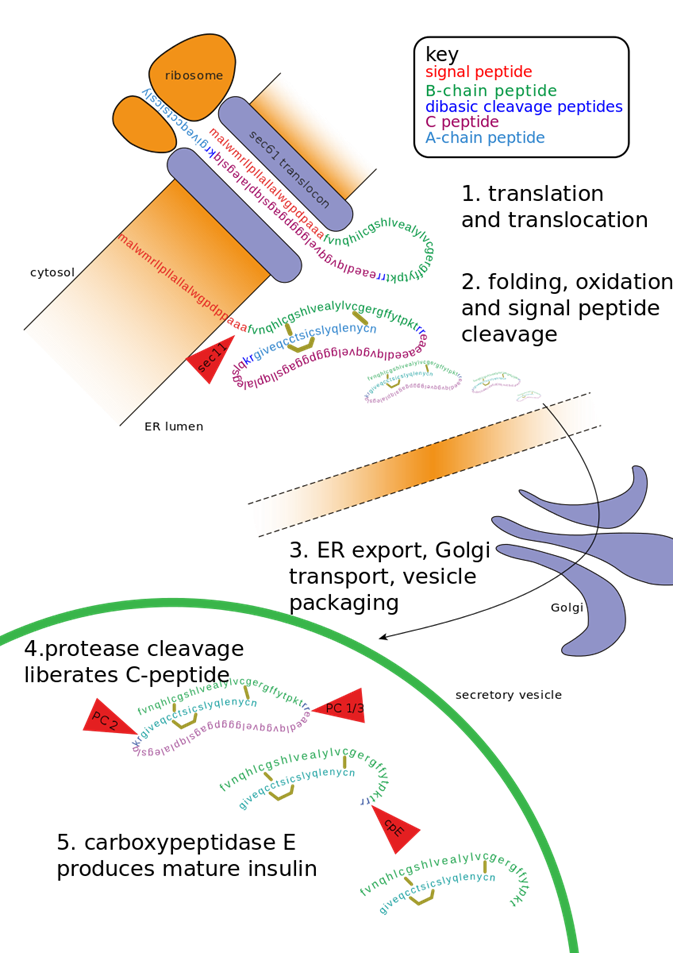
The C-peptide is a bioactive peptide secreted at the same time and in equimolar amounts to the insulin hormone. It also has a longer half-life than insulin and is excreted by the kidneys into the urine, making detection easy. Furthermore, it allows for the detection of patient-produced insulin, even if they are receiving insulin injections. Thus, C-peptide detection is often utilized to help distinguish between patients with type 1 diabetes from patients with type 2 diabetes (or Maturity onset diabetes). Details about the different forms of diabetes will be discussed in greater detail later.
Once insulin is released from the pancreas, it travels throughout the body and binds with cellular targets that contain the insulin receptor. The Insulin Receptor is a tyrosine kinase receptor that dimerizes upon insulin binding, as shown in Figure \(\PageIndex{10}\). Insulin receptors are located on most cell types throughout the body causing pleiotropic effects during insulin response. Primary targets of insulin action are the liver, where it promotes the uptake of glucose and the production of the glycogen storage molecule, as well as skeletal muscle and fat. The tyrosine kinase portion of the receptor located on the internal side of the plasma membrane is quite flexible.
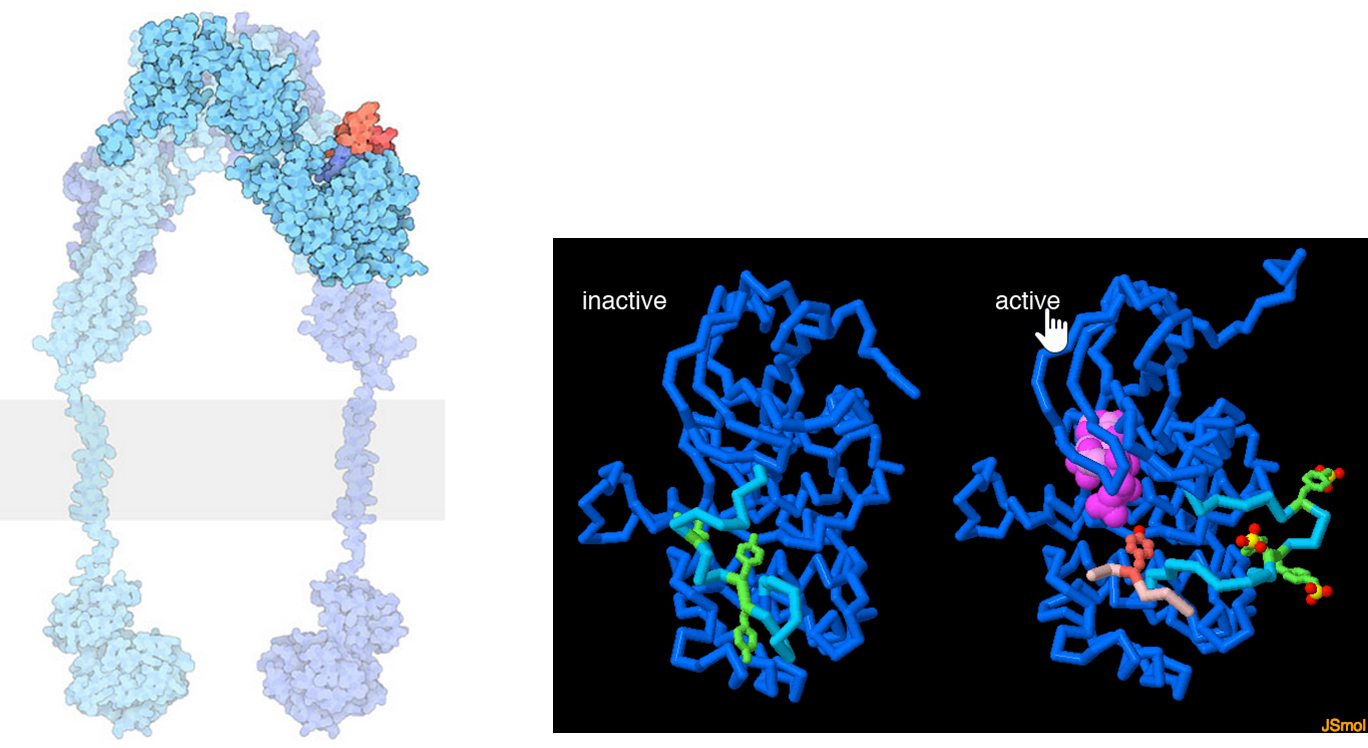
The lefthand diagram shows a space-filling model of the activated insulin receptor dimer embedded into the plasma membrane (shown as the gray bar). The tyrosine kinase portion of the receptor is shown on the inside of the cell whereas the insulin binding domain is present on the external side of the plasma membrane. The middle and right-hand diagrams show the inactive (middle) and active forms (far right) of the tyrosine kinase domain of an insulin receptor monomer. When activated the tyrosine kinase domain binds to ATP (hot pink) and phosphorylates downstream targets, including several of its tyrosine residues (green). In the inactive state (middle), a mobile loop (turquoise) binds in the ATP binding site and prevents ATP association. When the insulin receptor is activated, the mobile loop opens, allowing for the binding of ATP and self-phosphorylation of tyrosine residues, as well as other signaling proteins (a small peptide from one is shown in light pink).
Figure \(\PageIndex{11}\) below which shows an interactive iCn3D model of the Full-length mouse insulin receptor bound to four insulins (7SL7).
.png?revision=1&size=bestfit&width=410&height=475)
 Figure \(\PageIndex{11}\): Full-length mouse insulin receptor bound to four insulins (7SL7). (Copyright; author via source). Click the image for a popup or use this external link: https://structure.ncbi.nlm.nih.gov/i...gkTrtvaqQF6o2A
The receptor is a dimer (one monomer gray and the other light brown). Four insulins are bound in maximally activated insulin receptors. Two insulins (magenta) are bound at the same respective place in each monomer (site-1, the primary site) and the two others are bound at a second parallel site (site-2). The full active state is a symmetric T-shape. Less active receptors have fewer bound insulins with receptor geometry more asymmetric (one insulin bound at site 1 gives a Γ-shaped conformation, while two produce a Ƭ-shaped conformation as the second insulin binds). When 4 insulins are bound at both sites, the asymmetric conformation can't be formed. Although the structure is described as full-length, both monomers end at amino acid 910. The single membrane-spanning alpha-helix membrane occurs at amino acids 947-967 and is NOT shown in the model.
Activation of the insulin receptor in the liver when insulin is present initiates a phosphorylation signaling cascade, as shown in Figure \(\PageIndex{12}\). One function of the signaling cascade results in the activation of the Rab10 protein. Rab 10 promotes the fusion of GLUT4-containing secretory vesicles (GSVs) with the plasma membrane allowing for increased surface expression of GLUT4. GLUT4 is a glucose transporter protein. Thus, an increased concentration of the protein in the plasma membrane results in the upregulation of glucose import into the cell. Having GLUT4 proteins stored within secretory vesicles makes it available more readily than having to activate gene transcription pathways and production of the protein de novo. This allows a faster response to help lower blood glucose levels. The result is increased glucose uptake from the bloodstream into liver cells and other cellular targets, reducing blood glucose levels.
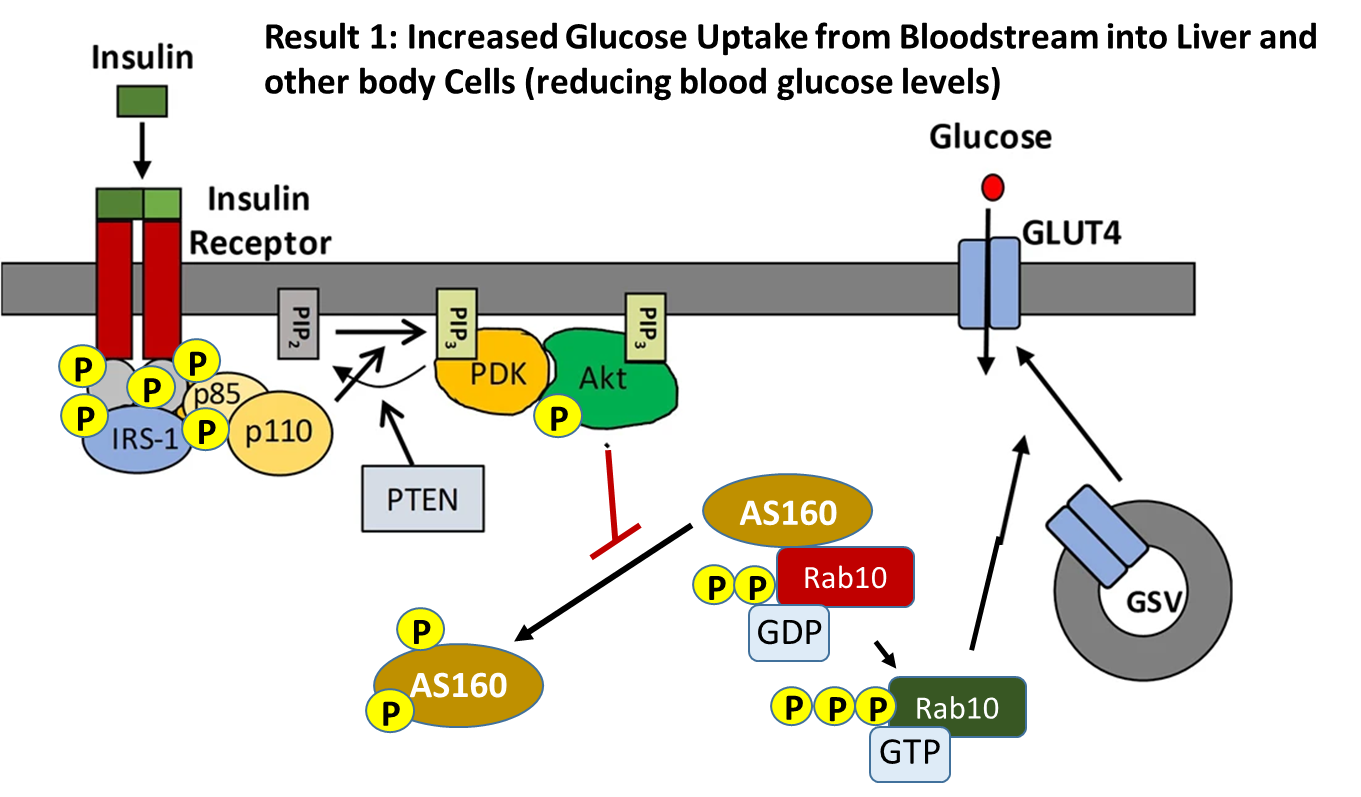
The insulin receptor is a receptor tyrosine kinase, which undergoes dimerization and autophosphorylation of Tyr residues upon insulin binding. The phosphorylated receptor also recruits and phosphorylates the insulin receptor substrate 1 (IRS-1) on tyrosine residues, which then recruits dimeric Phosphoinositol (PI)3-kinase (p85/p110 in the diagram above) and phosphorylates the p85 regulatory subunit. The PI3 kinase catalyzes the phosphorylation of phosphatidylinositol bisphosphate (PIP2) within the plasma membrane to form phosphoinositol, 3,4,5-triphosphate (PIP3). PIP3 then recruits PIP3-dependent kinase (PDK) which phosphorylates and activates Akt. Once activated, Akt dissociates from the membrane into the cytosol where one of its downstream targets is AS160. AS160 is a GTPase that normally binds with Rab10 (a G-protein) causing the cleavage of GTP to GDP. Thus, AS160 downregulates the activity of Rab10. In the phosphorylated state, AS160 cannot bind or inhibit Rab10, enabling Rab10 to release GDP and bind with a molecule of GTP. In the activated state, Rab10 helps promote the fusion of GLUT4-containing secretory vesicles (GSVs) secretory vesicles with the plasma membrane.
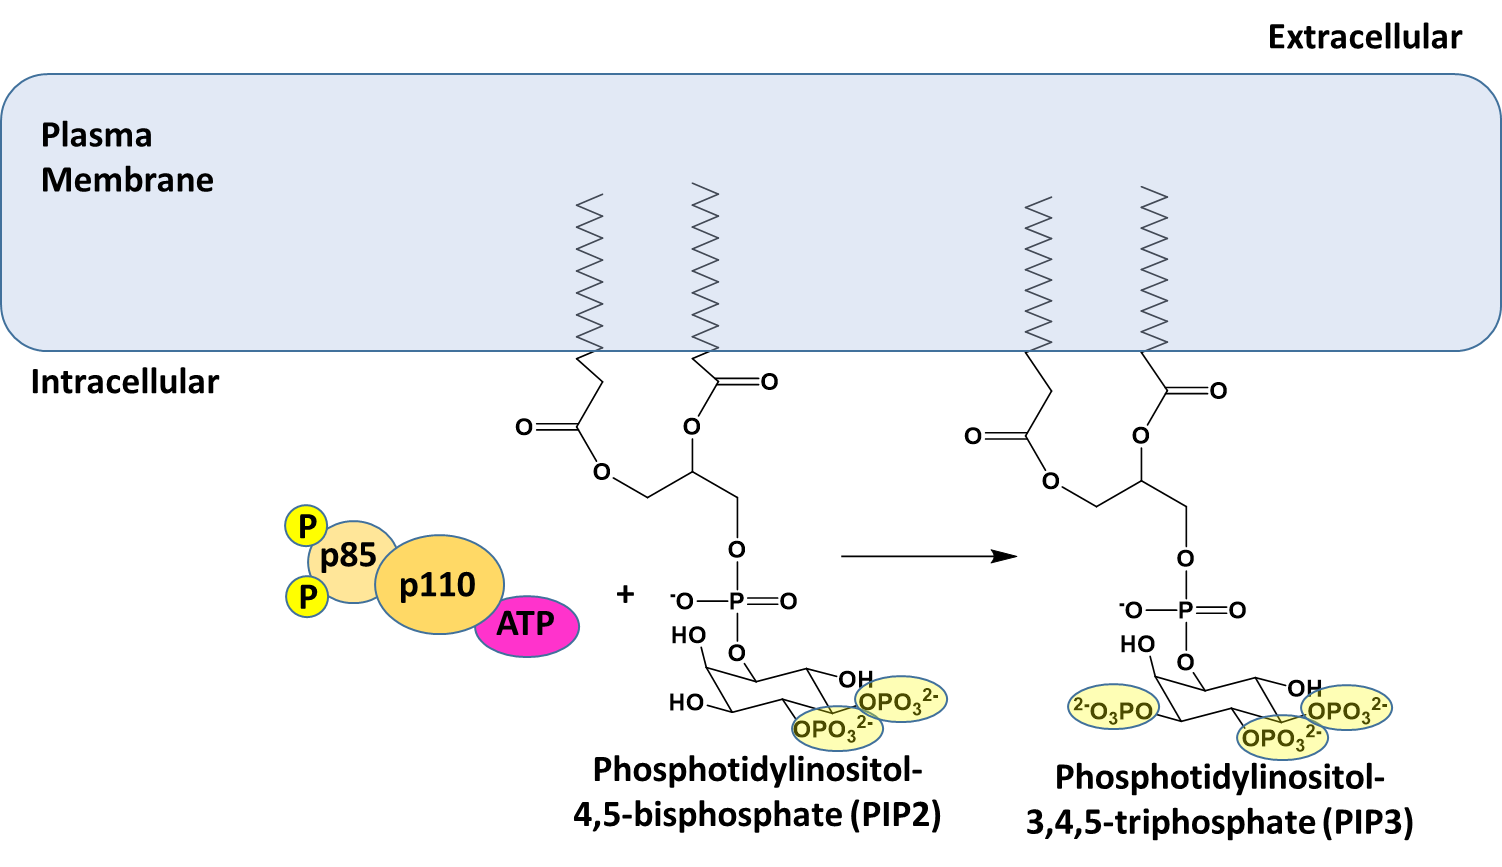
Figure \(\PageIndex{13}\) provides a deeper look at some of the initial activation steps in the insulin signaling pathway. This step shows the phosphorylation of Phosphoinositol 4,5-bisphosphate (PIP2) to Phosphatidylinositol 3,4,5-triphosphate (PIP3). PIP2 is a common phospholipid within the lipid bilayer structure. In future lectures, we will see the utilization of this phospholipid in other signaling pathways as well.
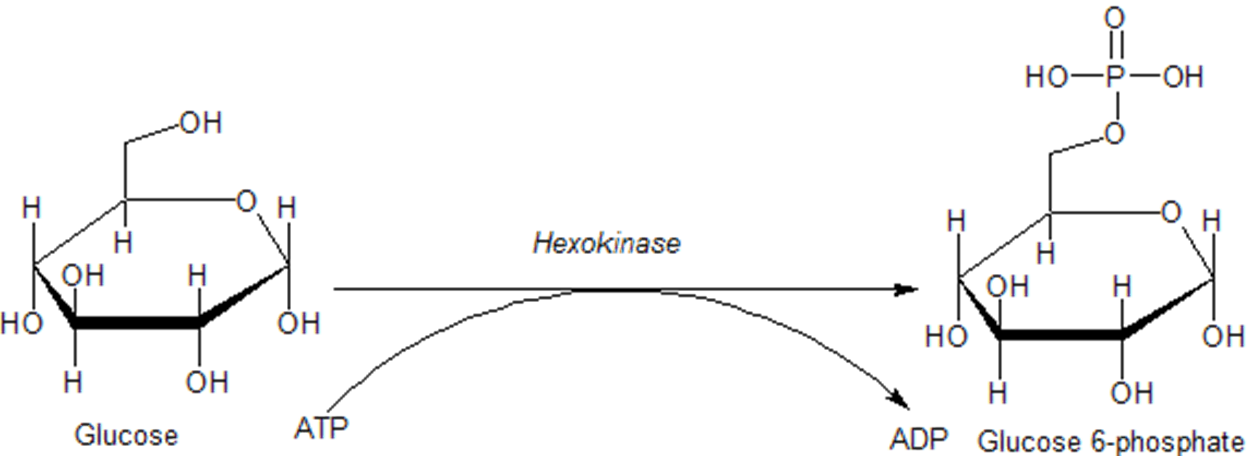
Once glucose enters a cell, it is rapidly converted to glucose 6-phosphate via the enzyme hexokinase, as shown in Figure \(\PageIndex{14}\) below. This enzyme is covered in more detail in our section on glycolysis. Importantly, phosphorylation traps the glucose inside the cell and does not allow it to be redistributed back into the bloodstream. This helps to maintain the homeostasis of glucose within the bloodstream. In addition, glucose 6-phosphate is the first step in many pathways utilizing glucose, including energy utilization and the formation of building blocks such as ribose and deoxyribose used in RNA and DNA synthesis.
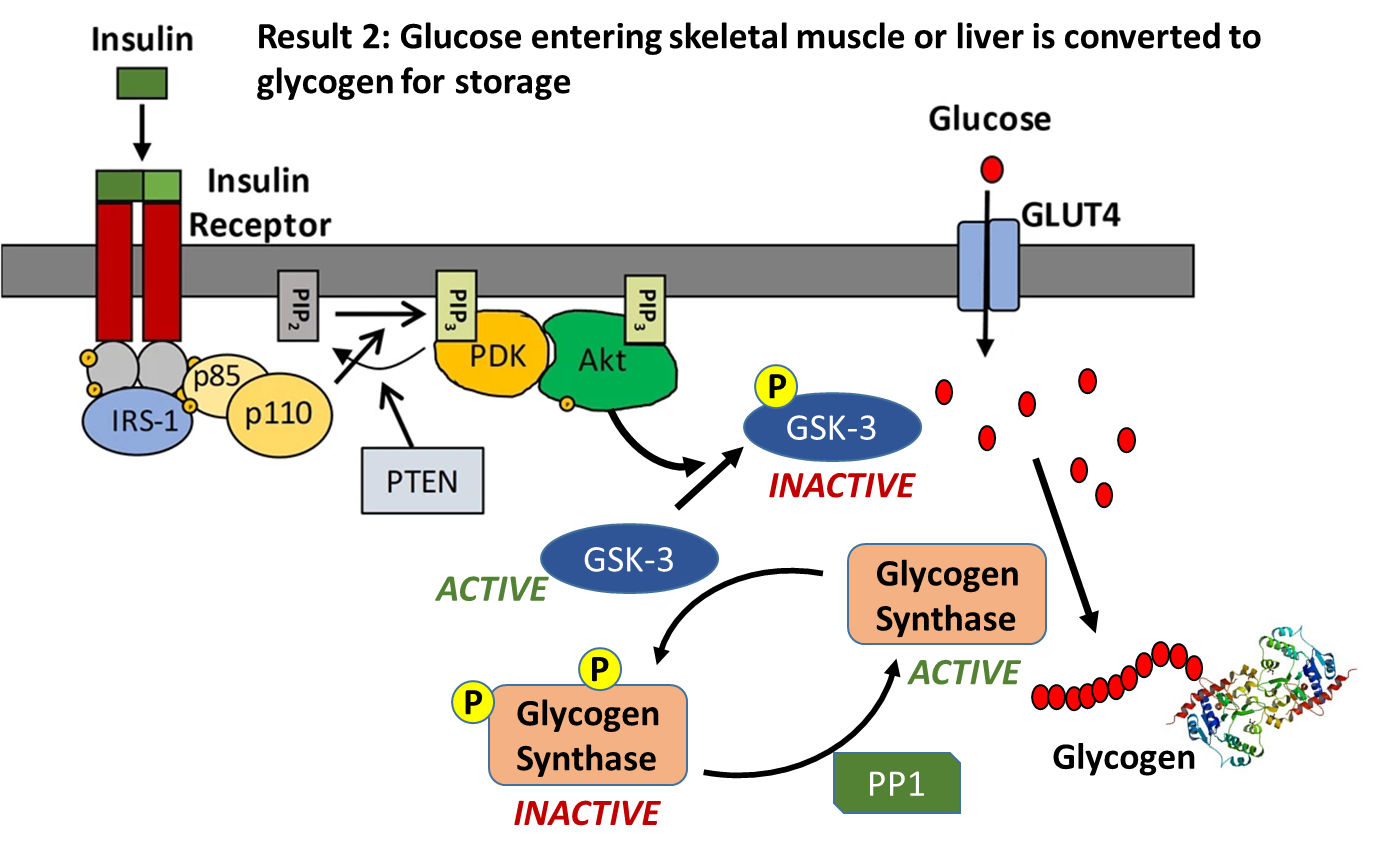
Insulin signaling increases the number of GLUT4 transporters in the plasma membrane causing an increased uptake of glucose into the cell. Within liver and muscle tissue, if glucose is not required for energy or other metabolic intermediates, it is then converted to glycogen for storage. The major enzyme required for glycogen synthesis is also activated via insulin signaling, as shown in Figure \(\PageIndex{15}\). In addition to phosphorylating the AS160 protein, Activated Akt also phosphorylates the Glycogen Synthase Kinase enzyme (GSK-3) which inactivates this protein. This allows protein phosphorylase 1 (PP1) to dephosphorylate the Glycogen Synthase enzyme shifting it into a more active state, and causing glycogen synthesis to commence.
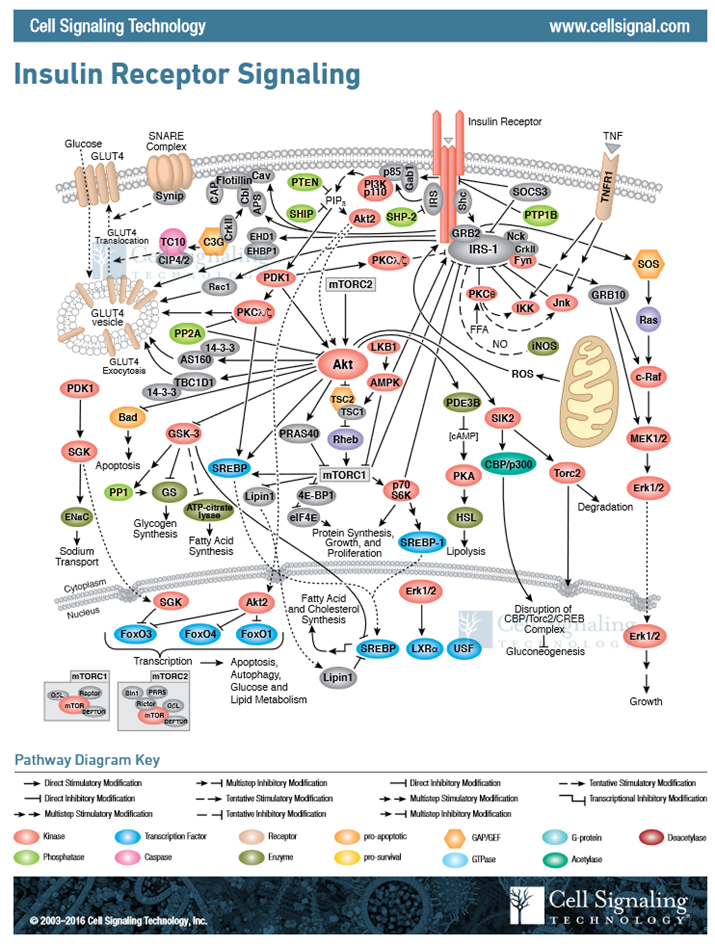
In this section, we have covered two pathways activated during cellular response to insulin signaling, and I am sure that you are feeling a bit overwhelmed with the complexity. However, biological processes are incredibly complex and signaling pathways have multiple pleiotropic downstream effects. For insulin signaling, we have only touched the tip of the iceberg, as evidenced in Figure \(\PageIndex{16}\). This figure gives a more complete representation of the chemical changes induced within a liver cell in response to insulin signaling. For our purposes, we will restrict coverage to the two downstream effects: an increase in GLUT4 transporters in the plasma membrane and increased activity of glycogen synthase.