
Biology LibreTexts

14.4: Concentration Control and Elasticity Coefficients

  • Page ID
    68905
  • \( \newcommand{\vecs}[1]{\overset { \scriptstyle \rightharpoonup} {\mathbf{#1}} } \)

    \( \newcommand{\vecd}[1]{\overset{-\!-\!\rightharpoonup}{\vphantom{a}\smash {#1}}} \)

    \( \newcommand{\dsum}{\displaystyle\sum\limits} \)

    \( \newcommand{\dint}{\displaystyle\int\limits} \)

    \( \newcommand{\dlim}{\displaystyle\lim\limits} \)

    \( \newcommand{\id}{\mathrm{id}}\) \( \newcommand{\Span}{\mathrm{span}}\)

    ( \newcommand{\kernel}{\mathrm{null}\,}\) \( \newcommand{\range}{\mathrm{range}\,}\)

    \( \newcommand{\RealPart}{\mathrm{Re}}\) \( \newcommand{\ImaginaryPart}{\mathrm{Im}}\)

    \( \newcommand{\Argument}{\mathrm{Arg}}\) \( \newcommand{\norm}[1]{\| #1 \|}\)

    \( \newcommand{\inner}[2]{\langle #1, #2 \rangle}\)

    \( \newcommand{\Span}{\mathrm{span}}\)

    \( \newcommand{\id}{\mathrm{id}}\)

    \( \newcommand{\Span}{\mathrm{span}}\)

    \( \newcommand{\kernel}{\mathrm{null}\,}\)

    \( \newcommand{\range}{\mathrm{range}\,}\)

    \( \newcommand{\RealPart}{\mathrm{Re}}\)

    \( \newcommand{\ImaginaryPart}{\mathrm{Im}}\)

    \( \newcommand{\Argument}{\mathrm{Arg}}\)

    \( \newcommand{\norm}[1]{\| #1 \|}\)

    \( \newcommand{\inner}[2]{\langle #1, #2 \rangle}\)

    \( \newcommand{\Span}{\mathrm{span}}\) \( \newcommand{\AA}{\unicode[.8,0]{x212B}}\)

    \( \newcommand{\vectorA}[1]{\vec{#1}}      % arrow\)

    \( \newcommand{\vectorAt}[1]{\vec{\text{#1}}}      % arrow\)

    \( \newcommand{\vectorB}[1]{\overset { \scriptstyle \rightharpoonup} {\mathbf{#1}} } \)

    \( \newcommand{\vectorC}[1]{\textbf{#1}} \)

    \( \newcommand{\vectorD}[1]{\overrightarrow{#1}} \)

    \( \newcommand{\vectorDt}[1]{\overrightarrow{\text{#1}}} \)

    \( \newcommand{\vectE}[1]{\overset{-\!-\!\rightharpoonup}{\vphantom{a}\smash{\mathbf {#1}}}} \)

    \( \newcommand{\vecs}[1]{\overset { \scriptstyle \rightharpoonup} {\mathbf{#1}} } \)

    \(\newcommand{\longvect}{\overrightarrow}\)

    \( \newcommand{\vecd}[1]{\overset{-\!-\!\rightharpoonup}{\vphantom{a}\smash {#1}}} \)

    \(\newcommand{\avec}{\mathbf a}\) \(\newcommand{\bvec}{\mathbf b}\) \(\newcommand{\cvec}{\mathbf c}\) \(\newcommand{\dvec}{\mathbf d}\) \(\newcommand{\dtil}{\widetilde{\mathbf d}}\) \(\newcommand{\evec}{\mathbf e}\) \(\newcommand{\fvec}{\mathbf f}\) \(\newcommand{\nvec}{\mathbf n}\) \(\newcommand{\pvec}{\mathbf p}\) \(\newcommand{\qvec}{\mathbf q}\) \(\newcommand{\svec}{\mathbf s}\) \(\newcommand{\tvec}{\mathbf t}\) \(\newcommand{\uvec}{\mathbf u}\) \(\newcommand{\vvec}{\mathbf v}\) \(\newcommand{\wvec}{\mathbf w}\) \(\newcommand{\xvec}{\mathbf x}\) \(\newcommand{\yvec}{\mathbf y}\) \(\newcommand{\zvec}{\mathbf z}\) \(\newcommand{\rvec}{\mathbf r}\) \(\newcommand{\mvec}{\mathbf m}\) \(\newcommand{\zerovec}{\mathbf 0}\) \(\newcommand{\onevec}{\mathbf 1}\) \(\newcommand{\real}{\mathbb R}\) \(\newcommand{\twovec}[2]{\left[\begin{array}{r}#1 \\ #2 \end{array}\right]}\) \(\newcommand{\ctwovec}[2]{\left[\begin{array}{c}#1 \\ #2 \end{array}\right]}\) \(\newcommand{\threevec}[3]{\left[\begin{array}{r}#1 \\ #2 \\ #3 \end{array}\right]}\) \(\newcommand{\cthreevec}[3]{\left[\begin{array}{c}#1 \\ #2 \\ #3 \end{array}\right]}\) \(\newcommand{\fourvec}[4]{\left[\begin{array}{r}#1 \\ #2 \\ #3 \\ #4 \end{array}\right]}\) \(\newcommand{\cfourvec}[4]{\left[\begin{array}{c}#1 \\ #2 \\ #3 \\ #4 \end{array}\right]}\) \(\newcommand{\fivevec}[5]{\left[\begin{array}{r}#1 \\ #2 \\ #3 \\ #4 \\ #5 \\ \end{array}\right]}\) \(\newcommand{\cfivevec}[5]{\left[\begin{array}{c}#1 \\ #2 \\ #3 \\ #4 \\ #5 \\ \end{array}\right]}\) \(\newcommand{\mattwo}[4]{\left[\begin{array}{rr}#1 \amp #2 \\ #3 \amp #4 \\ \end{array}\right]}\) \(\newcommand{\laspan}[1]{\text{Span}\{#1\}}\) \(\newcommand{\bcal}{\cal B}\) \(\newcommand{\ccal}{\cal C}\) \(\newcommand{\scal}{\cal S}\) \(\newcommand{\wcal}{\cal W}\) \(\newcommand{\ecal}{\cal E}\) \(\newcommand{\coords}[2]{\left\{#1\right\}_{#2}}\) \(\newcommand{\gray}[1]{\color{gray}{#1}}\) \(\newcommand{\lgray}[1]{\color{lightgray}{#1}}\) \(\newcommand{\rank}{\operatorname{rank}}\) \(\newcommand{\row}{\text{Row}}\) \(\newcommand{\col}{\text{Col}}\) \(\renewcommand{\row}{\text{Row}}\) \(\newcommand{\nul}{\text{Nul}}\) \(\newcommand{\var}{\text{Var}}\) \(\newcommand{\corr}{\text{corr}}\) \(\newcommand{\len}[1]{\left|#1\right|}\) \(\newcommand{\bbar}{\overline{\bvec}}\) \(\newcommand{\bhat}{\widehat{\bvec}}\) \(\newcommand{\bperp}{\bvec^\perp}\) \(\newcommand{\xhat}{\widehat{\xvec}}\) \(\newcommand{\vhat}{\widehat{\vvec}}\) \(\newcommand{\uhat}{\widehat{\uvec}}\) \(\newcommand{\what}{\widehat{\wvec}}\) \(\newcommand{\Sighat}{\widehat{\Sigma}}\) \(\newcommand{\lt}{<}\) \(\newcommand{\gt}{>}\) \(\newcommand{\amp}{&}\) \(\definecolor{fillinmathshade}{gray}{0.9}\)

    Search Fundamentals of Biochemistry

    Learning Goals

    (Learning goals written by Claude, Sonnet 4.6, Anthropic)

    Concentration Control Coefficients

    • Define the Concentration Control Coefficient (\(C_{E_{i}}^{S}\)) as a global system property representing the fractional change in metabolite concentration relative to the fractional change in a single enzyme's concentration or activity, and contrast it with the Flux Control Coefficient by explaining why concentration coefficients are not constrained to sum to 1, can be negative, and can take on large values.
    • Use the limiting case where [S] << Km to derive the quantitative relationship between a reduction in enzyme activity and the compensatory increase in substrate concentration required to maintain constant flux, and explain the physiological significance of large concentration control coefficients for enzyme-deficiency diseases.

    Elasticity Coefficients

    • Define the Elasticity Coefficient (\(\varepsilon_{S}^{v}\)) as a local property of an isolated enzyme — the fractional change in reaction rate with fractional change in substrate (or modifier) concentration — and distinguish it clearly from the global flux and concentration control coefficients, noting that elasticities can be measured in vitro using purified enzymes and standard kinetic methods.
    • Interpret the sign and magnitude of elasticity coefficients in the context of yeast glycolysis sensitivity tables, explaining why substrates of an enzyme typically generate positive elasticities while products and inhibitors generate negative ones, and why there is no summation theorem for elasticity coefficients.

    Connecting Local and Global Properties: The Connectivity Theorem

    • State the Connectivity Theorem (\(\Sigma_{i=1}^n C_{v i}^J e_s^{v i}=0\)) relating flux control coefficients (global) to elasticity coefficients (local) for a substrate acted upon by multiple enzymes, and explain conceptually why such a relationship must exist — that is, why local kinetic properties of individual enzymes must ultimately constrain the system-level behavior of the pathway as a whole.
    • Synthesize the three MCA coefficients (flux control, concentration control, and elasticity) into a unified framework, explaining the distinct roles each plays — global flux regulation, metabolite buffering, and local kinetic sensitivity — and how, together, they provide a more complete picture of pathway control than any single coefficient alone.

    Concentration Control Coefficients

    The Concentration control coefficient (\(C_{E_{i}}^{S}\)), a global property of the system, gives the relative fractional change in metabolite concentration \(S_j (dS_j/S_j)\), where \(S_j\) is the concentration of any metabolite in the system and as such is a system variable, with fractional change in concentration or activity of enzyme \(E_i (du_i/u_i)\). Similar equations to section 15.3 apply.

    \begin{equation}
    C_{E_i}^S=\frac{\frac{\partial S_i}{S_i}}{\frac{\partial u_i}{u_i}}=\frac{\partial \ln S_i}{\partial \ln u_i}=\frac{\partial S_i}{\partial u_i} \frac{u_i}{S_i}
    \end{equation}

    It can be shown that the sum of all of the individual \(C^S_{E_i} = 0\) (another summation theorem) is not 1, as in the case of flux control coefficients. This again would make sense in the steady state. Flux coefficients usually vary from 0 to 1, but concentration coefficients can vary from negative to positive and from small to large.

    \begin{equation}
    \sum_{i=1}^n C_{E i}^S=0
    \end{equation}

    A simple example shows that concentration control coefficients can be large. For a given enzyme, at low [S], for example, when [S] << Km,

    \begin{equation}
    v=\frac{V_m S}{K_M+S}=\frac{V_m S}{K_M}=\frac{k_{c a t} E_{t o t} S}{K_M} \text { when } S \ll K m
    \end{equation}

    If the enzyme had only 0.1x of its normal activity (due to a mutation, for example), then to maintain constant flux, the [S] would have to increase 10-fold.

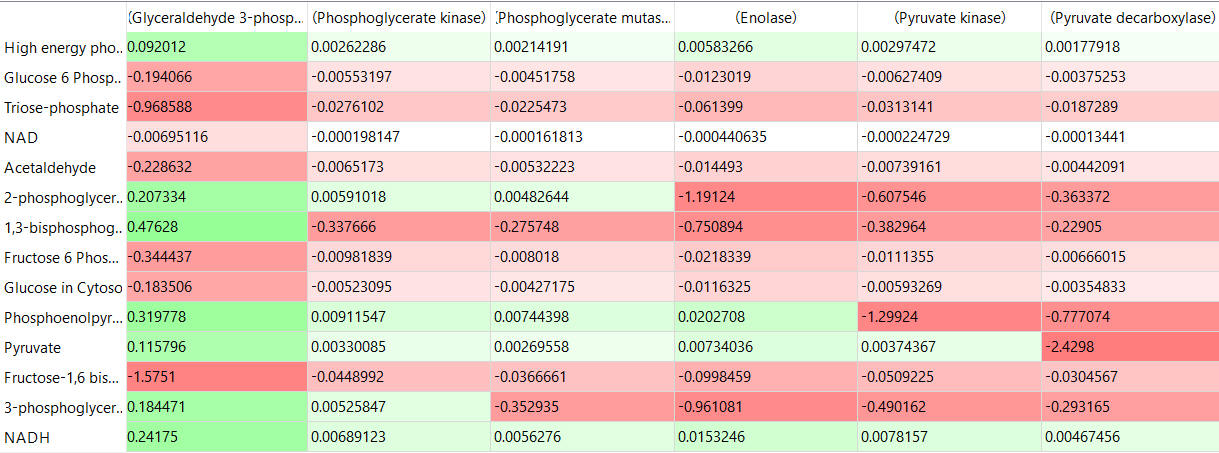
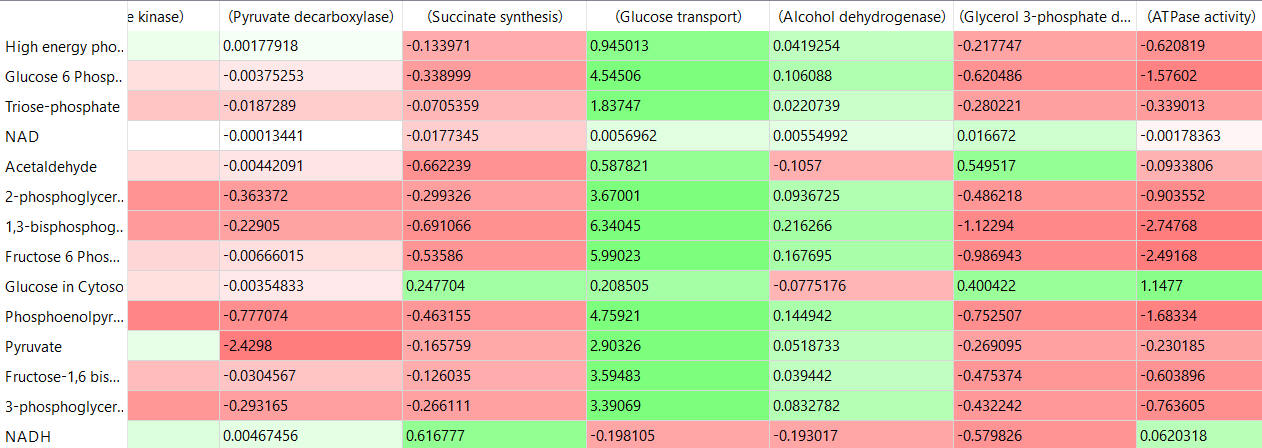
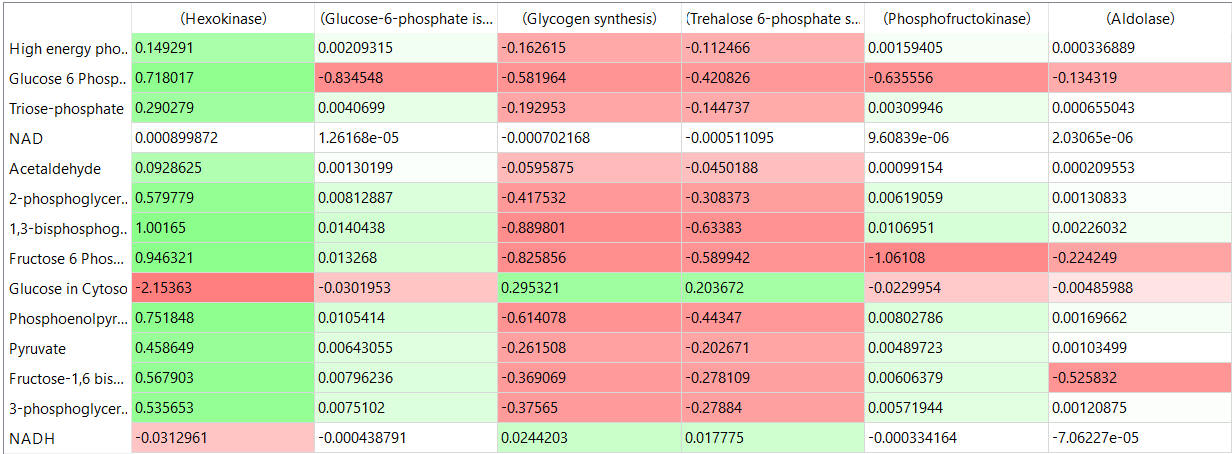
    The tables below show the CSEi values for incremental changes in the substrate (1%).
    A table displaying various data points, with some cells highlighted in green and red to indicate performance differences.

    Table, part 2:

    Spreadsheet displaying data in rows and columns, with cells colored green and red to indicate performance metrics.

    table, part 3

    A table displaying data with colored cells; some cells are green, others are red, indicating varying values or performance.

    Elasticity Coefficient

    The Elasticity Coefficient, (\(\varepsilon_{S}^{v}\)), in contrast to the flux and concentration control coefficients, which are properties of the system, is a local property and can be measured using isolated enzymes and substrates. It makes sense that some kinetic property of the isolated enzyme would affect its propensity to affect system flux. The elasticity coefficient gives a measure of how much a substrate \(S\) (or other substance) can change the reaction rate (\(v\)) of an isolated enzyme. (Note that we use \(v\) and not flux \(J\), which describes a system property.) Hence

    \begin{equation}
    \varepsilon_S^v=\frac{\frac{\partial v}{v}}{\frac{\partial S}{S}}=\frac{\partial \ln v}{\partial \ln S}=\frac{\partial v}{\partial S} \frac{S}{v}
    \end{equation}

    Price Elasticity

    The term elasticity is also used in economics and is especially useful when inflation is high. If the price of your favorite product, such as a Starbucks Latte, goes up, consumers might buy it less frequently or opt for a cheaper alternative from a competitor. If a small price increase for a Starbucks latte leads to a large drop in demand, the Starbucks latte is price-elastic. However, if people don't change their latte-buying behavior in response to a large price increase, the product is inelastic. If you are the CEO of a company, it is helpful to understand the elasticity of your products to maximize profits.

    Hence, the elasticity coefficient can be determined using basic enzyme kinetics of the isolated enzyme. Note that the coefficient at each \(S\) concentration is the slope of the v vs S curve multiplied by the \(S/v\) at that tangent point. The elasticity coefficient must be evaluated at the same enzyme and substrate concentration as in vivo in the steady state. Velocity (\(v\)), not flux, is used. In the above case, \(S\) is the substrate, but it could be a product or modifier. There is a different elasticity coefficient for each parameter. There is no summation theory for elasticities. Values can be positive for species that increase the velocity or negative for those that decrease it. Hence, there can be multiple elasticities.

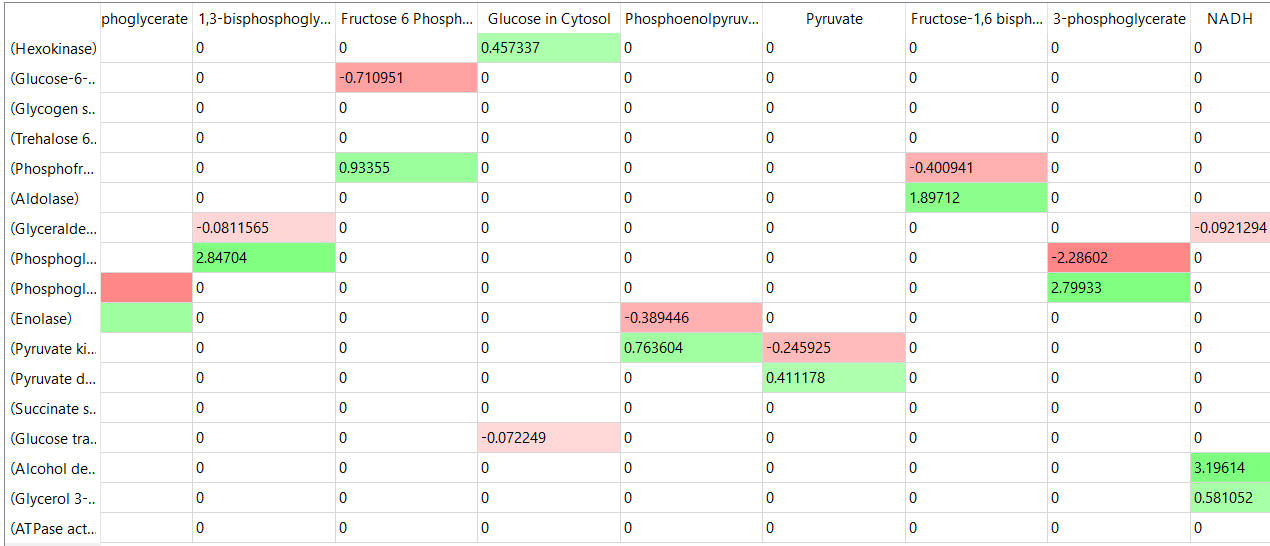
    The tables below show the elasticity coefficients (relative or scaled) for yeast glycolysis determined using COPASI.
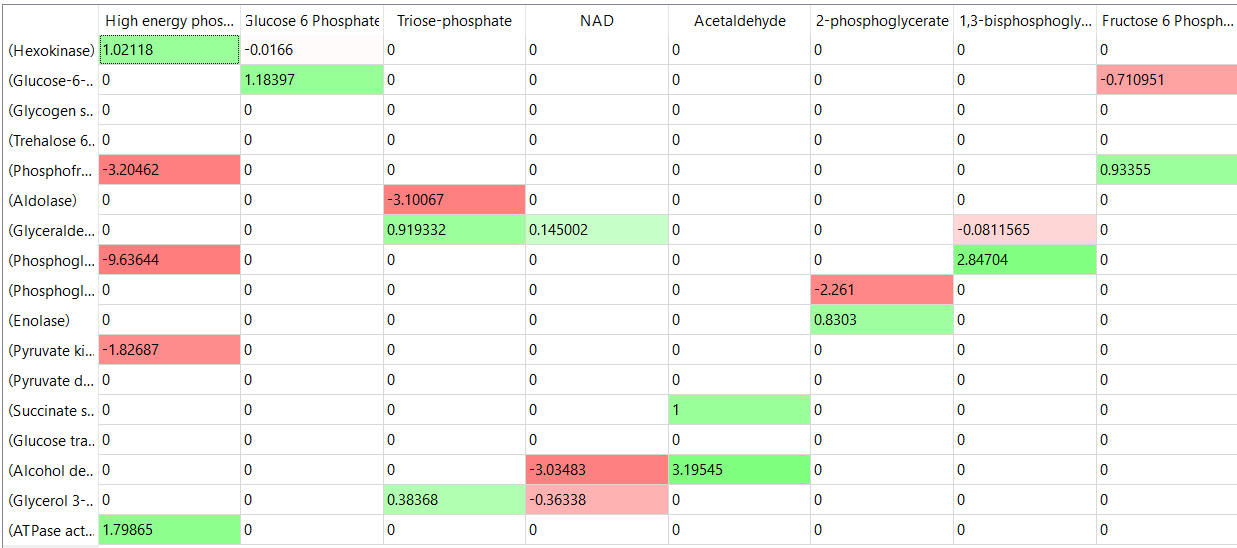
    A table displaying data with rows and columns, featuring green and red highlights indicating positive and negative values.

    Table, part 2

    A table displaying data with various rows and columns, featuring highlighted cells in green and red indicating positive and negative values.

    Things to note:

    • the columns show substrates, not enzymes;
    • green cells (with positive elasticities) are generally substrates for their target enzymes (for example, glucose-6-phosphate for phosphoglucomutase);

    Other "generic" sensitivities can be determined as well. For example, incremental changes in \(K_m\), \(V_m\), or \(K_{ix}\) for specific enzymes could affect fluxes in a pathway.

    A link between system control coefficients and local coefficients:

    You would think there should be some relationship between a system variable, such as the flux control coefficient, and a local variable, such as the elasticity coefficient. There is, and it is expressed by the Connectivity Theorem (below). If a substrate \(S\) is acted upon by many different enzymes (\(i …… n\)), which is very likely, especially for branch points in metabolic pathways, then it can be shown that

    \begin{equation}
    \sum_{i=1}^n C_{v i}^J e_s^{v i}=0
    \end{equation}

    Recent Updates:  August 2, 2026

    Interactive Graphs and Problems:  

    The following interactive graphs and questions were created using Claude (Anthropic).

    Concentration Control Coefficient

    Explore the interactive graph and questions below to better understand the Concentration Control Coefficient

    p>

    Answers

    Here they are.

    Answer

    Both use the same two-enzyme model as before, so S = u₁/(u₁+u₂), with C1ˢ = u₂/(u₁+u₂) and C2ˢ = -u₂/(u₁+u₂). Elasticity uses a single MM enzyme, v = S/(Km+S), with ε = Km/(Km+S).

    Concentration control coefficient

    1.  u₁=u₂=1 → S=0.5, C1ˢ=+0.5, C2ˢ=-0.5. Both enzymes raise flux, but E1 makes S (so more E1 fills the pool) while E2 consumes S (so more E2 drains it faster than it's replenished). Flux control and concentration control don't have to share the same sign — flux is about throughput, concentration is about pool size, and an enzyme can boost the former while depleting the latter.

    2.  u₁=0.1, u₂=1 → S=0.091, C1ˢ=0.909. With C1ˢ close to 1, [S] tracks E1 almost proportionally — a 1% change in E1's activity moves [S] by nearly 1%. This is the concentration analog of the "limiting enzyme" idea from the flux explorer.

    3.  u₁=1, u₂=0.1 → S=0.909, C2ˢ=-0.091 (small!). This is worth pausing on: [S] itself rose a lot (0.5→0.909) when E2 was crippled, but the coefficient is small. That's because at u₂=0.1, S is already sitting near its ceiling (S→1 as u₂→0), so it's in a "saturated" part of the S-vs-u₂ relationship — further fractional changes in u₂ barely move [S] fractionally, even though the total displacement from baseline was large. This actually diverges from the text's specific example (which gives an exact CCC of −1); that example assumes an enzyme working in an unsaturated, first-order kinetic regime, not the near-ceiling regime this toy model lands in here. Good illustration that the same qualitative phenomenon (crippling a consumer raises the substrate pool) can correspond to very different coefficient magnitudes depending on where in the curve you are.

    4.  C1ˢ+C2ˢ = u₂/(u₁+u₂) − u₂/(u₁+u₂) = 0 for any u₁,u₂ — confirmed for u₁=4,u₂=0.7 (0.149 and −0.149). Algebraically forced, not a coincidence.

    5.  An enzyme can be a positive flux controller and a negative concentration controller of its own substrate at the same time because flux (throughput) and pool size (concentration) are different system variables that respond differently to the same perturbation — increasing a "downstream" enzyme speeds the pathway up (raises J) precisely by draining the upstream pool faster (lowers S). This is why MCA needs two separate types of control coefficients rather than just one.


    Elasticity Coefficient

    Explore the interactive graph and questions below to better understand the Elasticity Coefficient

    p>

    Answers

    Here they are.

    Answer

    1.  S=0.5, Km=10 → ε=0.952. Near 1 because S≪Km puts the enzyme in the region where v≈(Vmax/Km)·S — a first-order, roughly linear relationship, so fractional changes in S produce almost equal fractional changes in v.

    2.  S=20, Km=1 → ε=0.048. Near 0 because S≫Km means the enzyme is saturated (v≈Vmax); the tangent is nearly flat, so more substrate barely moves the rate.

    3.  S=Km always gives ε=0.5, e.g., S=Km=5 → ε=0.5, S=Km=2 → ε=0.5. Algebraically, ε=Km/(Km+S); setting S=Km gives Km/(2Km)=0.5 regardless of the specific value.

    4.  S=3, Km=6 → ε=0.667, and the ln–ln tangent slope matches by construction — d(ln v)/d(ln S) = (dv/dS)(S/v) = ε, the same identity used in the flux explorer.

    5.  Elasticity only needs this one enzyme's own kinetic parameters (S, Km, Vmax) — you can measure it on a purified enzyme in a test tube with a spectrophotometer, no pathway required. FCC and CCC are system properties: computing them requires the whole intact pathway at steady state, because they depend on how a perturbation propagates through every other enzyme's response too..


    Summary

    (Summary written by Claude, Sonnet 4.6, Anthropic)

    This chapter completes the introduction to metabolic control analysis (MCA) by presenting two additional quantitative descriptors — the Concentration Control Coefficient and the Elasticity Coefficient — and showing how they are related to each other and to the Flux Control Coefficient through the Connectivity Theorem.

    The Concentration Control Coefficient (\(C_{E_{i}}^{S}\)) describes how the steady-state concentration of a metabolite S responds to a fractional change in the concentration or activity of enzyme i. Like the Flux Control Coefficient, it is a global, system-level property that cannot be measured from a single isolated enzyme but emerges from the behavior of the entire pathway. Unlike flux control coefficients, however, concentration control coefficients are not constrained by a summation theorem requiring them to sum to 1; instead, the appropriate summation for concentration coefficients equals 0, reflecting the fact that a uniform proportional increase in all enzyme activities in a pathway would change fluxes but leave steady-state metabolite concentrations unaltered. Furthermore, concentration control coefficients can range from large negative to large positive values, and their magnitude can be striking. A simple but instructive example makes this concrete: when [S] << Km, the enzyme operates in the nearly linear region of its Michaelis-Menten curve, and a 10-fold reduction in enzyme activity (say, due to a loss-of-function mutation) must be compensated by a 10-fold increase in substrate concentration to maintain the same pathway flux. This predicts that even modest reductions in enzyme activity can cause dramatic accumulation of upstream metabolites — a principle directly relevant to understanding the biochemical basis of inherited enzyme deficiencies. The sensitivity tables for yeast glycolysis confirm that concentration control coefficients can be large, that they span both positive and negative values, and that a perturbation of any single enzyme reverberates through the concentrations of metabolites throughout the entire pathway.

    The Elasticity Coefficient (\(\varepsilon_{S}^{v}\)) occupies a fundamentally different conceptual niche from the flux and concentration control coefficients: it is a local property, measurable using purified enzyme and defined substrate concentrations in vitro. It quantifies how sensitively the rate of a single, isolated enzymatic reaction responds to a fractional change in the concentration of a substrate, product, or modifier. Graphically, it equals the slope of the rate-versus-concentration curve at a given point, multiplied by the ratio of that concentration to the rate — the normalized local derivative. Because it is a local property, the elasticity coefficient must be evaluated at the actual in vivo concentrations of enzyme and substrate prevailing at steady state, not at arbitrary in vitro concentrations, to be meaningful in the context of MCA. There is no summation theorem for elasticities. Their signs are informative: substrates that increase enzyme rate generate positive elasticities, while products and allosteric inhibitors that decrease rate generate negative elasticities. The magnitude reflects kinetic sensitivity — a substrate operating well below Km gives a near-unity elasticity (rate is approximately linear in concentration), while a substrate near or above Km gives an elasticity approaching zero (the enzyme is near saturation and rate is insensitive to further changes in [S]). The yeast glycolysis elasticity tables confirm these patterns, with positive elasticities generally appearing where a metabolite is a substrate for the enzyme in question.

    The chapter concludes by linking local and global properties through the Connectivity Theorem (\(\Sigma_{i=1}^n C_{v i}^J e_s^{v i}=0\)), which states that for a metabolite S acted upon by multiple enzymes, the sum of products of each enzyme's flux control coefficient and its elasticity coefficient with respect to S equals zero. This theorem is not merely a mathematical curiosity; it encapsulates the biological reality that the system-level control properties of a pathway (flux control coefficients) are constrained by and related to the local kinetic sensitivities of its individual enzymes (elasticity coefficients). Together, the three MCA coefficients form a coherent and internally consistent framework: elasticity coefficients describe how responsive individual enzymes are to changes in metabolite concentrations; flux control coefficients describe how changes in enzyme activity propagate to affect the rate of the whole system; and concentration control coefficients describe how those same perturbations redistribute metabolite pools across the pathway. No single coefficient alone is sufficient to understand pathway regulation — all three are needed for a complete quantitative picture.


    This page titled 14.4: Concentration Control and Elasticity Coefficients is shared under a not declared license and was authored, remixed, and/or curated by Henry Jakubowski and Patricia Flatt.