Biology LibreTexts

1.2: Mendelian Genetics (Part I)

  • Page ID
    141895
  • \( \newcommand{\vecs}[1]{\overset { \scriptstyle \rightharpoonup} {\mathbf{#1}} } \)

    \( \newcommand{\vecd}[1]{\overset{-\!-\!\rightharpoonup}{\vphantom{a}\smash {#1}}} \)

    \( \newcommand{\id}{\mathrm{id}}\) \( \newcommand{\Span}{\mathrm{span}}\)

    ( \newcommand{\kernel}{\mathrm{null}\,}\) \( \newcommand{\range}{\mathrm{range}\,}\)

    \( \newcommand{\RealPart}{\mathrm{Re}}\) \( \newcommand{\ImaginaryPart}{\mathrm{Im}}\)

    \( \newcommand{\Argument}{\mathrm{Arg}}\) \( \newcommand{\norm}[1]{\| #1 \|}\)

    \( \newcommand{\inner}[2]{\langle #1, #2 \rangle}\)

    \( \newcommand{\Span}{\mathrm{span}}\)

    \( \newcommand{\id}{\mathrm{id}}\)

    \( \newcommand{\Span}{\mathrm{span}}\)

    \( \newcommand{\kernel}{\mathrm{null}\,}\)

    \( \newcommand{\range}{\mathrm{range}\,}\)

    \( \newcommand{\RealPart}{\mathrm{Re}}\)

    \( \newcommand{\ImaginaryPart}{\mathrm{Im}}\)

    \( \newcommand{\Argument}{\mathrm{Arg}}\)

    \( \newcommand{\norm}[1]{\| #1 \|}\)

    \( \newcommand{\inner}[2]{\langle #1, #2 \rangle}\)

    \( \newcommand{\Span}{\mathrm{span}}\) \( \newcommand{\AA}{\unicode[.8,0]{x212B}}\)

    \( \newcommand{\vectorA}[1]{\vec{#1}}      % arrow\)

    \( \newcommand{\vectorAt}[1]{\vec{\text{#1}}}      % arrow\)

    \( \newcommand{\vectorB}[1]{\overset { \scriptstyle \rightharpoonup} {\mathbf{#1}} } \)

    \( \newcommand{\vectorC}[1]{\textbf{#1}} \)

    \( \newcommand{\vectorD}[1]{\overrightarrow{#1}} \)

    \( \newcommand{\vectorDt}[1]{\overrightarrow{\text{#1}}} \)

    \( \newcommand{\vectE}[1]{\overset{-\!-\!\rightharpoonup}{\vphantom{a}\smash{\mathbf {#1}}}} \)

    \( \newcommand{\vecs}[1]{\overset { \scriptstyle \rightharpoonup} {\mathbf{#1}} } \)

    \( \newcommand{\vecd}[1]{\overset{-\!-\!\rightharpoonup}{\vphantom{a}\smash {#1}}} \)

    \(\newcommand{\avec}{\mathbf a}\) \(\newcommand{\bvec}{\mathbf b}\) \(\newcommand{\cvec}{\mathbf c}\) \(\newcommand{\dvec}{\mathbf d}\) \(\newcommand{\dtil}{\widetilde{\mathbf d}}\) \(\newcommand{\evec}{\mathbf e}\) \(\newcommand{\fvec}{\mathbf f}\) \(\newcommand{\nvec}{\mathbf n}\) \(\newcommand{\pvec}{\mathbf p}\) \(\newcommand{\qvec}{\mathbf q}\) \(\newcommand{\svec}{\mathbf s}\) \(\newcommand{\tvec}{\mathbf t}\) \(\newcommand{\uvec}{\mathbf u}\) \(\newcommand{\vvec}{\mathbf v}\) \(\newcommand{\wvec}{\mathbf w}\) \(\newcommand{\xvec}{\mathbf x}\) \(\newcommand{\yvec}{\mathbf y}\) \(\newcommand{\zvec}{\mathbf z}\) \(\newcommand{\rvec}{\mathbf r}\) \(\newcommand{\mvec}{\mathbf m}\) \(\newcommand{\zerovec}{\mathbf 0}\) \(\newcommand{\onevec}{\mathbf 1}\) \(\newcommand{\real}{\mathbb R}\) \(\newcommand{\twovec}[2]{\left[\begin{array}{r}#1 \\ #2 \end{array}\right]}\) \(\newcommand{\ctwovec}[2]{\left[\begin{array}{c}#1 \\ #2 \end{array}\right]}\) \(\newcommand{\threevec}[3]{\left[\begin{array}{r}#1 \\ #2 \\ #3 \end{array}\right]}\) \(\newcommand{\cthreevec}[3]{\left[\begin{array}{c}#1 \\ #2 \\ #3 \end{array}\right]}\) \(\newcommand{\fourvec}[4]{\left[\begin{array}{r}#1 \\ #2 \\ #3 \\ #4 \end{array}\right]}\) \(\newcommand{\cfourvec}[4]{\left[\begin{array}{c}#1 \\ #2 \\ #3 \\ #4 \end{array}\right]}\) \(\newcommand{\fivevec}[5]{\left[\begin{array}{r}#1 \\ #2 \\ #3 \\ #4 \\ #5 \\ \end{array}\right]}\) \(\newcommand{\cfivevec}[5]{\left[\begin{array}{c}#1 \\ #2 \\ #3 \\ #4 \\ #5 \\ \end{array}\right]}\) \(\newcommand{\mattwo}[4]{\left[\begin{array}{rr}#1 \amp #2 \\ #3 \amp #4 \\ \end{array}\right]}\) \(\newcommand{\laspan}[1]{\text{Span}\{#1\}}\) \(\newcommand{\bcal}{\cal B}\) \(\newcommand{\ccal}{\cal C}\) \(\newcommand{\scal}{\cal S}\) \(\newcommand{\wcal}{\cal W}\) \(\newcommand{\ecal}{\cal E}\) \(\newcommand{\coords}[2]{\left\{#1\right\}_{#2}}\) \(\newcommand{\gray}[1]{\color{gray}{#1}}\) \(\newcommand{\lgray}[1]{\color{lightgray}{#1}}\) \(\newcommand{\rank}{\operatorname{rank}}\) \(\newcommand{\row}{\text{Row}}\) \(\newcommand{\col}{\text{Col}}\) \(\renewcommand{\row}{\text{Row}}\) \(\newcommand{\nul}{\text{Nul}}\) \(\newcommand{\var}{\text{Var}}\) \(\newcommand{\corr}{\text{corr}}\) \(\newcommand{\len}[1]{\left|#1\right|}\) \(\newcommand{\bbar}{\overline{\bvec}}\) \(\newcommand{\bhat}{\widehat{\bvec}}\) \(\newcommand{\bperp}{\bvec^\perp}\) \(\newcommand{\xhat}{\widehat{\xvec}}\) \(\newcommand{\vhat}{\widehat{\vvec}}\) \(\newcommand{\uhat}{\widehat{\uvec}}\) \(\newcommand{\what}{\widehat{\wvec}}\) \(\newcommand{\Sighat}{\widehat{\Sigma}}\) \(\newcommand{\lt}{<}\) \(\newcommand{\gt}{>}\) \(\newcommand{\amp}{&}\) \(\definecolor{fillinmathshade}{gray}{0.9}\)

    Key points:

    • Gregor Mendel studied inheritance of traits in pea plants. He proposed a model where pairs of "heritable elements," or genes, specified traits.
    • Genes come in different versions, or alleles. A dominant allele hides a recessive allele and determines the organism's appearance.
    • When an organism makes gametes, each gamete receives just one gene copy, which is selected randomly. This is known as the law of segregation.
    • A Punnett square can be used to predict genotypes (allele combinations) and phenotypes (observable traits) of offspring from genetic crosses.
    • A test cross can be used to determine whether an organism with a dominant phenotype is homozygous or heterozygous.

    Introduction

    Today, we know that many of people's characteristics, from hair color to height to risk of diabetes, are influenced by genes. We also know that genes are the way parents pass characteristics on to their children (including things like dimples, or—in the case of me and my father—a terrible singing voice). In the last hundred years, we've come to understand that genes are actually pieces of DNA that are found on chromosomes and specify proteins.

    But did we always know those things? Not by a long shot! About 150 years ago, a monk named Gregor Mendel published a paper that first proposed the existence of genes and presented a model for how they were inherited. Mendel's work was the first step on a long road, involving many hard-working scientists, that's led to our present understanding of genes and what they do.

    In this article, we’ll trace the experiments and reasoning that led Mendel to formulate his model for the inheritance of single genes.

    Mendel's model: It started with a 3:1 ratio

    Mendel studied the genetics of pea plants, and he traced the inheritance of a variety of characteristics, including flower color, flower position, seed color, and seed shape. To do so, he started by crossing pure-breeding parent plants with different forms of a characteristic, such as violet and white flowers. Pure-breeding just means that the plant will always make more offspring like itself, when self-fertilized over many generations.

    [What is self-fertilization?]

    In self-fertilization, sperm and eggs from the same pea plant combine inside a closed flower, producing seeds with a single plant as both mother and father.

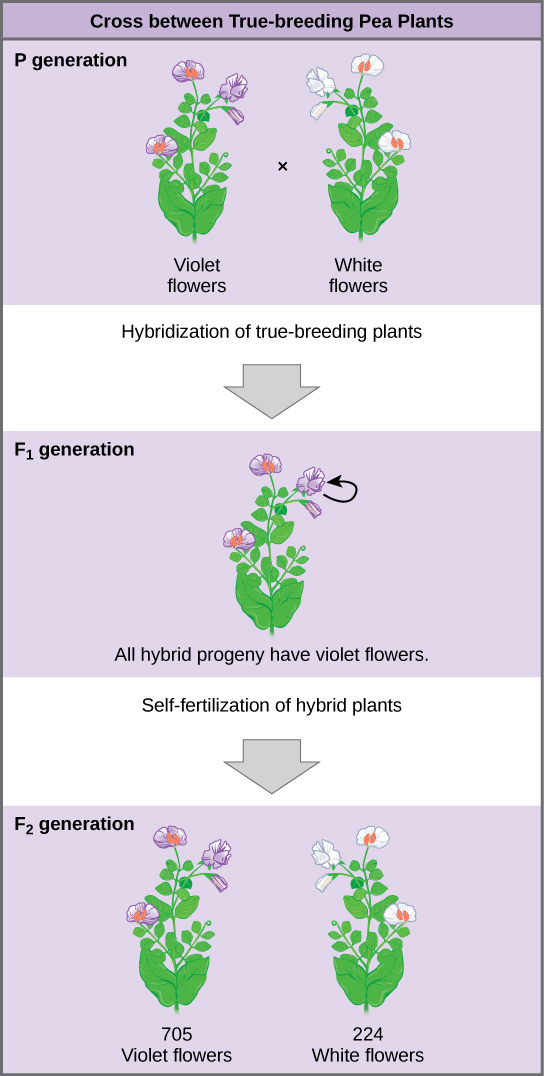
    What results did Mendel find in his crosses for flower color? In the parental, or P generation, Mendel crossed a pure-breeding violet-flowered plant to a pure-breeding white-flowered plant. When he gathered and planted the seeds produced in this cross, Mendel found that 100 percent of the plants in the next generation, or F1 generation, had violet flowers.

    Conventional wisdom at that time would have predicted that the hybrid flowers should be pale violet—that is, that the parents' traits should blend in the offspring. Instead, Mendel’s results showed that the white flower trait had completely disappeared. He called the trait that was visible in the F1 generation (violet flowers) the dominant trait, and the trait that was hidden or lost (white flowers) the recessive trait.

    The diagram shows a cross between pea plants that are true-breeding for purple flower color and plants that are true-breeding for white flower color. This cross-fertilization of the P generation resulted in an F_{1} generation with all violet flowers. Self-fertilization of the F_{1} generation resulted in an F_{2} generation that consisted of 705 plants with violet flowers, and 224 plants with white flowers.
    Image credit: "Mendel's experiments: Figure 2," by Robert Bear et al., OpenStax, CC BY 4.0

    Importantly, Mendel did not stop his experimentation there. Instead, he let the F1 plants self-fertilize. Among their offspring, called the F2 generation, he found that 705 plants had violet flowers and 224 had white flowers. This was a ratio of 3.15 violet flowers to one white flower, or approximately 3:1.

    This 3:1 ratio was no fluke. For the other six characteristics that Mendel examined, both the F1 and F2 generations behaved in the same way they did for flower color. One of the two traits would disappear completely from the F1 generation, only to reappear in the F2 generation in a ratio of roughly 3:1.

    [See Mendel's data for all seven characteristics]
    Character Dominant trait Recessive trait F2 generation F2 ratio
    Seed color Yellow Green 6022 yellow, 2001 green 3.01:1
    Seed shape Round Wrinkled 5474 round, 1850 wrinkled 2.96:1
    Pod color Green Yellow 428 green, 152 yellow 2.82:1
    Pod shape Inflated Constricted 882 inflated, 299 constricted 2.95:1
    Plant height Tall Short (dwarf) 787 tall, 277 short 2.84:1
    Flower color Purple White 705 purple, 224 white 3.15:1
    Flower position Axial (along branch) Terminal (end of branch) 651 axial, 207 terminal 3.14:1

    Adapted from "The results of Mendel's garden pea hybridizations," by OpenStax College, Biology (CC BY 3.0).

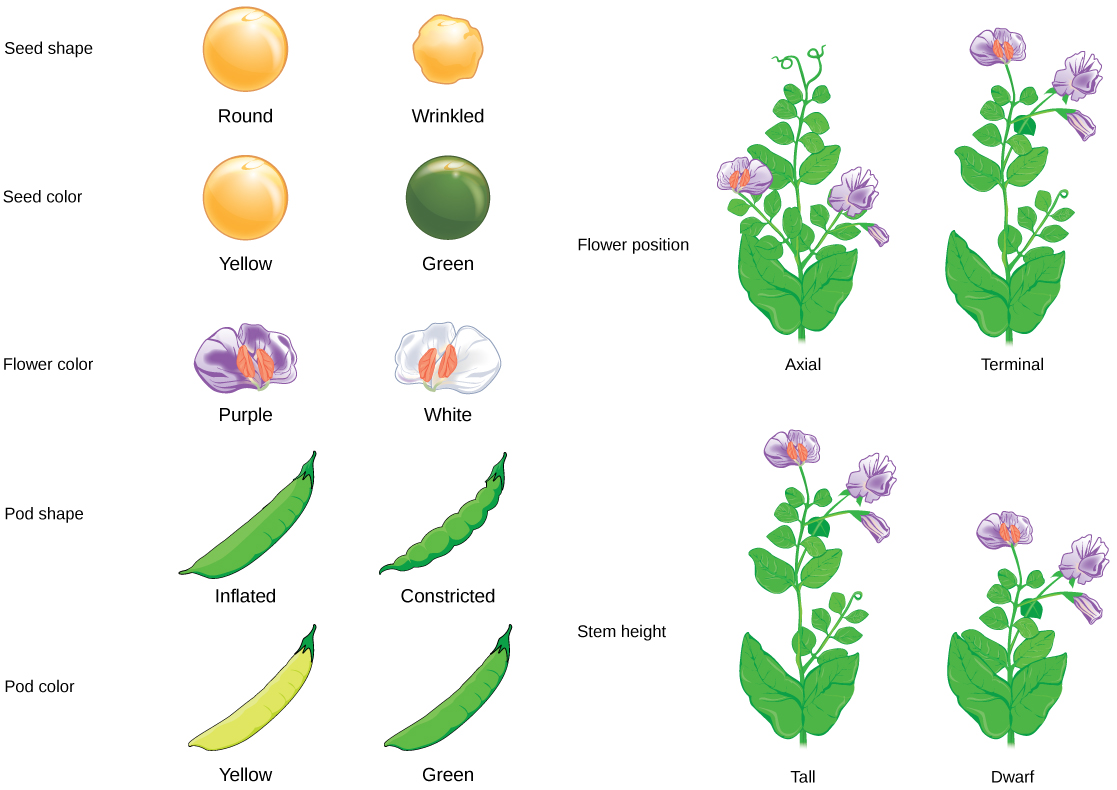
    Seven characteristics of Mendel’s pea plants are illustrated. The flowers can be purple or white. The peas can be yellow or green, or smooth or wrinkled. The pea pods can be inflated or constricted, or yellow or green. The flower position can be axial or terminal. The stem length can be tall or dwarf.
    Image credit: "Mendel's experiments: Figure 3," by Robert Bear et al., OpenStax, CC BY 4.0

    As it turned out, the 3:1 ratio was a crucial clue that let Mendel crack the puzzle of inheritance. Let's take a closer look at what Mendel figured out.

    Mendel's model of inheritance

    Based on his results (including that magic 3:1 ratio), Mendel came up with a model for the inheritance of individual characteristics, such as flower color.

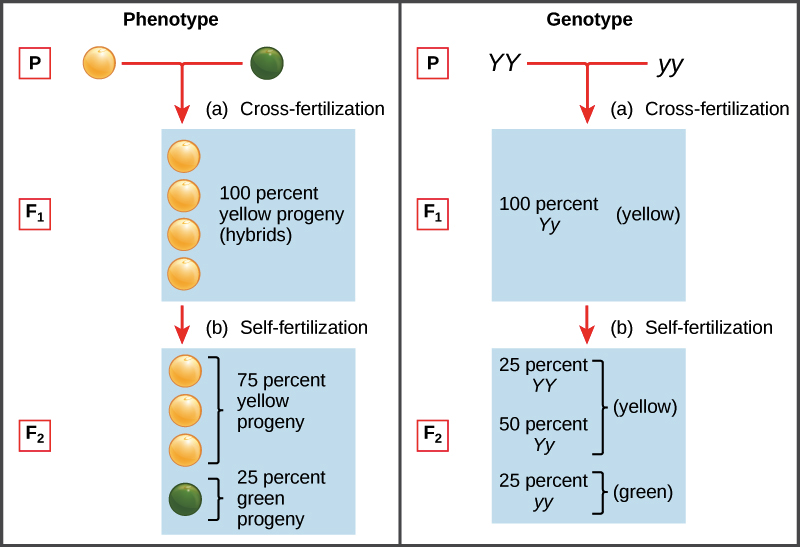
    In Mendel's model, parents pass along “heritable factors," which we now call genes, that determine the traits of the offspring. Each individual has two copies of a given gene, such as the gene for seed color (Y gene) shown below. If these copies represent different versions, or alleles, of the gene, one allele—the dominant one—may hide the other allele—the recessive one. For seed color, the dominant yellow allele Y hides the recessive green allele y.

    A graphic with 2 columns, the first with the heading “Phenotype” and the second with the heading “Genotype.” In the phenotype column, one yellow pea plant cross-fertilizes with one green pea plant. The first generation of offspring is 100 percent yellow pea plants. After self-fertilization of these yellow pea offspring, 75 percent of the second generation offspring have yellow peas and 25 percent have green peas. The genotype column shows the first generation offspring as 100 percent Yy, and the second generation as 25 percent YY, 50 percent Yy, and 25 percent yy.
    Image modified from "Laws of inheritance: Figure 1," by Robert Bear et al., OpenStax, CC BY 4.0

    The set of alleles carried by an organism is known as its genotype. Genotype determines phenotype, an organism's observable features. When an organism has two copies of the same allele (say, YY or yy), it is said to be homozygous for that gene. If, instead, it has two different copies (like Yy), we can say it is heterozygous. Phenotype can also be affected by the environment in many real-life cases, though this did not have an impact on Mendel's work.

    Mendel's model: The law of segregation

    So far, so good. But this model alone doesn't explain why Mendel saw the exact patterns of inheritance he did. In particular, it doesn't account for the 3:1 ratio. For that, we need Mendel's law of segregation.

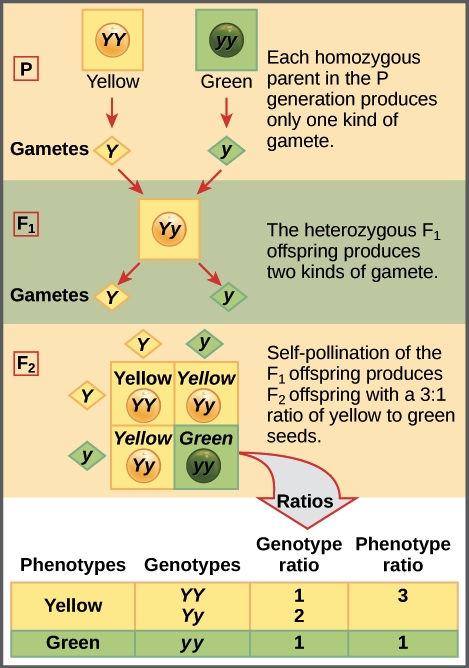
    According to the law of segregation, only one of the two gene copies present in an organism is distributed to each gamete (egg or sperm cell) that it makes, and the allocation of the gene copies is random. When an egg and a sperm join in fertilization, they form a new organism, whose genotype consists of the alleles contained in the gametes. The diagram below illustrates this idea:

    This illustration shows a monohybrid cross. In the P generation, one parent has a dominant yellow phenotype and the genotype YY, and the other parent has the recessive green phenotype and the genotype yy. Each parent produces one kind of gamete, resulting in an F_{1} generation with a dominant yellow phenotype and the genotype Yy. Self-pollination of the F_{1} generation results in an F_{2} generation with a 3 to 1 ratio of yellow to green peas. One out of three of the yellow pea plants has a dominant genotype of YY, and 2 out of 3 has the heterozygous genotype Yy. The homozygous recessive plant has the green phenotype and the genotype yy.
    Image modified from "Laws of inheritance: Figure 5," by Robert Bear et al., OpenStax, CC BY 4.0

    The four-squared box shown for the F2 generation is known as a Punnett square. To prepare a Punnett square, all possible gametes made by the parents are written along the top (for the father) and side (for the mother) of a grid. Here, since it is self-fertilization, the same plant is both mother and father.

    The combinations of egg and sperm are then made in the boxes in the table, representing fertilization to make new individuals. Because each square represents an equally likely event, we can determine genotype and phenotype ratios by counting the squares.

    [Why are the boxes all equally likely?]

    A key point of the law of segregation is that a parent’s two gene copies are randomly distributed to its gametes. Thus, for a Yy heterozygote, Y and y gametes are equally likely to be made: 50% of the sperm and eggs will have a Y allele, 50% will have a y allele, and the same will be true for eggs.

    Since each type of gamete is equally common, each fertilization event (meeting of gametes, corresponding to a square of the table) also has an equal chance of happening. Thus, the boxes of the table represent four equal-probability events.

    Since the table contains 1 box with a YY genotype, 2 boxes with a Yy genotype, and 1 box with a yy genotype, we'd expect to see YY, Yy, and yy plants in a ratio of 1:2:1 in the F2 generation. Since both YY and Yy plants are yellow, this genotype ratio translates into a phenotype ratio of 3:1 yellow-seeded to green-seeded plants, almost exactly what Mendel observed.

    YY and yy plants each appear in just one square, while Yy plants are found in two squares. This is because there are two different fertilization events that lead to a Yy plant: the fusion of a Y egg and a y sperm, or the fusion of a y egg and a Y sperm. Either event is equally likely, and has the same likelihood as a YY or yy fertilization event.

    The test cross

    Mendel also came up with a way to figure out whether an organism with a dominant phenotype (such as a yellow-seeded pea plant) was a heterozygote (Yy) or a homozygote (YY). This technique is called a test cross and is still used by plant and animal breeders today.

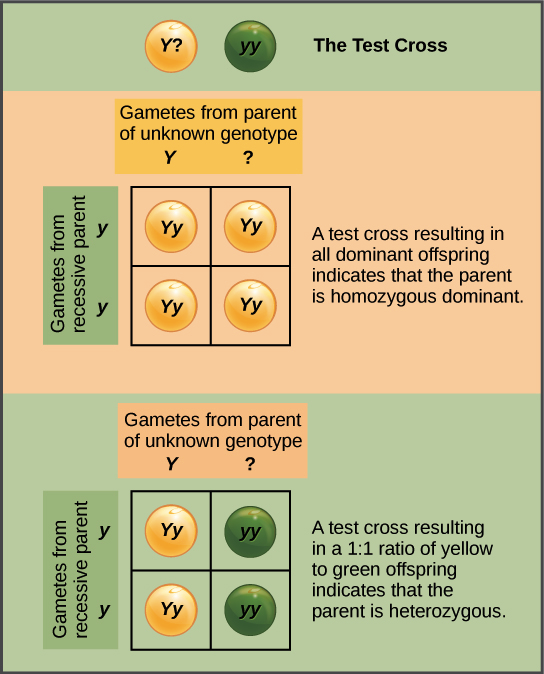
    In a test cross, the organism with the dominant phenotype is crossed with an organism that is homozygous recessive (e.g., green-seeded):

    In a test cross, a parent with a dominant phenotype but unknown genotype is crossed with a recessive parent. If the parent with the unknown genotype is homozygous dominant, all the resulting offspring will have at least one dominant allele. If the parent with the unknown genotype is heterozygous, 50 percent of the offspring will inherit a recessive allele from both parents and will have the recessive phenotype.
    Image credit: "Laws of inheritance: Figure 4," by Robert Bear et al., OpenStax, CC BY 4.0

    If the organism with the dominant phenotype is homozygous, then all of the F1 offspring will get a dominant allele from that parent, be heterozygous, and show the dominant phenotype. If the organism with the dominant phenotype organism is instead a heterozygote, the F1 offspring will be half heterozygotes (dominant phenotype) and half recessive homozygotes (recessive phenotype).

    The fact that we get a 1:1 ratio in this second case is another confirmation of Mendel’s law of segregation.

    Is that Mendel's complete model of inheritance?

    Not quite! We've seen all of Mendel's model for the inheritance of single genes. However, Mendel's complete model also addressed whether genes for different characteristics (such as flower color and seed shape) influence each other's inheritance. You can learn more about Mendel's model for the inheritance of multiple genes in the law of independent assortment article.

    One thing I find pretty amazing is that Mendel was able to figure out his entire model of inheritance simply from his observations of pea plants. This wasn't because he was some kind of crazy super genius, but rather, because he was very careful, persistent, and curious, and also because he thought about his results mathematically (for instance, the 3:1 ratio). These are some of the qualities of a great scientist—ones that anyone, anywhere, can develop!


    Check your understanding

    Query \(\PageIndex{1}\)

    [Hint]

    When two pure-breeding organisms with different forms of a characteristic are crossed, the offspring of the cross may show just one form of the characteristic, while the other form may be hidden.

    The trait that is visible in the offspring of the cross is called the dominant trait, while the trait that is hidden is called the recessive trait.

    In this example, tan fur is the dominant trait, because it is visible in the offspring of the cross. Black fur is the recessive trait, because it is hidden in the offspring of the cross.

    Tan fur is dominant, while black fur is recessive.

    Query \(\PageIndex{2}\)

    [Hint]

    Genotype, the set of alleles an organism carries, determines phenotype, its outward appearance or characteristics. However, environment influences how genotype is translated into phenotype, so an organism's phenotype is typically the product of both genotype and environment.

    Genotype determines phenotype, but with influence from the environment.


    Contributors and Attributions

    • Khan Academy (CC BY-NC-SA 3.0; All Khan Academy content is available for free at www.khanacademy.org)

    [Attribution and references]

    Attribution:

    This article is a modified derivative of the following articles:

    The modified article is licensed under a CC BY-NC-SA 4.0 license.

    Additional references:

    Ding, Z. (2009). Eye color. In Stanford at the Tech: Understanding genetics. Retrieved from http://genetics.thetech.org/ask/ask316.

    Miko, I. (2008). Gregor Mendel and the principles of inheritance. Nature Education, 11(1):134. Retrieved from http://www.nature.com/scitable/topicpage/gregor-mendel-and-the-principles-of-inheritance-593.

    Monohybrid cross. (2015, September 18). Retrieved November 14, 2015 from Wikipedia: https://en.wikipedia.org/wiki/Monohybrid_cross.

    Phenotype. (2015, October 17). Retrieved November 14, 2015 from Wikipedia: https://en.wikipedia.org/wiki/Phenotype.

    Punnet. (2015, August 9). Retrieved November 18, 2015 from Wikipedia: https://en.wikipedia.org/wiki/Punnet.

    Punnett square. (2015, November 8). Retrieved November 14, 2015 from Wikipedia: https://en.wikipedia.org/wiki/Punnett_square.

    Purves, W. K., Sadava, D. E., Orians, G. H., and Heller, H.C. (2004). Genetics: Mendel and beyond. In Life: The science of biology (7th ed., pp. 187-212). Sunderland, MA: Sinauer Associates.

    Raven, P. H., Johnson, G. B., Mason, K. A., Losos, J. B., and Singer, S. R. (2014). Patterns of inheritance. In Biology (10th ed., AP ed., pp. 221-238). New York, NY: McGraw-Hill.

    Reece, J. B., Urry, L. A., Cain, M. L., Wasserman, S. A., Minorsky, P. V., and Jackson, R. B. (2011). Mendel and the gene idea. In Campbell biology (10th ed., pp. 267-291). San Francisco, CA: Pearson.

    Starr, B. (2006, December 20). Eye color [answer]. In Stanford at the Tech: Understanding genetics. Retrieved from http://genetics.thetech.org/ask/ask203

    Strehlow, A. T. (2005, March 9). Other traits [answer]. In Stanford at the Tech: Understanding genetics. Retrieved from http://genetics.thetech.org/ask/ask98.

    White, D. and Rabago-Smith, M. (2011). Genotype-phenotype associations and human eye color. Journal of Human Genetics, 56, 5-7. http://dx.doi.org/10.1038/jhg.2010.126.


    1.2: Mendelian Genetics (Part I) is shared under a CC BY-NC-SA 3.0 license and was authored, remixed, and/or curated by LibreTexts.