
22.1: Introduction to Biodiversity
- Page ID
- 118169

\( \newcommand{\vecs}[1]{\overset { \scriptstyle \rightharpoonup} {\mathbf{#1}} } \)
\( \newcommand{\vecd}[1]{\overset{-\!-\!\rightharpoonup}{\vphantom{a}\smash {#1}}} \)
\( \newcommand{\dsum}{\displaystyle\sum\limits} \)
\( \newcommand{\dint}{\displaystyle\int\limits} \)
\( \newcommand{\dlim}{\displaystyle\lim\limits} \)
\( \newcommand{\id}{\mathrm{id}}\) \( \newcommand{\Span}{\mathrm{span}}\)
( \newcommand{\kernel}{\mathrm{null}\,}\) \( \newcommand{\range}{\mathrm{range}\,}\)
\( \newcommand{\RealPart}{\mathrm{Re}}\) \( \newcommand{\ImaginaryPart}{\mathrm{Im}}\)
\( \newcommand{\Argument}{\mathrm{Arg}}\) \( \newcommand{\norm}[1]{\| #1 \|}\)
\( \newcommand{\inner}[2]{\langle #1, #2 \rangle}\)
\( \newcommand{\Span}{\mathrm{span}}\)
\( \newcommand{\id}{\mathrm{id}}\)
\( \newcommand{\Span}{\mathrm{span}}\)
\( \newcommand{\kernel}{\mathrm{null}\,}\)
\( \newcommand{\range}{\mathrm{range}\,}\)
\( \newcommand{\RealPart}{\mathrm{Re}}\)
\( \newcommand{\ImaginaryPart}{\mathrm{Im}}\)
\( \newcommand{\Argument}{\mathrm{Arg}}\)
\( \newcommand{\norm}[1]{\| #1 \|}\)
\( \newcommand{\inner}[2]{\langle #1, #2 \rangle}\)
\( \newcommand{\Span}{\mathrm{span}}\) \( \newcommand{\AA}{\unicode[.8,0]{x212B}}\)
\( \newcommand{\vectorA}[1]{\vec{#1}} % arrow\)
\( \newcommand{\vectorAt}[1]{\vec{\text{#1}}} % arrow\)
\( \newcommand{\vectorB}[1]{\overset { \scriptstyle \rightharpoonup} {\mathbf{#1}} } \)
\( \newcommand{\vectorC}[1]{\textbf{#1}} \)
\( \newcommand{\vectorD}[1]{\overrightarrow{#1}} \)
\( \newcommand{\vectorDt}[1]{\overrightarrow{\text{#1}}} \)
\( \newcommand{\vectE}[1]{\overset{-\!-\!\rightharpoonup}{\vphantom{a}\smash{\mathbf {#1}}}} \)
\( \newcommand{\vecs}[1]{\overset { \scriptstyle \rightharpoonup} {\mathbf{#1}} } \)
\(\newcommand{\longvect}{\overrightarrow}\)
\( \newcommand{\vecd}[1]{\overset{-\!-\!\rightharpoonup}{\vphantom{a}\smash {#1}}} \)
\(\newcommand{\avec}{\mathbf a}\) \(\newcommand{\bvec}{\mathbf b}\) \(\newcommand{\cvec}{\mathbf c}\) \(\newcommand{\dvec}{\mathbf d}\) \(\newcommand{\dtil}{\widetilde{\mathbf d}}\) \(\newcommand{\evec}{\mathbf e}\) \(\newcommand{\fvec}{\mathbf f}\) \(\newcommand{\nvec}{\mathbf n}\) \(\newcommand{\pvec}{\mathbf p}\) \(\newcommand{\qvec}{\mathbf q}\) \(\newcommand{\svec}{\mathbf s}\) \(\newcommand{\tvec}{\mathbf t}\) \(\newcommand{\uvec}{\mathbf u}\) \(\newcommand{\vvec}{\mathbf v}\) \(\newcommand{\wvec}{\mathbf w}\) \(\newcommand{\xvec}{\mathbf x}\) \(\newcommand{\yvec}{\mathbf y}\) \(\newcommand{\zvec}{\mathbf z}\) \(\newcommand{\rvec}{\mathbf r}\) \(\newcommand{\mvec}{\mathbf m}\) \(\newcommand{\zerovec}{\mathbf 0}\) \(\newcommand{\onevec}{\mathbf 1}\) \(\newcommand{\real}{\mathbb R}\) \(\newcommand{\twovec}[2]{\left[\begin{array}{r}#1 \\ #2 \end{array}\right]}\) \(\newcommand{\ctwovec}[2]{\left[\begin{array}{c}#1 \\ #2 \end{array}\right]}\) \(\newcommand{\threevec}[3]{\left[\begin{array}{r}#1 \\ #2 \\ #3 \end{array}\right]}\) \(\newcommand{\cthreevec}[3]{\left[\begin{array}{c}#1 \\ #2 \\ #3 \end{array}\right]}\) \(\newcommand{\fourvec}[4]{\left[\begin{array}{r}#1 \\ #2 \\ #3 \\ #4 \end{array}\right]}\) \(\newcommand{\cfourvec}[4]{\left[\begin{array}{c}#1 \\ #2 \\ #3 \\ #4 \end{array}\right]}\) \(\newcommand{\fivevec}[5]{\left[\begin{array}{r}#1 \\ #2 \\ #3 \\ #4 \\ #5 \\ \end{array}\right]}\) \(\newcommand{\cfivevec}[5]{\left[\begin{array}{c}#1 \\ #2 \\ #3 \\ #4 \\ #5 \\ \end{array}\right]}\) \(\newcommand{\mattwo}[4]{\left[\begin{array}{rr}#1 \amp #2 \\ #3 \amp #4 \\ \end{array}\right]}\) \(\newcommand{\laspan}[1]{\text{Span}\{#1\}}\) \(\newcommand{\bcal}{\cal B}\) \(\newcommand{\ccal}{\cal C}\) \(\newcommand{\scal}{\cal S}\) \(\newcommand{\wcal}{\cal W}\) \(\newcommand{\ecal}{\cal E}\) \(\newcommand{\coords}[2]{\left\{#1\right\}_{#2}}\) \(\newcommand{\gray}[1]{\color{gray}{#1}}\) \(\newcommand{\lgray}[1]{\color{lightgray}{#1}}\) \(\newcommand{\rank}{\operatorname{rank}}\) \(\newcommand{\row}{\text{Row}}\) \(\newcommand{\col}{\text{Col}}\) \(\renewcommand{\row}{\text{Row}}\) \(\newcommand{\nul}{\text{Nul}}\) \(\newcommand{\var}{\text{Var}}\) \(\newcommand{\corr}{\text{corr}}\) \(\newcommand{\len}[1]{\left|#1\right|}\) \(\newcommand{\bbar}{\overline{\bvec}}\) \(\newcommand{\bhat}{\widehat{\bvec}}\) \(\newcommand{\bperp}{\bvec^\perp}\) \(\newcommand{\xhat}{\widehat{\xvec}}\) \(\newcommand{\vhat}{\widehat{\vvec}}\) \(\newcommand{\uhat}{\widehat{\uvec}}\) \(\newcommand{\what}{\widehat{\wvec}}\) \(\newcommand{\Sighat}{\widehat{\Sigma}}\) \(\newcommand{\lt}{<}\) \(\newcommand{\gt}{>}\) \(\newcommand{\amp}{&}\) \(\definecolor{fillinmathshade}{gray}{0.9}\)Introduction to Biodiversity
- Please read and watch the following Learning Resources
- Reading the material for understanding, and taking notes during videos, will take approximately 1 hour.
- Optional Activities are embedded.
- To navigate to the next section, use the Contents menu at the top of the page OR the right arrow on the side of the page.
- If on a mobile device, use the Contents menu at the top of the page OR the links at the bottom of the page.
- Define biodiversity
- Explain what is meant by the 'biodiversity crisis'
- Provide examples of anthropogenic extinctions
Introduction
In the 1980s, biologists working in Lake Victoria in Africa discovered one of the most extraordinary products of evolution on the planet. Located in the Great Rift Valley, Lake Victoria (Figure \(\PageIndex{1}\)) is a large lake about 68,900 km2 in area (larger than Lake Huron, the second largest of North America’s Great Lakes). Biologists were studying species of a family of fish called cichlids. They found that as they sampled for fish in different locations of the lake, they never stopped finding new species, and they identified nearly 500 evolved types of cichlids. But while studying these variations, they quickly discovered that the invasive Nile Perch was destroying the lake’s cichlid population, bringing hundreds of cichlid species to extinction with devastating rapidity.
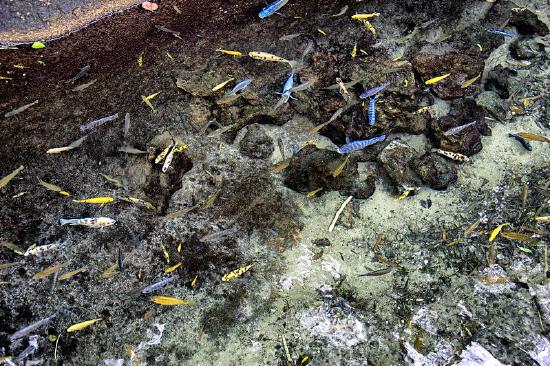
Figure \(\PageIndex{1}\): Cichlids are some of the most biodiverse fish on the planet but are also a casualty of devastating biodiversity loss. (credit: modification of work by Rishabh Tatiraju, using NASA World Wind software)
Watch a 1-minute presentation by biologist E.O. Wilson (1929-2021) on the importance of biodiversity.
What is Biodiversity?
Biodiversity is a broad term for biological variety, and it can be measured at a number of organizational levels. Traditionally, ecologists have measured biodiversity by taking into account both the number of species and the number of individuals of each species (known as relative abundance). However, biologists are using different measures of biodiversity, including genetic diversity, to help focus efforts to preserve the biologically and technologically important elements of biodiversity.
Species Diversity
Scientists accept that the term biodiversity generally describes the number and kinds of species in a location or on the planet. This is known as species diversity. Species can be difficult to define, but most biologists still feel comfortable with the concept and are able to identify and count eukaryotic species in most contexts.
For example, the American Ornithologists’ Union lists 2078 species of birds in North and Central America. This is one measure of the bird biodiversity on the continent. More sophisticated measures of diversity take into account the relative abundances of species. An ecologist analyzing a forest with 10 equally common species of trees would note that this first forest is more diverse than a forest that has the same 10 species of trees but where just one of those species makes up 95 percent of the trees.
In addition to these measures of species diversity, biologists have identified alternate measures of biodiversity, some of which are important in planning how to preserve biodiversity.
Genetic Diversity
One alternate concept of biodiversity, genetic diversity, is the raw material for evolutionary adaptation in a species and is represented by the variety of genes present within a population. A species’ potential to adapt to changing environments or new diseases depends on this genetic diversity. The same is true for higher taxonomic categories. A genus with very different types of species will have more genetic diversity than a genus with species that look alike and have similar ecologies. If there were a choice between one of these genera of species being preserved, the one with the greatest potential for subsequent evolution is the most genetically diverse one. It would be ideal not to have to make such choices, but increasingly this may be the norm.
Beyond ecological importance, genetic diversity has potential benefits for humans as sources of pharmaceuticals, so it provides one way to measure diversity that is important to human health and welfare. Humans have also generated diversity through domestic animals, plants, and fungi. This diversity is suffering losses because of migration, market forces, and increasing globalism in agriculture, especially in heavily populated regions such as China, India, and Indonesia. The human population directly depends on this diversity as a stable food source, and its decline is troubling biologists and agricultural scientists.
Ecosystem Diversity
It is also useful to define ecosystem diversity, meaning the number of different ecosystems on the planet or in a given geographic area (Figure \(\PageIndex{2}\)). Whole ecosystems can disappear even if some of the species might survive by adapting to other ecosystems. The loss of an ecosystem means the loss of interactions between species, the loss of unique features of coadaptation, and the loss of biological productivity that an ecosystem is able to create. An example of a large, nearly extinct ecosystem in North America are the prairies (Figure \(\PageIndex{2b}\)). Prairies once spanned central North America from the boreal forest in northern Canada down into Mexico. They are now all but gone, replaced by crop fields, pasture lands, and suburban sprawl. Many of the individual species survive but the hugely productive ecosystem as a whole has fallen apart. As a consequence, the most productive agricultural soils on the planet are disappearing or must be maintained at greater expense.
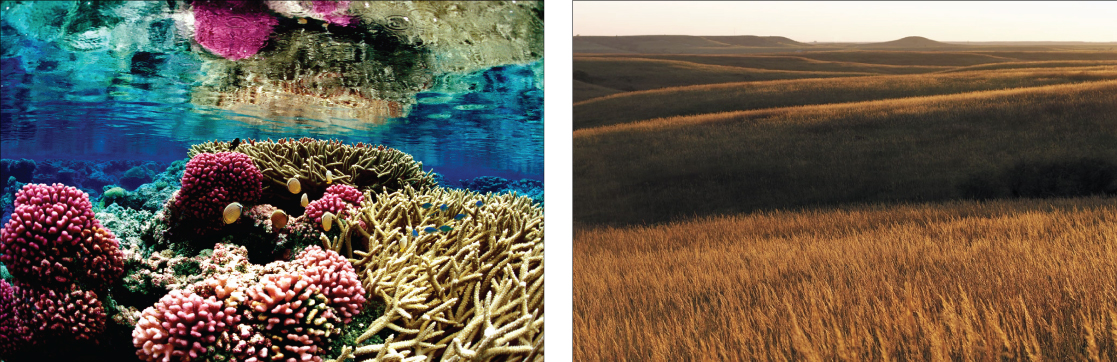
Figure \(\PageIndex{2}\): The variety of ecosystems on Earth—from (a) coral reef to (b) prairie—enables a great diversity of species to exist. (credit a: modification of work by Jim Maragos, USFWS; credit b: modification of work by Jim Minnerath, USFWS)
How Many Species?
As of August 2022, taxonomists have described nearly 2.3 million species that share this planet with us. While this total may seem impressive, available evidence suggests that this estimate vastly underestimates the true extent of Earth’s biodiversity. In fact, even now, after all the exploration in years gone by, several thousand new species are described each year. Many new discoveries are made by skilled researchers recognizing new species by discerning variation in morphological characters; that includes the discoveries of a new small forest antelope from West Africa and a new species of shark off the coast of Mozambique. New genetic technologies have highlighted that there are many thousands of species yet to be described. Both traditional and genetic techniques rely heavily on the availability of specimens in Natural History Museums collections to help identify and describe new species. A lack of taxonomists and natural history collections in many of the world's most biodiverse countries means there is still a great deal of work to do.
The most exciting and newsworthy discoveries of new species generally involve higher-level taxa, especially living fossils. For example, in 1938, biologists across the world were stunned by the report of a strange fish caught in the Indian Ocean off South Africa. This fish, subsequently named Latimeria chalumnae, belongs to a group of marine fishes known as coelacanths that were common in ancient seas but were thought to have gone extinct 65 million years ago. Coelacanths are of interest to evolutionary biologists because they show certain features of muscles and bones in their fins that are comparable to the limbs of the first vertebrates that crawled onto land. Following the initial discovery, coelacanths have been found along Africa’s Indian Ocean coast from South Africa to the Comoros and through to Kenya. Unfortunately, the entire coelacanth population, estimated at fewer than 500 individuals, is currently highly threatened because of ongoing fishing pressures.
Although field surveys have proven to be of great importance for discovering new species and populations, perhaps the greatest taxonomic progress has come from advances in genetic analyses which help to separate cryptic species previously lumped under more widespread species. For example, advances in genetic research recently highlighted that the African clawed frog Xenopus laevis—a popular model organism in biomedical research—consists of seven distinct species.
Molecular genetics and data processing and storage technologies are maturing to the point where cataloging the planet’s species in an accessible way is close to feasible. DNA barcoding is one molecular genetic method, which takes advantage of rapid evolution in a mitochondrial gene present in eukaryotes, except the plants, to identify species using the sequence of portions of the gene. Plants are barcoded using a combination of chloroplast genes. Rapid mass sequencing machines make the molecular genetics portion of the work relatively inexpensive and quick. Computer resources store and make available large volumes of data. Projects are currently underway to use DNA barcoding to catalog museum specimens, which have already been named and studied, as well as testing the method on less studied groups. As of mid-2020, close to 750,000 named species had been barcoded. Early studies suggest there are significant numbers of undescribed species that looked too much like sibling species to previously be recognized as different. These now can be identified with DNA barcoding.
Numerous computer databases now provide information about named species and a framework for adding new species. However, at the present rate of description of new species, it would still take close to 500 years before the complete catalog of life is known. Many, perhaps most, species on the planet do not have that much time given the anthropogenic, or human-caused, pressures on species around the world (Unit 5.2.3).
The presence of so many undiscovered species and communities makes precise estimates of species diversity incredibly difficult. Biologists' most recent estimates, combining genetic analysis of well-known groups with mathematical patterns, suggests there are between 1–6 billion distinct species on Earth, of which there are only about 163 million animals and 340 thousand plants. This is obviously much greater than the current catalog of around 2.3 million species.
Anthropogenic Extinctions
A review of the previous five mass extinctions can be found in Unit 3.3. The sixth, or Holocene, mass extinction appears to have begun earlier than previously believed and has mostly to do with the activities of Homo sapiens. Since the beginning of the Holocene period, there are numerous recent extinctions of individual species that are recorded in human writings. Most of these are coincident with the expansion of the European colonies since the 1500s.
Recent Extinctions
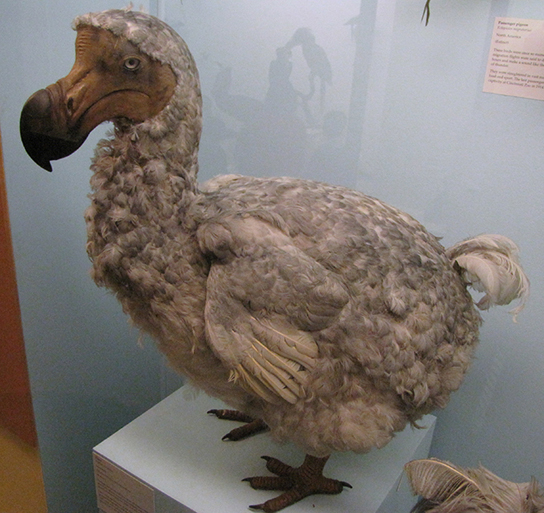
One of the earlier and popularly known examples is the dodo bird. The dodo bird lived in the forests of Mauritius, an island in the Indian Ocean. The dodo bird became extinct around 1662. It was hunted for its meat by sailors and was easy prey because the dodo, which did not evolve with humans, would approach people without fear. Introduced pigs, rats, and dogs brought to the island by European ships also killed dodo young and eggs (Figure \(\PageIndex{3}\)).
Steller's sea cow became extinct in 1768; it was related to the manatee and probably once lived along the northwest coast of North America. Steller's sea cow was first discovered by Europeans in 1741 and was hunted for meat and oil. The last sea cow was killed in 1768. That amounts to 27 years between the sea cow’s first contact with Europeans and extinction of the species.
In 1914, the last living passenger pigeon died in a zoo in Cincinnati, Ohio. This species had once darkened the skies of North America during its migrations, but it was hunted and suffered from habitat loss through the clearing of forests for farmland. In 1918, the last living Carolina parakeet died in captivity. This species was once common in the eastern United States, but it suffered from habitat loss. The species was also hunted because it ate orchard fruit when its native foods were destroyed to make way for farmland. The Japanese sea lion, which inhabited a broad area around Japan and the coast of Korea, became extinct in the 1950s due to fishermen. The Caribbean monk seal was distributed throughout the Caribbean Sea but was driven to extinction via hunting by 1952.
These are only a few of the recorded extinctions in the past 500 years.
The Red List
There is also the problem of understanding which species known to science are currently threatened and to what degree they are threatened. The International Union for Conservation of Nature (IUCN), an international non-profit, keeps a list of extinct and endangered species called the Red List, supported by scientific research. The list is not complete, but it describes 380 species of vertebrates that went extinct after 1500 AD, 86 of which were driven extinct by overhunting or overfishing. In 2011, the list contained 61,000 species. It is categorized by taxonomy, type of threat, and other criteria (Figure \(\PageIndex{4}\)).
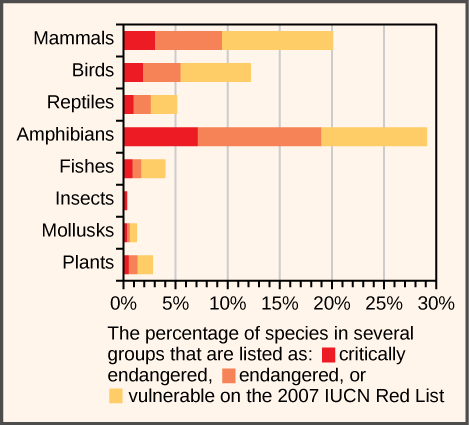
Which of the following statements is NOT supported by Figure \(\PageIndex{4}\)?
- There are more vulnerable fishes than critically endangered and endangered fishes combined.
- There are more critically endangered amphibians than vulnerable, endangered, and critically endangered reptiles combined.
- Within each group, there are more critically endangered species than vulnerable species.
- A greater percentage of bird species are critically endangered than mollusk species.
- Answer
-
C. Within each group, there are more critically endangered species than vulnerable species.
The Lake Victoria cichlids provide an example through which we can begin to understand biodiversity. The biologists studying cichlids in the 1980s discovered hundreds of cichlid species representing a variety of specializations to particular habitat types and specific feeding strategies: eating plankton floating in the water, scraping and then eating algae from rocks, eating insect larvae from the bottom, and eating the eggs of other species of cichlid. The cichlids of Lake Victoria are the product of adaptive radiation. Adaptive radiation is a rapid (less than three million years in the case of the Lake Victoria cichlids) branching through speciation of a phylogenetic tree into many closely related species; typically, the species “radiate” into different habitats and niches. The Galápagos finches are an example of a modest adaptive radiation with 15 species. The cichlids of Lake Victoria are an example of a spectacular adaptive radiation that includes about 500 species.
At the time biologists were making this discovery, some species began to quickly disappear. A culprit in these declines was a species of large fish that was introduced to Lake Victoria by fisheries to feed the people living around the lake. The Nile perch was introduced in 1963, but lay low until the 1980s when its populations began to surge. The Nile perch population grew by consuming cichlids, driving species after species to the point of extinction (the disappearance of a species). In fact, there were several factors that played a role in the extinction of perhaps 200 cichlid species in Lake Victoria: the Nile perch, declining lake water quality due to agriculture and land clearing on the shores of Lake Victoria, and increased fishing pressure. Scientists had not even cataloged all of the species present—so many were lost that were never named. The diversity is now a shadow of what it once was.
The cichlids of Lake Victoria are a thumbnail sketch of contemporary rapid species loss that occurs all over Earth and is caused by human activity. Extinction is a natural process of macroevolution that occurs at the rate of about one out of 1 million species becoming extinct per year. The fossil record reveals that there have been five periods of mass extinction in history with much higher rates of species loss, and the rate of species loss today is comparable to those periods of mass extinction. However, there is a major difference between the previous mass extinctions and the current extinction we are experiencing: human activity. Specifically, three human activities have a major impact: the destruction of habitat, introduction of exotic species, and over-harvesting. Predictions of species loss within the next century, a tiny amount of time on geological timescales, range from 10 percent to 50 percent. Extinctions on this scale have only happened five other times in the history of the planet, and they have been caused by cataclysmic events that changed the course of the history of life in each instance. Earth is now in one of those times.
Estimates of Present-day Extinction Rates
Estimates of extinction rates are hampered by the fact that most extinctions are probably happening without being observed. The extinction of a bird or mammal is often noticed by humans, especially if it has been hunted or used in some other way. But there are many organisms that are less noticeable to humans (not necessarily of less value) and many that are undescribed.
The background extinction rate is estimated to be about 1 per million species years (E/MSY). One “species year” is one species in existence for one year. One million species years could be one species persisting for one million years, or a million species persisting for one year. If it is the latter, then one extinction per million species years would be one of those million species becoming extinct in that year. For example, if there are 10 million species in existence, then we would expect 10 of those species to become extinct in a year. This is the background rate.
One contemporary extinction-rate estimate uses the extinctions in the written record since the year 1500. For birds alone, this method yields an estimate of 26 E/MSY, almost three times the background rate. However, this value may be underestimated for three reasons. First, many existing species would not have been described until much later in the time period and so their loss would have gone unnoticed. Second, biologists know the number is higher than the written record suggests because now extinct species are being described from skeletal remains that were never mentioned in written history. And third, some species are probably already extinct even though conservationists are reluctant to name them as such. Taking these factors into account raises the estimated extinction rate to nearer 100 E/MSY. The predicted rate by the end of the century is 1500 E/MSY.
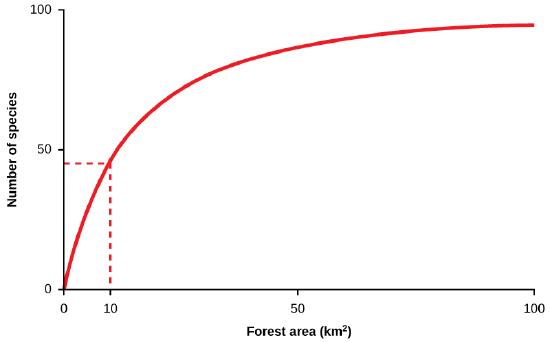
A second approach to estimating present-time extinction rates is to correlate species loss with habitat loss, and it is based on measuring forest-area loss and understanding species–area relationships. The species-area relationship is the rate at which new species are seen when the area surveyed is increased (Figure \(\PageIndex{5}\)). Likewise, if the habitat area is reduced, the number of species seen will also decline. This kind of relationship is also seen in the relationship between an island’s area and the number of species present on the island: as one increases, so does the other, though not in a straight line.
Estimates of extinction rates based on habitat loss and species–area relationships have suggested that with about 90 percent of habitat loss an expected 50 percent of species would become extinct. Reducing forest area from 100 km2 to 10 km2, a decline of 90 percent, reduces the number of species by about 50 percent (Figure \(\PageIndex{5}\)). Species–area estimates have led to estimates of present-day species extinction rates of about 1000 E/MSY and higher.
In this 9-minute video, discover why the current impacts of humans are as devastating to biodiversity as a large meteor.
Question after watching: What is lost when a species goes extinct? Consider all of the things that are lost, not just the biological ones.