Biology LibreTexts

6.1: Phylogenetic Trees

  • Page ID
    49526
    • Boundless
    • Boundless

    \( \newcommand{\vecs}[1]{\overset { \scriptstyle \rightharpoonup} {\mathbf{#1}} } \)

    \( \newcommand{\vecd}[1]{\overset{-\!-\!\rightharpoonup}{\vphantom{a}\smash {#1}}} \)

    \( \newcommand{\id}{\mathrm{id}}\) \( \newcommand{\Span}{\mathrm{span}}\)

    ( \newcommand{\kernel}{\mathrm{null}\,}\) \( \newcommand{\range}{\mathrm{range}\,}\)

    \( \newcommand{\RealPart}{\mathrm{Re}}\) \( \newcommand{\ImaginaryPart}{\mathrm{Im}}\)

    \( \newcommand{\Argument}{\mathrm{Arg}}\) \( \newcommand{\norm}[1]{\| #1 \|}\)

    \( \newcommand{\inner}[2]{\langle #1, #2 \rangle}\)

    \( \newcommand{\Span}{\mathrm{span}}\)

    \( \newcommand{\id}{\mathrm{id}}\)

    \( \newcommand{\Span}{\mathrm{span}}\)

    \( \newcommand{\kernel}{\mathrm{null}\,}\)

    \( \newcommand{\range}{\mathrm{range}\,}\)

    \( \newcommand{\RealPart}{\mathrm{Re}}\)

    \( \newcommand{\ImaginaryPart}{\mathrm{Im}}\)

    \( \newcommand{\Argument}{\mathrm{Arg}}\)

    \( \newcommand{\norm}[1]{\| #1 \|}\)

    \( \newcommand{\inner}[2]{\langle #1, #2 \rangle}\)

    \( \newcommand{\Span}{\mathrm{span}}\) \( \newcommand{\AA}{\unicode[.8,0]{x212B}}\)

    \( \newcommand{\vectorA}[1]{\vec{#1}}      % arrow\)

    \( \newcommand{\vectorAt}[1]{\vec{\text{#1}}}      % arrow\)

    \( \newcommand{\vectorB}[1]{\overset { \scriptstyle \rightharpoonup} {\mathbf{#1}} } \)

    \( \newcommand{\vectorC}[1]{\textbf{#1}} \)

    \( \newcommand{\vectorD}[1]{\overrightarrow{#1}} \)

    \( \newcommand{\vectorDt}[1]{\overrightarrow{\text{#1}}} \)

    \( \newcommand{\vectE}[1]{\overset{-\!-\!\rightharpoonup}{\vphantom{a}\smash{\mathbf {#1}}}} \)

    \( \newcommand{\vecs}[1]{\overset { \scriptstyle \rightharpoonup} {\mathbf{#1}} } \)

    \( \newcommand{\vecd}[1]{\overset{-\!-\!\rightharpoonup}{\vphantom{a}\smash {#1}}} \)

    \(\newcommand{\avec}{\mathbf a}\) \(\newcommand{\bvec}{\mathbf b}\) \(\newcommand{\cvec}{\mathbf c}\) \(\newcommand{\dvec}{\mathbf d}\) \(\newcommand{\dtil}{\widetilde{\mathbf d}}\) \(\newcommand{\evec}{\mathbf e}\) \(\newcommand{\fvec}{\mathbf f}\) \(\newcommand{\nvec}{\mathbf n}\) \(\newcommand{\pvec}{\mathbf p}\) \(\newcommand{\qvec}{\mathbf q}\) \(\newcommand{\svec}{\mathbf s}\) \(\newcommand{\tvec}{\mathbf t}\) \(\newcommand{\uvec}{\mathbf u}\) \(\newcommand{\vvec}{\mathbf v}\) \(\newcommand{\wvec}{\mathbf w}\) \(\newcommand{\xvec}{\mathbf x}\) \(\newcommand{\yvec}{\mathbf y}\) \(\newcommand{\zvec}{\mathbf z}\) \(\newcommand{\rvec}{\mathbf r}\) \(\newcommand{\mvec}{\mathbf m}\) \(\newcommand{\zerovec}{\mathbf 0}\) \(\newcommand{\onevec}{\mathbf 1}\) \(\newcommand{\real}{\mathbb R}\) \(\newcommand{\twovec}[2]{\left[\begin{array}{r}#1 \\ #2 \end{array}\right]}\) \(\newcommand{\ctwovec}[2]{\left[\begin{array}{c}#1 \\ #2 \end{array}\right]}\) \(\newcommand{\threevec}[3]{\left[\begin{array}{r}#1 \\ #2 \\ #3 \end{array}\right]}\) \(\newcommand{\cthreevec}[3]{\left[\begin{array}{c}#1 \\ #2 \\ #3 \end{array}\right]}\) \(\newcommand{\fourvec}[4]{\left[\begin{array}{r}#1 \\ #2 \\ #3 \\ #4 \end{array}\right]}\) \(\newcommand{\cfourvec}[4]{\left[\begin{array}{c}#1 \\ #2 \\ #3 \\ #4 \end{array}\right]}\) \(\newcommand{\fivevec}[5]{\left[\begin{array}{r}#1 \\ #2 \\ #3 \\ #4 \\ #5 \\ \end{array}\right]}\) \(\newcommand{\cfivevec}[5]{\left[\begin{array}{c}#1 \\ #2 \\ #3 \\ #4 \\ #5 \\ \end{array}\right]}\) \(\newcommand{\mattwo}[4]{\left[\begin{array}{rr}#1 \amp #2 \\ #3 \amp #4 \\ \end{array}\right]}\) \(\newcommand{\laspan}[1]{\text{Span}\{#1\}}\) \(\newcommand{\bcal}{\cal B}\) \(\newcommand{\ccal}{\cal C}\) \(\newcommand{\scal}{\cal S}\) \(\newcommand{\wcal}{\cal W}\) \(\newcommand{\ecal}{\cal E}\) \(\newcommand{\coords}[2]{\left\{#1\right\}_{#2}}\) \(\newcommand{\gray}[1]{\color{gray}{#1}}\) \(\newcommand{\lgray}[1]{\color{lightgray}{#1}}\) \(\newcommand{\rank}{\operatorname{rank}}\) \(\newcommand{\row}{\text{Row}}\) \(\newcommand{\col}{\text{Col}}\) \(\renewcommand{\row}{\text{Row}}\) \(\newcommand{\nul}{\text{Nul}}\) \(\newcommand{\var}{\text{Var}}\) \(\newcommand{\corr}{\text{corr}}\) \(\newcommand{\len}[1]{\left|#1\right|}\) \(\newcommand{\bbar}{\overline{\bvec}}\) \(\newcommand{\bhat}{\widehat{\bvec}}\) \(\newcommand{\bperp}{\bvec^\perp}\) \(\newcommand{\xhat}{\widehat{\xvec}}\) \(\newcommand{\vhat}{\widehat{\vvec}}\) \(\newcommand{\uhat}{\widehat{\uvec}}\) \(\newcommand{\what}{\widehat{\wvec}}\) \(\newcommand{\Sighat}{\widehat{\Sigma}}\) \(\newcommand{\lt}{<}\) \(\newcommand{\gt}{>}\) \(\newcommand{\amp}{&}\) \(\definecolor{fillinmathshade}{gray}{0.9}\)
    Learning Objectives
    • Describe the various types of phylogenetic trees and how they organize life

    Scientists use a tool called a phylogenetic tree, a type of diagram, to show the evolutionary pathways and connections among organisms. Scientists consider phylogenetic trees to be a hypothesis of the evolutionary past since one cannot go back to confirm the proposed relationships. In other words, a “tree of life”, as it is sometimes called, can be constructed to illustrate when different organisms evolved and to show the relationships among different organisms.

    Unlike a taxonomic classification diagram, a phylogenetic tree can be read like a map of evolutionary history. Many phylogenetic trees have a single lineage at the base representing a common ancestor. Scientists call such trees ‘rooted,’ which means there is a single ancestral lineage (typically drawn from the bottom or left) to which all organisms represented in the diagram relate. Notice in the rooted phylogenetic tree that the three domains (Bacteria, Archaea, and Eukarya) diverge from a single point and branch off. The small branch that plants and animals (including humans) occupy in this diagram shows how recent and miniscule these groups are compared with other organisms. Unrooted trees don’t show a common ancestor but do show relationships among species.

    image
    Figure \(\PageIndex{1}\): Phylogenetic trees: Both of these phylogenetic trees shows the relationship of the three domains of life (Bacteria, Archaea, and Eukarya), but the (a) rooted tree attempts to identify when various species diverged from a common ancestor, while the (b) unrooted tree does not.

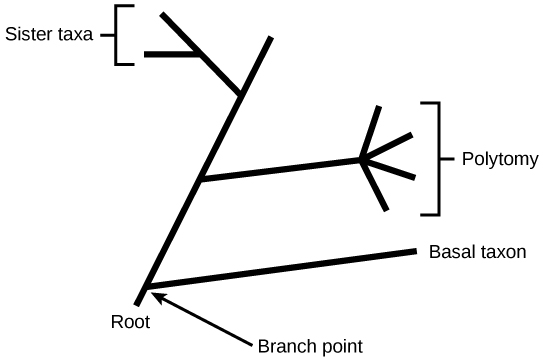
    In a rooted tree, the branching indicates evolutionary relationships. The point where a split occurs, called a branch point, represents where a single lineage evolved into a distinct new one. A lineage that evolved early from the root and remains unbranched is called basal taxon. When two lineages stem from the same branch point, they are called sister taxa. A branch with more than two lineages is called a polytomy and serves to illustrate where scientists have not definitively determined all of the relationships. It is important to note that although sister taxa and polytomy do share an ancestor, it does not mean that the groups of organisms split or evolved from each other. Organisms in two taxa may have split apart at a specific branch point, but neither taxa gave rise to the other.

    image
    Figure \(\PageIndex{1}\): Rooted phylogenetic trees: The root of a phylogenetic tree indicates that an ancestral lineage gave rise to all organisms on the tree. A branch point indicates where two lineages diverged. A lineage that evolved early and remains unbranched is a basal taxon. When two lineages stem from the same branch point, they are sister taxa. A branch with more than two lineages is a polytomy.

    Rooted phylogenetic trees can serve as a pathway to understanding evolutionary history. The pathway can be traced from the origin of life to any individual species by navigating through the evolutionary branches between the two points. Also, by starting with a single species and tracing back towards the “trunk” of the tree, one can discover that species’ ancestors, as well as where lineages share a common ancestry. In addition, the tree can be used to study entire groups of organisms.

    Another point to mention on phylogenetic tree structure is that rotation at branch points does not change the information. For example, if a branch point was rotated and the taxon order changed, this would not alter the information because the evolution of each taxon from the branch point was independent of the other.

    Many disciplines within the study of biology contribute to understanding how past and present life evolved over time; together, these disciplines contribute to building, updating, and maintaining the “tree of life.” Information is used to organize and classify organisms based on evolutionary relationships in a scientific field called systematics. Data may be collected from fossils, from studying the structure of body parts or molecules used by an organism, and by DNA analysis. By combining data from many sources, scientists can put together the phylogeny of an organism. Since phylogenetic trees are hypotheses, they will continue to change as new types of life are discovered and new information is learned.

    Key Points

    • Rooted trees have a single lineage at the base representing a common ancestor that connects all organisms presented in a phylogenetic diagram.
    • Branch points in a phylogenetic tree represent a split where a single lineage evolved into a distinct new one, while basal taxon depict unbranched lineages that evolved early from the root.
    • Unrooted trees portray relationships among species, but do not depict their common ancestor.
    • Phylogenetic trees are hypotheses and are, therefore, modified as data becomes available.
    • Systematics uses data from fossils, the study of bodily structures, molecules used by a species, and DNA analysis to contribute to the building, updating, and maintaining of phylogenetic trees.

    Key Terms

    • polytomy: a section of a phylogeny in which the evolutionary relationships cannot be fully resolved to dichotomies
    • basal taxon: a lineage, displayed using a phylogenetic tree, that evolved early from the root and from which no other branches have diverged
    • systematics: research into the relationships of organisms; the science of systematic classification
    • phylogeny: the visual representation of the evolutionary history of organisms; based on rigorous analyses

    This page titled 6.1: Phylogenetic Trees is shared under a not declared license and was authored, remixed, and/or curated by Boundless.

    • Was this article helpful?