
Carbon Capture Using Carbonic Anhydrase - Master
- Page ID
- 98731
|
Global Challenges
|
Climate Change Carbon Capture Using Carbonic Anhydrase |
Literature-Based Guided Assessment (LGA)
|


Key Words, Concepts: protein structure, structure/function relationships, enzyme kinetics, enzyme mechanisms, reaction mechanisms, Western blot analysis, site-directed mutagenesis, biomolecular visualization, computational modeling, graphic analysis
The Problem
Our climate is changing as planetary temperatures rise from increasing amounts of the greenhouse gas carbon dioxide released into the atmosphere (detailed in Chapter 31) on the burning of fossil fuels. The rate of release is unparalleled in geological history. Present levels (415 ppm) have not been seen for at least 3 million years. Human societies and cultures have had the opportunity to develop in relatively stable climatic conditions. Figure \(\PageIndex{1}\) below shows the rise in atmospheric CO2 over the last 1000 years.
Figure \(\PageIndex{1}\): CO2 levels in the atmosphere over the last 1000 years. Our world in data. https://ourworldindata.org/
The steep rise around 1790 coincides with the start of the industrial revolution. The rise in atmospheric CO2 has led to a corresponding rise in the average global temperatures, as illustrated in Figure \(\PageIndex{2}\) below.
Figure \(\PageIndex{2}\): Average global temperature changes over the last 1000 years. Our world in data. https://ourworldindata.org/
The per capita emissions of CO2 across the world derive from the use of coal, oil, and gas, as illustrated in Figure \(\PageIndex{3}\) below.
Figure \(\PageIndex{3}\): Per capita emission of CO2 from fossil fuel type
If we want to decrease emissions, we also need to know in which economic sectors fossil fuels are used. The main sources of global energy-related CO2 emissions by sector are shown in Figure \(\PageIndex{4}\):
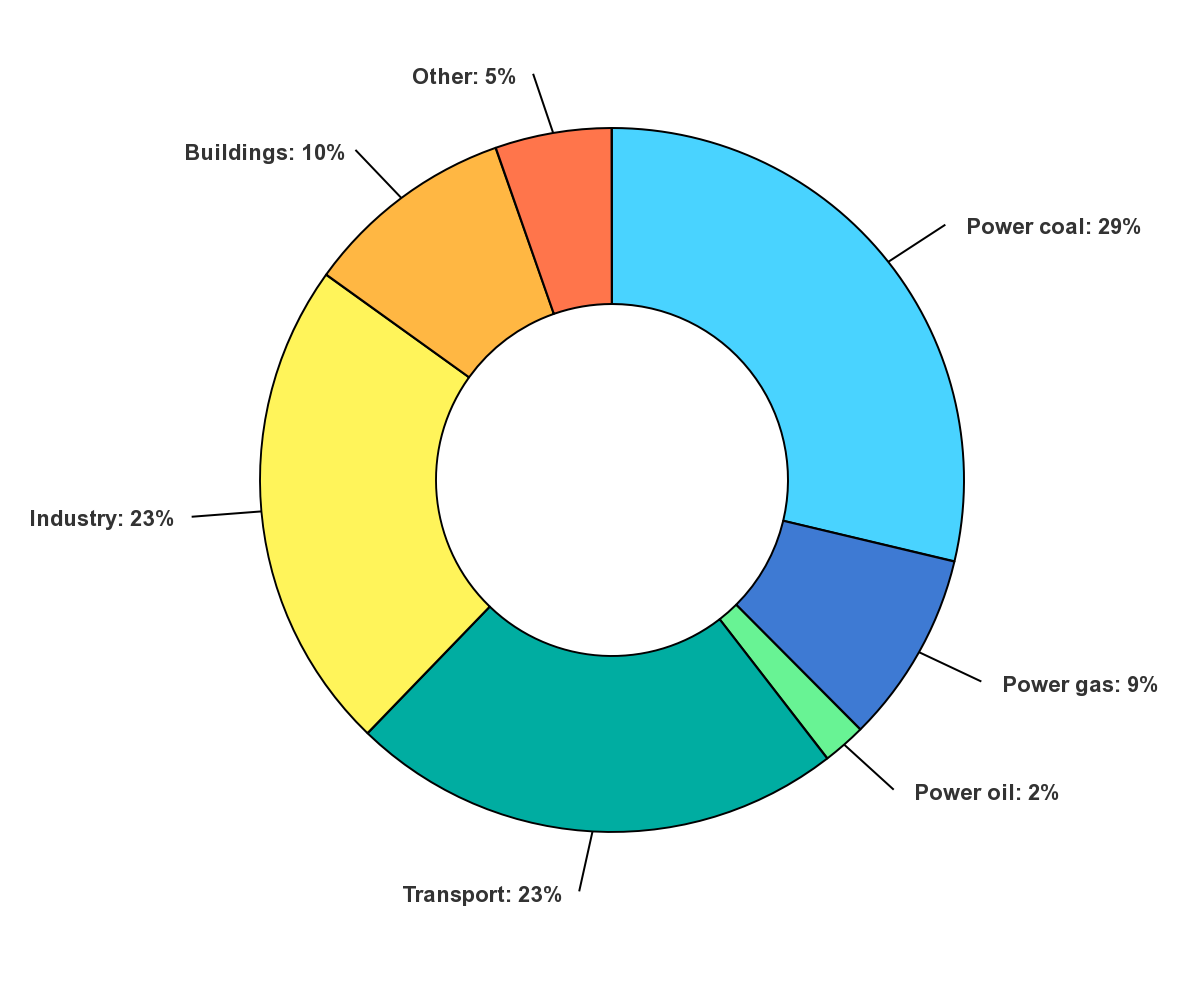
Figure \(\PageIndex{4}\): Global energy-related CO2 emissions by sector. Updated on 10/26/22. https://www.iea.org/data-and-statist...ions-by-sector. IEA. License: CC BY 4.0
Note the use of coal, gas, and oil for energy production (electricity) accounts for 40% of global CO2 emissions, with transportation (mostly through the use of gasoline and diesel fuel) and industry accounting for about 25% each.
Simple chemistry tells us that there are two ways to decrease the amount of product (in this case CO2) in a chemical reaction:
- decrease the concentration of reactants (i.e. reduce fossil fuel use)
- remove the product, in this case, CO2 from the air.
The latter process is called carbon capture or sequestration. It is a daunting process that nature has mastered (through photosynthesis), but it clearly can't keep up with the huge injection of CO2 in the atmosphere caused by burning fossil fuel.
We simply can't stop using fossil fuels, which would result in huge economic and social unrest. Alternative green fuels (solar, wind, for example) are being rapidly expanded but can't replace fossil fuels for many years. One of the reasons is that fossil fuels are very energy-dense (MJ/kg) compared to other sources of energy. It's also fascinating to look at the energy transitions humans have made over time. Figure \(\PageIndex{5}\) below shows the energy transition over a log-time scale (for presentation purposes) as well as the energy densities of individual sources.

Figure \(\PageIndex{5}\): Human-created energy transitions (log time scale) and energy densities of individual sources
New technologies are needed to capture CO2. We have to move much faster in a new clean energy transition than we have in our entire history. A potentially ideal solution would be to capture CO2 from power plants before they reach the atmosphere. We will now look at research into an old enzyme, carbonic anhydrase, that is being repurposed for industrial-level carbon capture, carbonic anhydrase.
Carbonic Anhydrase (CA)
We have already encountered this enzyme before (Chapter 6.1). It catalyzes the hydration of CO2 (g) as shown below.
CO2 (g) + H2O ↔ H2CO3 (aq) ↔ HCO3- (aq) + H+ (aq)
It is among the fastest of all enzymes, with a kcat of 106 s-1 and a kcat/Km of 8.3 x 10⁷ M-1s-1 (reference). It is diffusion controlled in that the rate of diffusion of reactants and products, not the chemical steps, determines the reaction rate. It can convert 106 molecules of CO2(g) to HCO3- each second. No wonder scientists and engineers are studying it to capture CO2. It's a big challenge though to capture CO2 released on combustion of coal or natural gas in a power plant. Here are two problems that must be overcome:
- The enzyme must be thermostable at elevated temperatures to capture the CO2 found in high-temperature power plant emissions
- The enzyme is reversible so it will be inhibited by the product HCO3-
- The enzyme must be stable to somewhat alkaline conditions (pH of 0.1M NaHCO3 = 8.3)
For carbon capture from fossil fuel emissions, CA is immobilized by surface adsorption, covalent attachment, encapsulation, and entanglement. Immobilized enzymes are typically more thermostable and can be used in flow-through as opposed to solution phase capture. The immobilized enzyme matrix must withstand high temperatures (up to 100°C, and alkaline solvents used to strip the matrix for reuse.
The enzyme is found throughout life and typically has an active site Zn2+. There are 8 families, α, β, γ, δ, ζ η, θ, and ι, with the α family being the most abundant. The α forms are generally active as dimers, but can act as monomers and tetramers. There are 15 isoforms of the α form in humans and have a prime role in pH regulation. They are found in bacteria, fungi, plants, and algae. β-CAs are found in some types of bacteria, Archaea, fungi, some higher plants, and invertebrates. CA in chloroplasts (and mitochondria (algae) are involved in carbon fixation. We will focus our attention on engineering carbonic anhydrase to make them more thermostable, alkali insensitive, and less susceptible to product inhibition by bicarbonate.
Natural enzymes can be isolated and selected for thermal and alkali stability. In addition, new versions selected for these properties can be engineered using directed evolution or site-directed mutagenesis. You wish to increase the thermal stability of a protein using mutagenesis. Essentially you wish to perturb the equilibrium between the folded (native) protein and the unfolded (denatured) protein so as to preferentially stabilize the native state.
Using mutagenesis, what residues might you change in a native protein to make it more stable at higher temperatures?
- Answer
-
A characteristic of the native state of the protein is its conformational stability compared to the conformational flexibility of the many possible denatured states. In addition, the protein must undergo conformational changes as it unfolds. Hence anything that restricts conformational flexibility might preferentially stabilize the native state. These would include changing single or pairs of side chains to allow the formation of more salt bridges and intrachain disulfide bonds, as well as hydrogen bonds. Loops with greater flexibility, as determined by B-factors in the crystal structure files, or by molecular dynamic simulations, could be changed to contain a disulfide, which would clearly stabilize a flexible loop.
What measurements would you make to quantitate the change in thermal stability?
- Answer
-
Measures a signal that changes with increasing temperature. The signal can be enzyme activity, or more easily a spectroscopic signal such as absorbance at 280 nm or fluorescence as a function of temperature. Alternatively, the stability at room temperature could be measured using urea as a perturbant. These are discussed in Chapter 4.12.
The actual amino acid composition and more strangely specific dipeptide sequences within a sequence are associated with thermal stability of hyperthermophilic proteins. For example, proteins from two different types of archaea with different optimal growth temperatures show that the one with the higher growth temperature have significantly higher levels of VK, KI, YK, IK, KV, KY, and EV and decreased levels of DA, AD, TD, DD, DT, HD, DH, DR, and DG. Similar experiments have been done in bacterial cells. Using machine learning, the dipeptide sequences K∗H, KR, TF, P∗M, F∗∗N, V∗∗Y, MW, and WQ were important in thermostability where the * denotes a gap in the residues.
Structure and Mechanism
An active site Zn2+ appears to bind a water molecule and reduce its pKa such that the bound form is OH-. This is illustrated in the left panel of Figure \(\PageIndex{6}\) below, which depicts the local environment of the bound Zn2+ (coordinated by histidine side chains and an OH-) in the absence (left) and presence (right) of CO2. Note that the back histidine is difficult to barely visible (but still evident) in both structures. To assist in viewing the structure, the right panel shows an interactive iCn3D model of Zn- human carbonic anhydrase II at pH 7.8 and 0 atm CO (6LUW).
 |
|
.png?revision=1&size=bestfit&width=216&height=251)
Figure \(\PageIndex{6}\): Left panel: Coordination of OH- to Zn2+ in carbonic anhydrase in the absence (left) and presence (right) of substrate CO2. Right panel: Zn- human carbonic anhydrase II at pH 7.8 and 0 atm CO (6LUW) (Copyright; author via source). Click the image for a popup or use this external link: https://structure.ncbi.nlm.nih.gov/i...43DYyZFvHJpZn9
What is the coordination geometry of the Zn ion?
- Answer
-
tetrahedal
Draw a simplified reaction mechanism showing bicarbonate formation from the two reactants, CO2 and OH-.
- Answer
-

The enzyme is reversible and in humans is important in CO2 transport in respiration and maintaining intracellular pH, which is also its key role in most organisms.
CO2, like the other atmospheric gases O2 and N2, are nonpolar and have limited solubility in water. The solubility of these gases in water at 20oC and 1 atm pressure, in g/L and mM, are shown in Table \(\PageIndex{1}\) below.
| Gas (ref) | solubility (aq) (g/L) | solubility (mM) |
| CO2 | 1.7 | 38 |
| O2 | 0.044 | 1.3 |
| N2 | 0.019 | 0.68 |
Offer reasons that explain the significantly higher (but still low) solubility of CO2 in water compared to O2 and N2.
- Answer
-
CO2 is considered a nonpolar molecule since it has no net molecular dipole. However, it does have 2 bond dipoles (pointing in opposite directions), so the carbon atom is δ+ while the Os are δ-. This probably contributes to its greater solubility than N2 and O2 which don't have bond dipoles. CO2 would not orient itself in a dipole electric field, but it would to some extent in a quadrupole (4 poles) electric field where the positive potentials are oriented north and south and the negative potentials at east and west. CO2 has a quadrupole moment. In addition, the continued reaction of CO2 and water to form the weak acid carbonic acid would contribute to its higher apparent solubility. It is not clear to the authors if these contributions to solubility are accounted for in the experimental values of solubility.

A quadruple and its associated magnetic field with oriented CO2. https://commons.wikimedia.org/wiki/F...quadrupole.svg
How does the enzyme facilitate the transport of CO2 in blood? How does it maintain intracellular pH?
- Answer
-
It converts the poorly soluble carbon unit in CO2 to the strongly soluble bicarbonate anion. HCO3-.
A simple explanation for maintaining intracellular pH comes from the chemical equation below.
CO2(aq) + H2O (l) ↔ H2CO3 (aq) + H2O(l) ↔ H3O+(aq) + HCO3-(aq).
HCO3- is the conjugate base of the weak acid, H2CO3 so the system is a classic buffer. For a complete explanation of why the system can act as a buffer at neutral pH even though the pKa of the weak acid is 3.6, see Chapter 2.3 for review.
We'll explore the structure of two different CAs, human carbonic anhydrase II and the carbonic anhydrase from Neisseria gonorrhea in this guided problem-solving module.
Human carbonic anhydrase II
The structure of native human carbonic anhydrase II and its catalytic mechanism is shown in Figure \(\PageIndex{7}\) below.
 |
 |
 |
|
Figure \(\PageIndex{7}\): Structure of native human carbonic anhydrase II (Zn-CA II) and its catalytic mechanism. Kim, J.K., Lee, C., Lim, S.W. et al.Nat Commun 11, 4557 (2020). https://doi.org/10.1038/s41467-020-18425-5. Creative Commons Attribution 4.0 International License, http://creativecommons.org/licenses/by/4.0/.
Panel a shows the active site consists of the zincbinding site, hydrophobic/hydrophilic regions, and the entrance conduit (EC).
Panel b shows the water networks in the active site that are responsible for the proton transfer (red) and substrate/product/water exchange (blue) during enzyme catalysis.
Panel c shows the forward reaction mechanism of Zn-CA II.
The active site itself lies at the bottom of a deep cavity (15 Å deep) in the protein, which is readily accessible to solvent
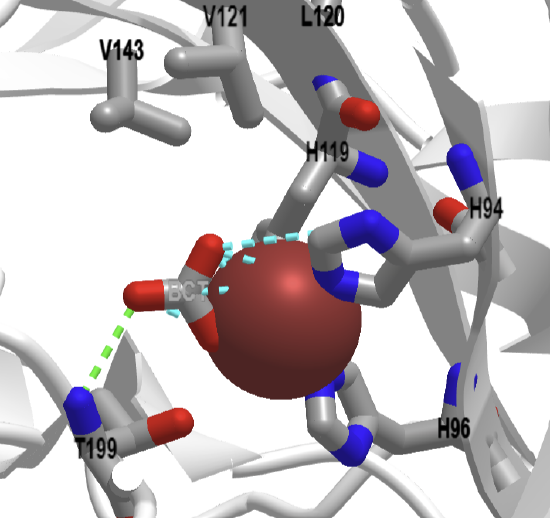
An interactive iCn3D model of human carbonic anhydrase II with bound bicarbonate and CO2 (2VVB) is shown in Figure \(\PageIndex{8}\) below.
.png?revision=1&size=bestfit&width=437&height=384)
 Figure \(\PageIndex{8}\): Human carbonic anhydrase II with bound bicarbonate and CO2 (2VVB) (Copyright; author via source).
Click the image for a popup or use this external link: https://structure.ncbi.nlm.nih.gov/i...ibgmgsm3UWhjX6
The active site residues shown in Figure 8 are labeled and shown as sticks. Bound CO2 and HCO3- are also shown as sticks.
 This question addresses the Biomolecular Visualization Framework theme(s) Molecular Interactions (MI), Atomic Geometry (AG)
Using iCn3D to show the noncovalent interactions between bicarbonate, Zn, and the protein by using iCn3D. Measure the distance between the hydrogen-bonded atoms in HCO3- and Thr 199.
iCn3D instructions
Trackpad and Mouse Controls
•rotate: click and drag (mouse: left click and drag)
•zoom: pinch and spread (mouse: rotate the scroll wheel)
•translate: two-finger click and drag (mouse: right click and drag)
•Re-center: left click View from the top menu bar, then select “Center Selection”
•Note: ctrl-click on a PC = command-click on Mac; alt-click on PC = option click on Mac
- Open the external link: https://structure.ncbi.nlm.nih.gov/i...ibgmgsm3UWhjX6
- From the top menu bar, choose Analysis, Interactions
- In the new popup window select the following prompts, then click 4. 3D Display interactions
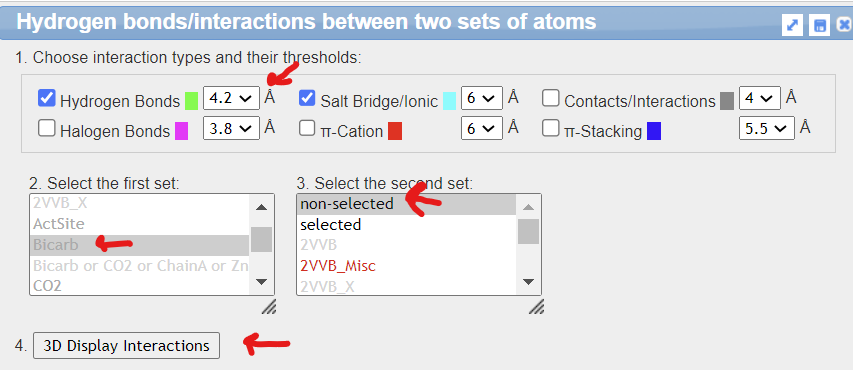
4. Close all but the main modeling window.
5. Zoom into the bicarbonate binding site. From the top menu bar, choose Analysis, Distance, distance between 2 atoms, and pick the two atoms (by holding down the Alt key or Option on a Mac) involved in the hydrogen bond between the bicarbonate and the amide
6. Rescale the label size by choosing Analysis, Label Scale, 0.4.
7. From the top menu bar choose Select, Toggle highlights to remove yellow and box highlights.
8. Save a PNG file by choosing
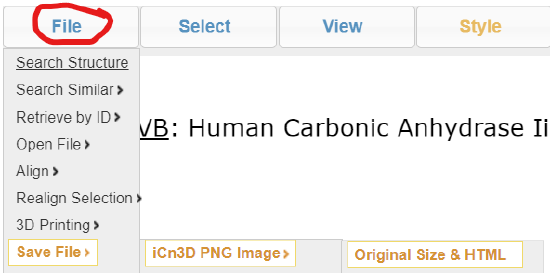
9. You can reload the PNG file directly into iCn3D by choosing File, Open File, iCn3D PNG image
- Answer
-
The blue dotted lines are ion-ion interactions. Note the green hydrogen bond between T199 and the bound bicarbonate. Remember that hydrogen atoms are not shown in PDB files from x-ray structures. The H-bond distance is 3.1 angstroms. For some reason, the H-bond does not show unless the initial constraint distances are moved to 4.2 Angstroms.
What is a likely function of Val, Leu and Trp cluster in CAII (shown in Figures 7 and 8)?
- Answer
-
These side chains are all hydrophobic (as illustrated in gold in Figure 7) and provide a weak binding environment for nonpolar CO2.
What ligand would likely replace OH- at low pH values? What would happen to the activity of the enzyme at lower pHs?
- Answer
-
At low pH, ie. at pH values lower than the pKa of the Zn-bound water (which deprotonates to form the OH- ligand and nucleophile), the ligand and nucleophile would be H2O. The enzyme would display a lower activity given the weaker nucleophile.
From the mechanism shown in Figure 7, does bicarbonate coordinate the Zn2+ ion in a monodentate or bidentate manner?
- Answer
-
Monodentate as only 1 coordinate covalent bond forms on an electron pair donation from the bicarbonate to the Zn2+.
Write a verbal description of the mechanism of CAII based on Figure 7
- Answer
-
CO2 binds to the active site through loose association with the cluster of hydrophobic side chains. The Zn2+ bound OH- acting as a nucleophile attacks the central carbon of the CO2 forming HCO3−. The carbonate forms a monodentate interaction with Zn and also a hydrogen bond to the side chain OH of Thr 199 (as well as one through the amide H). The HCO3- is then displaced by an incoming water molecule. The other product of the reaction, H+, moves through a hydrogen bond network of water molecules (W1 and W2) to His 64 and eventually to bulk water. The interactions with substrate and products are weak allowing fast exchange.
Why is a proton transfer path needed?
- Answer
-
H+ is a product of the reaction: CO2 (g) + H2O ↔ H2CO3 (aq) ↔ HCO3- (aq) + H+ (aq). It must depart to prevent charge build-up, maintain charge balance, and keep the correct electrostatic environment of the active site.
Thr 199 plays a key role in the mechanism. State a reason for its importance in the reversible reaction.
- Answer
-
Thr 199 supplies two hydrogen bonds to the bicarbonate (one through the side chain and through its amide H). It actually binds less tightly to bicarbonate than the T199A mutant. In the mutant, carbonate might bind Zn2+ in a bidentate fashion, which probably causes a tighter binding and a slower dissociation rate of the product, HCO3-.
The dissociation constant KD (or Kis) for bicarbonate binding to HCAII is about 77 mM. What kind of inhibitor might it be for the forward reaction?
- Answer
-
Given that it binds in the active site and would prevent binding of the substrate for the forward reaction, CO2, it is a competitive inhibitor.
Using the equation below, at what ratio of CO2/[HCO3-] would the rate for the forward reaction (CO2 sequestration) be cut in half? Assume the VM=1, KM forward reaction is 1, [S] = 1 and Kis is 2 (a wide range of values are reported in the Brenda Database.
\begin{equation}
v_0=\frac{V_M S}{K_M\left(1+\frac{I}{K is}\right)+S}
\end{equation}
If you need some help, hover over -
Give me a hint!- Answer
-
\begin{equation}
\begin{gathered}
v_{-I}=\frac{V_M S}{K_M+S}=\frac{(1)(1)}{(1+1)}=0.5 \\
v_{+I}=\frac{V_M S}{K_M\left(1+\frac{[I]}{K_{i s}}\right)+S}=\frac{(1)(1)}{1\left(1+\frac{[I]}{2}\right)}=0.25=\frac{1}{1+\frac{[I]}{2}} \\
0.25\left(1+\frac{[I]}{2}\right)=1 \\
1+\frac{[I]}{2}=4 \\
\frac{[I]}{2}=3 \\
{[I]=6}
\end{gathered}
\end{equation}Hence it doesn't take much HCO3- buildup to inhibit the "capture" of CO2!
The rate-limiting step for human CA II is the dissociation of a proton from Zn2+-bound water and not the removal of the resulting proton from the enzyme. What does that imply about the rate of removal of the proton from the enzyme?
- Answer
-
It must be very fast, that is at diffusion-controlled limits through the H-bond channel.
Synthetic mimetics of the active site of CA have been made. These are heteromacrocycles (similar to the heme of hemoglobin) as shown in Figure \(\PageIndex{9}\) below.

Figure \(\PageIndex{9}\):
The macrocycle mimetic has three imidazole groups coordinating zinc.
The macrocycle mimetic has three imidazole groups coordinating zinc. Is the bicarbonate coordinated to the Zn2+ in a monodentate or bidentate fashion? From the "denticities" of the interactions of bicarbonate and Zn2+ for human CAII and the mimetic, which catalyst, CAII or the macrocycle would you expect to have a lower KD for bicarbonate? How might this affect the rate-limiting step for the mimetic?
- Answer
-
The mimetic is bidentate, is it should bind more tightly to bicarbonate, hindering its dissociation, and hence making "product" inhibition more likely.
What is the utility of having both CO2 and HCO3- bind weakly to the enzyme
- Answer
-
"permits their rapid exchange. The hydrogen-bonding arrangement in the active site is such that the water or hydroxide ion donates a hydrogen bond to a proximal threonine (Thr199 in hCA II) because the hydroxyl group of this residue is forced to donate its hydrogen in a hydrogen bond to a negatively charged glutamate side chain (Glu106 in hCA II). Site-directed mutations have confirmed this model of the catalytic mechanism. The substrates/products carbon dioxide/bicarbonate are fairly weakly bound against a hydrophobic wall in the active site, which permits their rapid exchange."
Carbonic anhydrase from Neisseria gonorrhea (ngCA)
Data from: Jo, B., Park, T., Park, H. et al. Engineering de novo disulfide bond in bacterial α-type carbonic anhydrase for thermostable carbon sequestration. Sci Rep 6, 29322 (2016). https://doi.org/10.1038/srep29322. Creative Commons Attribution 4.0 International License. http://creativecommons.org/licenses/by/4.0/
Now that we understand the general chemistry, structure, and reaction mechanism of carbon anhydrase (at least the alpha human CAII form), let's explore efforts to engineer more thermostable variants. One example is the carbonic anhydrase from N. gonorrheas. This CA has been used as a target for mutagenesis to increase thermal stability of the enzyme, through the introduction of new disulfide bonds.
Even though only about 35% of the amino acids are identical, the overall structures are similar. This is illustrated in Figure \(\PageIndex{10}\) below.
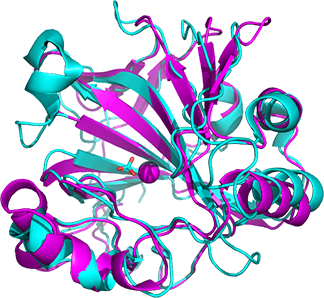
Figure \(\PageIndex{10}\): Alignment of the carbonic anhydrase from Neisseria gonorrhea (NG-CA) magenta,1KOQ) and human CA II (cyan, 2VVB)
The active site is mostly conserved compared to human CA II. The Zn2+ bound water has a pKa of around 6.5, compared to the value of 7.0 in human CA II. The hydrophobic patch (pocket) is similar, with Phe 93, Leu 153 and Tyr 72 in the NG-CA replacing Phe 95, Phe 176, Phe 70 in human CA II, respectively. The histidine ligands to Zn2+ are His92 (94), His94 (96), and His111 (119), where the numbers in parentheses represent Hu CA II. The proton removed from Zn2+ bound water is transferred to His 66 (64 in human CA II) and then to His 64.
The single disulfide bond between 181 and C28 is shown in Figure \(\PageIndex{1}\) below

Figure \(\PageIndex{11}\): Single disulfide bond between 181 and C28 in wild type Carbonic anhydrase from Neisseria gonorrhea
This question addresses the Biomolecular Visualization Framework theme(s) Atomic Geometry (AG)
Identify the correct torsion angles in Figure \(\PageIndex{x}\) above. Verbal definitions of torsional angles in a peptide chain are listed below. The successive atoms after the Cα leading away from the backbone atoms are Xβ-Xγ-Xδ-Xε (in that order). C is the backbone carbonyl C and N is the backbone nitrogen atom.
- phi (φ) is the angle of right-handed rotation around N-Cα bond. φ = 0 if the Cα-C bond is cis (eclipsed) to the C-N bond. Values range from -180 to 180 degrees.
- psi (ψ) is the angle of right-handed rotation around Cα -C bond. ψ = 0 if the C-N bond is cis (eclipsed) to the N-Cα bond. Values range from -180 to 180 degrees.
- chi1 (χ1) is the rotation around N-Cα-Xβ-Xγ
- chi2 (χ2) is the rotation around Cα-Xβ-Xγ-Xδ
- chi3 (χ3) is the rotation around Xβ-Xγ-Xδ-Xε
- Answer
-
phi (Φ) = b, psi (Ψ) = a, chi1 (χ1) = c, chi2 (χ2) = d, and chi3 (χ3) = e
This question addresses the Biomolecular Visualization Framework theme(s) Atomic Geometry (AG), Topology and Connectivity (TC)
Figure \(\PageIndex{12}\) below shows an interactive iCn3D model of the atoms within 4A of the disulfide bond in Carbonic anhydrase from Neisseria gonorrhea (1KOQ). Rotate the model to determine the approximate chi3 (χ3) dihedral angle. Hint: site down the S-S bond.
.png?revision=1&size=bestfit&width=360)
Figure \(\PageIndex{12}\): Atoms within 4A of the disulfide bond in Carbonic anhydrase from Neisseria gonorrhea (1KOQ). Click the image for a popup or use this external link: https://structure.ncbi.nlm.nih.gov/i...nutjP6EL2PubRA
- Answer
-
The visually estimated chi3 (χ3) angle for rotation around the S-S bond is 90o. Here is the actual angle (image made with Pymol)

We mentioned previously that variants with higher thermal stability are likely to be more rigid and less flexible. Flexibility can be determined through analysis of molecular dynamic simulations and also by examining of the B factor values in PDB file. This number is a measure of the displacement of an atom from a mean The numbers in the last column in the file are called the temperature factors or B-factor. The B-factor describes the mean-square displacement, a measure of the displacement of an atom from an average value. If the atoms are more flexible, the electron density determined in x-ray structures is lower than if the atoms are more fixed, which gives high electron density.
To make stabilizing disulfide bonds, investigators found site chains close enough that when mutated to cysteines could potentially form disulfide bonds. In addition, they search for such residues in surface loops (without alpha and beta structure) which are inherently more flexible. Introducing disulfide bonds into the loop would stabilize it and make it more rigid. Table \(\PageIndex{2}\) below shows a description of the double cysteine CA variants in the study.
| Variant designation | Position | Wild-type residues | Loop length | Sum of B-factors |
|---|---|---|---|---|
| T133C/D197C | 133, 197 | Thr/Asp | 63 | 87.60 |
| P56C/P156C | 56, 156 | Pro/Pro | 99 | 80.82 |
| N63C/P145C | 63, 145 | Asn/Pro | 81 | 77.17 |
Table \(\PageIndex{2}\): Description of the double cysteine CA variants in ngCA
The locations of the side chair targeted for mutations to cysteine pairs are shown in Figure \(\PageIndex{13}\) below.

Figure \(\PageIndex{13}\): 3D structure of ngCA and location of residue pairs for disulfide engineering
The zinc (not shown)-coordinating histidine residues in the catalytic active site are shown in green. The proton shuttle histidine residue is shown in magenta. The native disulfide bond is colored yellow.
An interactive iCn3D model of carbonic anhydrase from Neisseria gonorrhea (1KOQ) highlighting the 3 pairs of sidechains for mutations is shown in Figure \(\PageIndex{14}\) below.
V2.png?revision=1&size=bestfit&width=342&height=340)
Figure \(\PageIndex{14}\): Carbonic anhydrase (Neisseria gonorrhea) with 3 paired side chains for engineered disulfide (1KOQ) (Copyright; author via source).
Click the image for a popup or use this external link: https://structure.ncbi.nlm.nih.gov/i...KRP2tFJ1pV1FF6
The mutations were made and the wild-type proteins and three mutants were subjected to SDS-polyacrylamide gel electrophoresis (SDS-PAGE). The stained gels are shown in Figure \(\PageIndex{15}\) below.

Figure \(\PageIndex{15}\): Expression and purification of disulfide CA variants.
Panel (a) shows the expression of the protein in transformed cells 25 °C after IPTG induction and fractionated into soluble and insoluble fractions. SHuffle strain, an engineered E. coli strain that promotes cytoplasmic disulfide bond formation, was used.
Panel (b) shows purification results. Each lane was loaded with 4 μg of each purified CA variant. The proteins were visualized with Coomassie blue staining after SDS-PAGE. The arrow indicates the position of the bands corresponding to ngCA variants. Lane: M, molecular weight marker; S, soluble fraction; IS, insoluble fraction.
a. Interpret the results of the PAGE gels in Figure \(\PageIndex{15}\) above
b. How pure were the proteins based on the PAGE gel result in Panel (b). Can you infer from the gel that the proteins folded correctly?
- Answer
-
a. It appears to show that a small fraction of the wild type and each mutant, especially the N63C/P145C pair, was found in the insoluble fraction. This might result from improper folding of the proteins in E. Coli, leading to hydrophobic side chain surface exposure and aggregation into insoluble "inclusion bodies". This appears to be just a minor issue.
b. All the proteins appear very pure with some very small levels of contamination in the N63C/P145C. The PAGE results show the protein all have the same molecular weight but whether they folded to a native state with activity can not be determined. Nor can it be determined if the disulfide pairs in the mutants were made are if they were, were correctly paired.
The investigators next determined if the expressed and purified wild-type and mutant proteins had the correct number of disulfide bonds. They did this by reacting the proteins in the absence and presence of dithiothreitol with DTNB or 5,5'-dithiobis(2-nitrobenzoic acid), also called Ellman's Reagent. Both structures are shown in Figure \(\PageIndex{16}\) below.

Figure \(\PageIndex{16}\): Structures of DTT and DTNB
DTT is a reducing agent that cleaves disulfide.
Draw a mechanism showing the reaction of a disulfide with DTT.
- Answer
-

Only surface and not buried free cysteines will be labeled unless the protein is unfolded to expose all the cysteines.
Draw a mechanism showing the reaction of free sulfhydryl (like Cys) with Ellman's reagent
- Answer
-

Only surface and not buried free cysteines will be labeled unless the protein is unfolded to expose all the cysteines.
The results of the reaction of the proteins with Ellmans's agent, in the presence and absence of DTT, are shown in Table \(\PageIndex{3}\) below.
| CA variant | Free thiol/protein (mol/mol) a | Deduced no. S-S bonds | |
|---|---|---|---|
| −DTT | +DTT | ||
| Wild-type | 0.06 ± 0.02 | 1.80 ± 0.14 | ? |
| T133C/D197C | 0.08 ± 0.02 | 3.79 ± 0.22 | ? |
| P56C/P156C | 0.06 ± 0.03 | 3.89 ± 0.06 | ? |
| N63C/P145C | 0.08 ± 0.03 | 3.75 ± 0.05 | ? |
Table \(\PageIndex{3}\): Analysis of disulfides in CA using Ellman's reagent. aNumbers are represented in mean ± SD.
How many S-S would you deduce from the table are present in the wild-type and mutant enzymes? Did the correct disulfide bonds form? Explain your answers
- Answer
-
DTT reduces the disulfide in protein. For each disulfide, two free Cys side chains are made. The molar ratio of CysSH/CA for the wild-type is 1.8 in the presence of DTT. The value is very close to the expected value of 2. For the mutants, the ratio is about 3.8 in the presence of DTT, suggesting 4 free Cys consistent with 2 disulfide bonds.
Table \(\PageIndex{4}\) below shows the catalytic activities of the disulfide CA variants at 25 °C.
| CA variant | CO2 hydration activity | |||
|---|---|---|---|---|
| Relative esterase activity a | kcat × 10−4 (s−1) | K M (mM) | kcat /KM × 10−6(M−1 s−1) | |
| Wild-type | 1.00 | 1.44 | 14.2 | 1.01 |
| T133C/D197C | 1.49 | 1.97 | 16.7 | 1.18 |
| P56C/P156C | 1.03 | 1.44 | 16.9 | 0.85 |
| N63C/P145C | 0.55 | 0.27 | 17.3 | 0.16 |
Table \(\PageIndex{4}\): catalytic activities of the disulfide CA variants at 25 °C aThe specific activity of the wild-type corresponds to 0.22 U/μmol-enzyme.
Why did the investigators conduct this experiment? Interpret the results
- Answer
-
All of the previous results suggest that the mutant proteins were made and had the correct number of double bonds, but the experiments could not tell if the bond pairs were correct. For example, did the T133C/D197C contain a native (C28-C181) and mutant (C133-C197) bond and not another combination? Activity is an excellent predictor of structure. All but one mutant retained nominal activity, as evidenced by a comparison of the rat constants. The N63C/P145C had a 6x lower kcat, but even then it is close to diffusion-controlled.
Now comes the big question: were the investigators able to engineer thermal stability into the carbonic anhydrase? Experimental results to show the thermostability of the disulfide CA mutants are shown in Figure \(\PageIndex{17}\) below.

Figure \(\PageIndex{17}\): Thermostability of the disulfide CA variants
Panel (a) shows short-term kinetic stability. The enzyme solutions (40 μM) were incubated for 30 min at different temperatures, and the residual activities were measured by esterase activity assay. Activities of 100% correspond to untreated samples. Panel (b) shows long-term kinetic stability at 70 °C. The half-lives (t1/2) of the CA variants were estimated by fitting the experimental data to an exponential decay curve. Each value represents the mean of at least three independent experiments, and the error bars represent the standard deviations.
Analyze the results in Panels (a) an (b). Which protein was most thermostable over the short (30 minute) and long (hours) incubating time at elevated temperatures?
- Answer
-
At 80 °C, all the mutants showed increases thermostability to short term (30 minute) heating, but one, N63C/P145C was exceptionally thermostable. Longer time courses for heating at 70°C showed that the N63C/P145C was again far more stable over time. Its t1/2 was 31.4 h, compared to the values between 4-6 h for the others.
Panel (c) shows heat-induced denaturation of disulfide CA variants. Temperature-dependent changes of the circular dichroism ellipticity were recorded at 220 nm on CD spectrometer. The denaturation curves were normalized to the fraction of unfolded protein. The horizontal dashed line indicates the point at which the fraction of unfolded protein is 0.5. The vertical dashed lines point to TM values. Panel (d) shows the overall RMSD of disulfide variants from molecular dynamic simulations performed at 400 K for 20 ns.
Analyze the results in Panel (c). What do changes in the CD helicity show? Which protein was most thermostable based on TM values? Is the decrease in enzyme activity in panels (a) and (b) result from the denaturation of the protein?
- Answer
-
CD measurements can give a measure of the retention of secondary structure (alpha helices and beta structure) on denaturation. The CD spectrum for different secondary structures is shown below (From Chapter 3.5).
The curves were normalized to fit on a 0-1 scale on the y axis, which then gives a measure of percent denaturation. The temperature half-way up is the TM, or "melting temperature, at which an equilibrium mixture would contain half native and half denatured protein (true for a small protein with no intermediates). The TM values were for the wild-type, T133C/D197C, P56C/P156C, and N63C/P145C mutants 73.6 °C 74.7 °C, 77.4 °C, and 81.4 °C. These parallel the t1/2 values for enzyme activities, and support the idea that denaturation led to inactivation of the enzyme.
Analyze the molecular dynamics simulation results in Panel (d)
- Answer
-
The molecular dynamic simulations for all the proteins soon reach equilibrium values as indicated in the plateaus of average room mean square deviation of the protein backbone. The overall molecular root-mean-square deviation (RMSD) of N63C/P145C was the lowest, indicating that it was most rigid. This is in accord with the idea that increased flexibility destabilizes a protein and engineering a disulfide into makes it more rigid and hence more stable to temperature increases. The results are in accordance with the other experiments that show the N63C/P145C was the most thermostable.
" In addition, T133C/D197C showed the highest values in both the overall and the residual RMSD (Fig 3D). This may explain and correlate with the increased activity of T133C/D197C (Ta) and the increased ΔS of unfolding"
You may remember from both introductory chemistry and from Chapter 4.12, that you can calculate the thermodynamic parameters, ΔHo and ΔSo for N ↔D at room temperature from thermal denaturation curves using the van't Hoff equation.
In this case, Keq values can be calculated from thermal denaturation curves by monitoring change in CD signal at 220 nm, and applying this equation (also from Chapter 3.12).
\begin{equation}
K_{e q}=\frac{[D]_{e q}}{[N]_{e q}}=\frac{f_D}{f_N}=\frac{f_D}{1-f_D}
\end{equation}
From this, we can calculate ΔG0.
\begin{equation}
\Delta \mathrm{G}^0=-\mathrm{R} \operatorname{Tln} \mathrm{K}_{\mathrm{eq}}=-\mathrm{R} \operatorname{Tln}\left[\frac{\mathrm{f}_{\mathrm{D}}}{1-\mathrm{f}_{\mathrm{D}}}\right]
\end{equation}
Knowing Keq, ΔH0, DS0 can be calculated as shown below. A semi-log plot of lnKeq vs 1/T is a straight line with a slope of - ΔH0R and a y-intercept of + ΔS0/R, where R is the ideal gas constant.
\begin{equation}
\begin{gathered}
\Delta \mathrm{G}^{0}=\Delta \mathrm{H}^{0}-\mathrm{T} \Delta \mathrm{S}^{0}=-\mathrm{RTln} \mathrm{K}_{\mathrm{eq}} \\
\ln \mathrm{K}_{\mathrm{eq}}=-\frac{\Delta \mathrm{H}^{0}-\mathrm{T} \Delta \mathrm{S}^{0}}{\mathrm{RT}} \\
\ln \mathrm{K}_{\mathrm{eq}}=-\frac{\Delta \mathrm{H}^{0}}{\mathrm{RT}}+\frac{\Delta \mathrm{S}^{0}}{\mathrm{R}}
\end{gathered}
\end{equation}
The equation below shows that the derivative of equation (8) with respect to 1/T (i.e. the slope of equation 8 plotted as lnKeq vs 1/T) is indeed -ΔH0/R. Equation (9) is the van 't Hoff equation, and the calculated value of the enthalpy change is termed the van 't Hoff enthalpy, ΔH0vHoff.
\begin{equation}
\frac{d \ln \mathrm{K}_{\mathrm{eq}}}{d(1 / \mathrm{T})}=-\frac{\Delta \mathrm{H}^{0}}{\mathrm{R}}=-\frac{\Delta \mathrm{H}_{\mathrm{vHoff}}^{0}}{\mathrm{R}}
\end{equation}
Using this method, the thermodynamic parameters for unfolding of the protein were calculated. The results are shown in Table \(\PageIndex{4}\) below.
| CA variant | Melting temperature, TM (°C) | Enthalpy change of unfolding, ΔH (kcal mol−1) | Entropy change of unfolding, ΔS (kcal mol−1 K−1) |
|---|---|---|---|
| Wild-type | 73.6 | 48.8 | 0.141 |
| T133C/D197C | 74.7 | 52.8 | 0.153 |
| P56C/P156C | 77.4 | 35.1 | 0.091 |
| N63C/P145C | 81.4 | 30.0 | 0.085 |
Table \(\PageIndex{4}\): Thermodynamic parameters for protein unfolding for WT and mutant CAs
Which effects, enthalpy or entropy of unfolding, were associated with the increased thermal stability of the mutants compared to the wild-type protein. Remember were are considering the denaturation reaction, N↔ D.
- Answer
-
For the reaction N ↔ D, the ΔH0 values were all positive, indicating the enthalpy changes favored the native state, not the denatured state.
However, the T133C/D197C mutant was more stable enthalpically and a bit less stable entropically (remember that the overall entropic contribution to ΔG0 is the term -TΔS0.
In contrast, the other two mutants were enthalpically destabilized compared to the wild-type as their ΔH0 were less positive so compared to the wild-type. The prime stabilizer of the native state was the lower entropy (hence a less negative and favored -TΔS0 for the denaturation reaction. This makes sense in these mutants are more rigid and would experience less loss of "conformational entropy).
P56C/P156C and N63C/P145C exhibited lower ΔH (destabilizing) and ΔS (stabilizing), showing that the decreased entropic change of unfolding (i.e., the loss of conformational entropy of the unfolded state) by the disulfide bridge was the primary factor for the thermostabilization. These results are not surprising because design strategies aiming ‘entropic stabilization’ such as disulfide engineering do not always result in engineered proteins ideally with lower ΔS and unchanged ΔH.
These results are in accord with the observation that N63C/P145C was the most thermostable variant and that T133C/D197C showed the highest values in both the overall and the residual RMSD (Fig. 3d). This may explain and correlate with the increased activity of T133C/D197C and the increased ΔS of unfolding.
Finally, the enzymatic activity of the wild-type and mutants CAs (using a small ester substrate) were studied as a function of temperature. The relative activity of the wild-type and all 3 disulfide mutants are plotted as a function of temperature in the histogram graphs shown in Figure \(\PageIndex{18}\) below.

Figure \(\PageIndex{18}\): Effect of temperature on the activity of disulfide CA variants.
Esterase activities of disulfide variants were measured at each temperature and normalized to the activity of each enzyme at 25 °C. Each value represents the mean of three independent experiments, and the error bars represent the standard deviations. If you plotted the data as curves, you would get bell-shaped graphs.
Explain why the histogram plots (and line plots if they were drawn) are bell-shaped. Are the results in accordance with the previous results.
- Answer
-
Yes. Most chemical reaction show an increase in rate with increasing temperatures until competing reactions take precedence. For an enzyme-catalyzed reaction, that competing reaction is denaturation, which decreases the rate.
Yes the graphs are in accord with the previous results. The N63C/P145C certainly stands out as the best mutant. The authors write that "considering the shifted optimal temperature and the thermoactivation as well as the enhanced thermostability, the disulfide engineered α-type CA with Cys63-Cys145 can be a promising biocatalyst for efficient CO2 sequestration performed under high temperature conditions."
Disulfide engineering
Craig, D.B., Dombkowski, A.A. Disulfide by Design 2.0: a web-based tool for disulfide engineering in proteins. BMC Bioinformatics 14, 346 (2013). https://doi.org/10.1186/1471-2105-14-346. Creative Commons Attribution License (http://creativecommons.org/licenses/by/2.0),
Several computational programs have been developed to determine amino acid pairs that could be mutated to high-temperature stabilizing disulfide bonds. The stabilizing effects appear largest when the disulfide bond is made within the largest (and most flexible) loops (between 25-75 residues). These loops also had the highest residue B-factors.
In selecting pairs to form engineered disulfide, not only proximity (distance) but also geometry (torsion angles) of the resulting disulfide bond are important. We saw this previously in the analysis of the energy of butane rotamers, as illustrated in Figure \(\PageIndex{19}\) below.

Figure \(\PageIndex{19}\): Newman projections for butane
Programs to determine amino acid pairs to mutate for disulfide bond formation test S-S bond torsional stability by determining the torsion angle χ3 for the S-S bond. Evaluation of a database of many native proteins shows the χ3 angle are centered in two major peaks at -87 and +97 degrees, as shown in Figure \(\PageIndex{20}\) below

Figure \(\PageIndex{30}\): Distribution of χ 3 torsion angles observed in 1505 native disulfide bonds found in 331 PDB protein structures. Peaks occur at -87 and +97 degrees.
Does your calculated value of χ3 for the native disulfide in carbonic anhydrase from Neisseria gonorrhea follow the observed angles?
- Answer
-
At about 90o so yes it does.
An empirical energy equation was developed to determine the E vs χ3 dihedral angle for disulfide bonds. It is shown below.
\begin{equation}
E\left(\chi_3\right)=4.0\left[1-\cos \left(1.957\left[\chi_3+87\right]\right)\right]
\end{equation}
A graph of the equation is shown in Figure \(\PageIndex{21}\) below
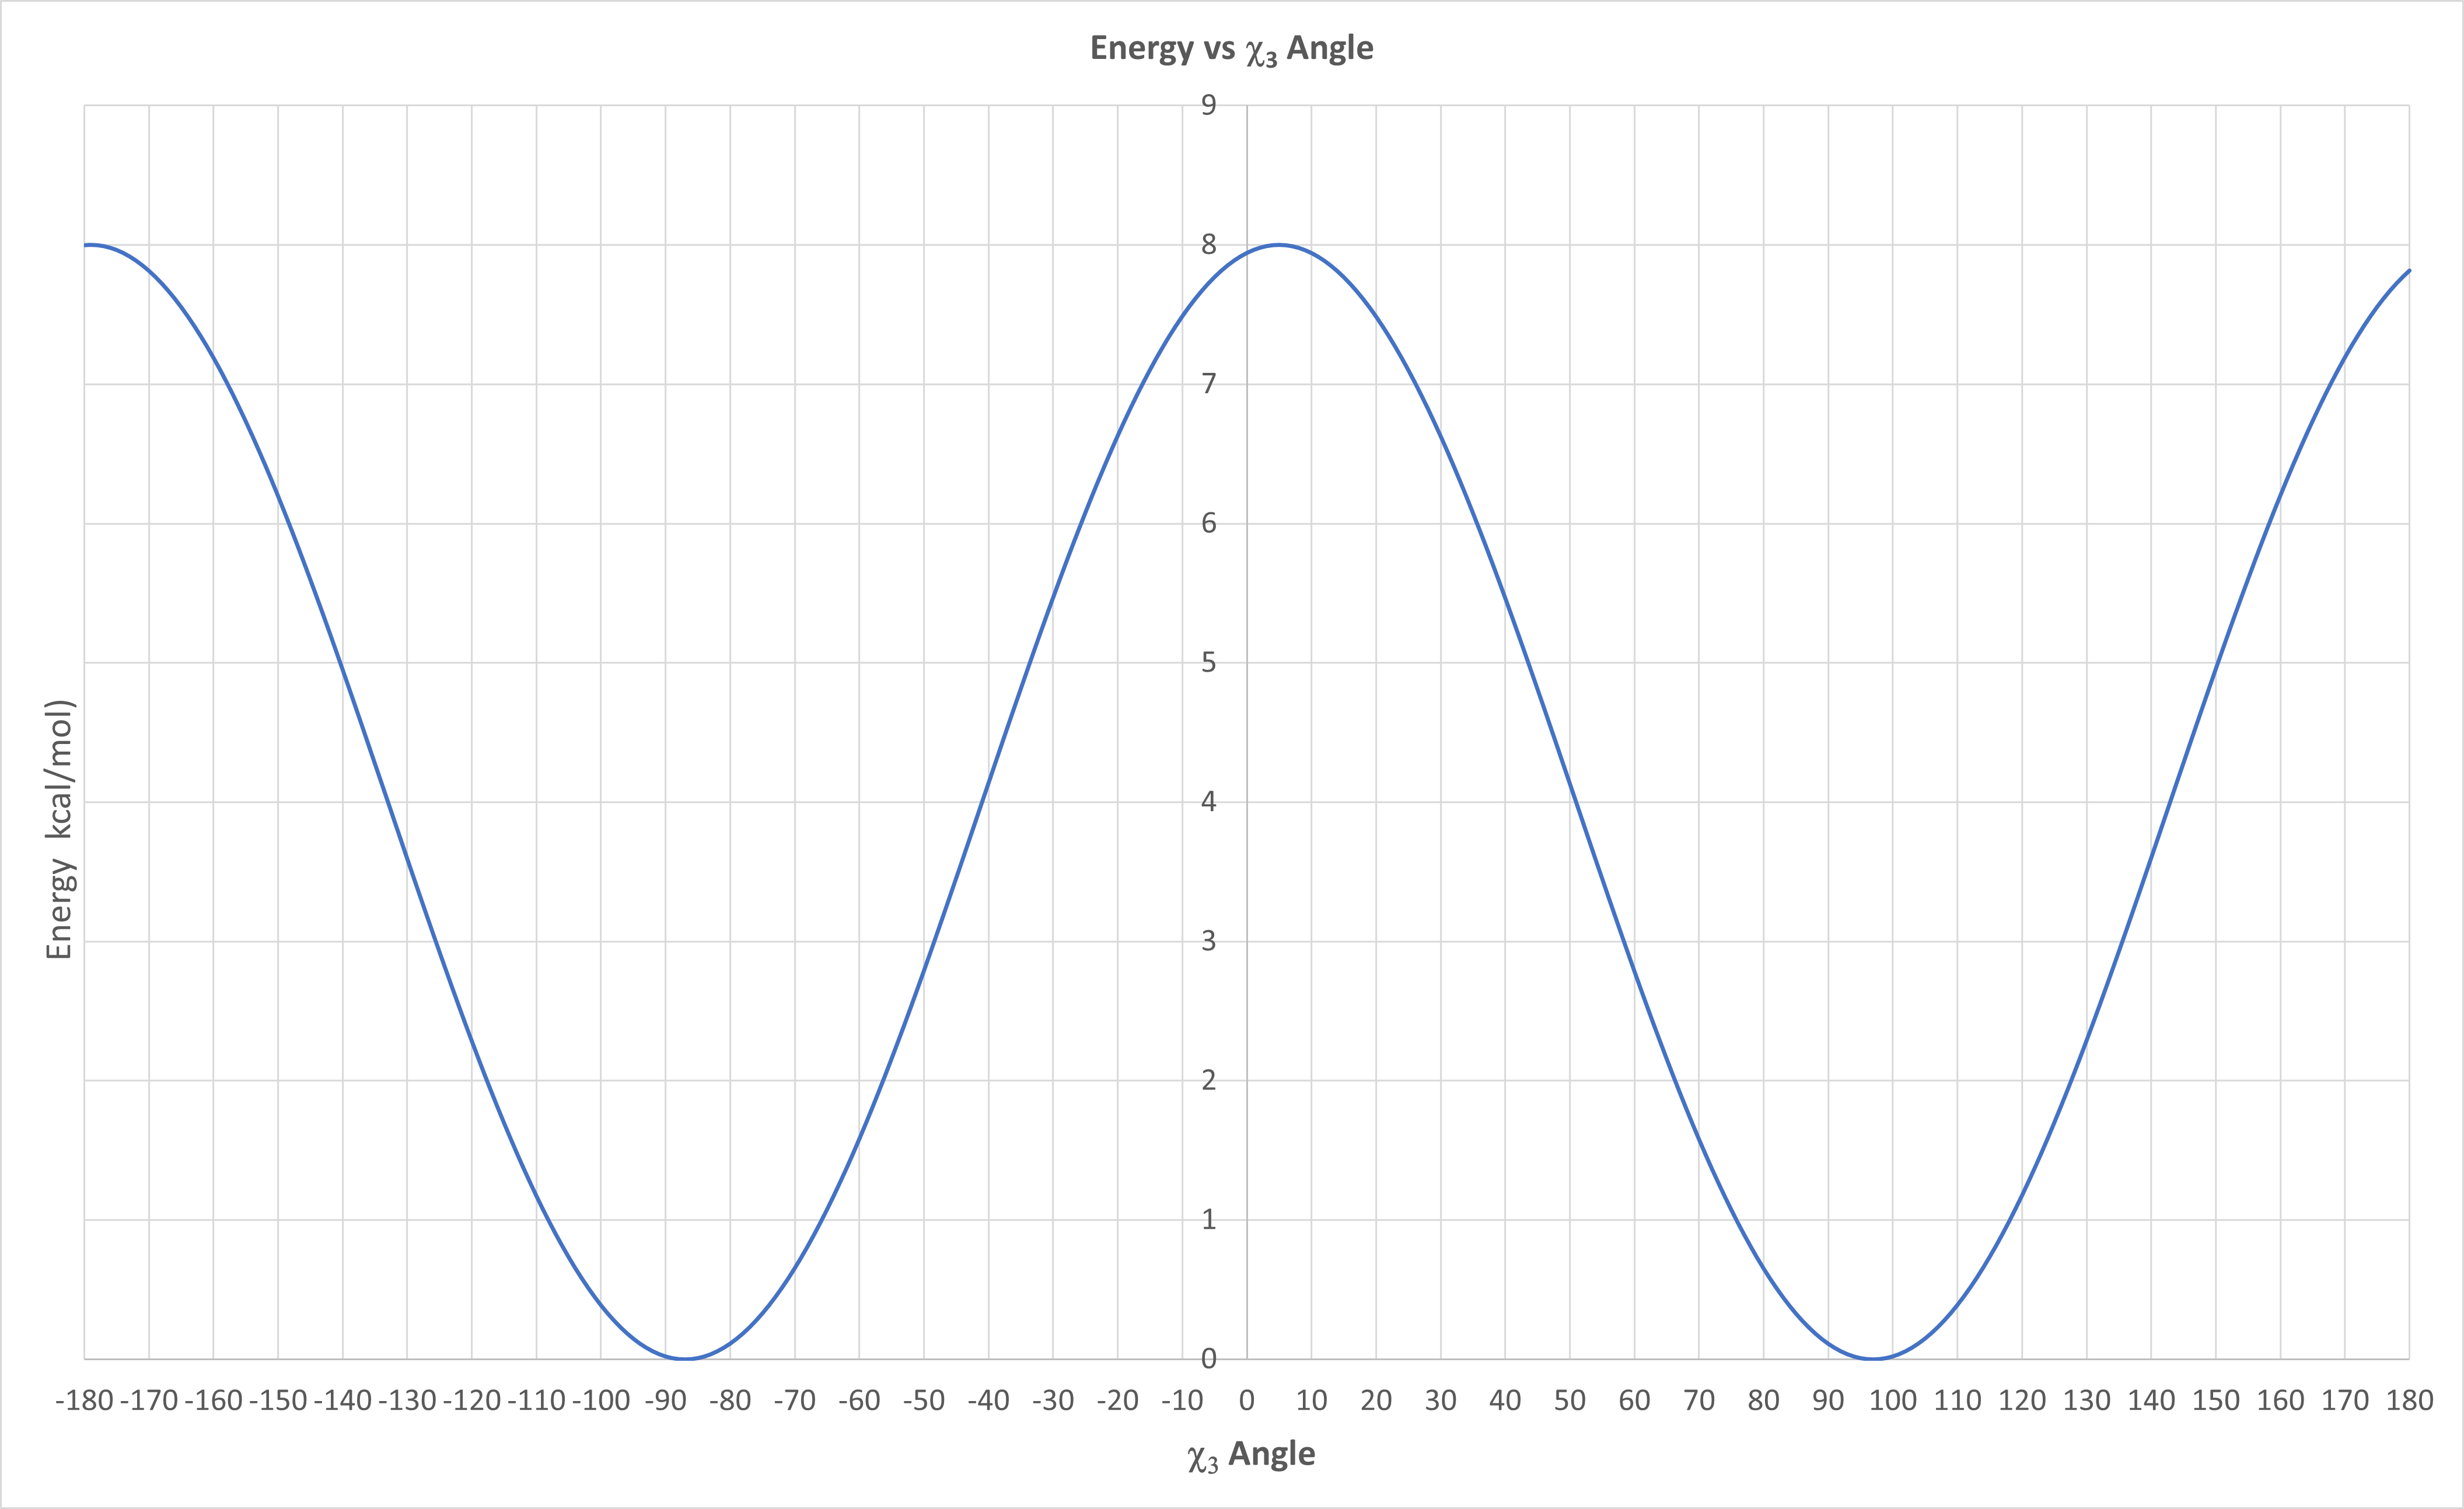
Figure \(\PageIndex{21}\): E vs χ3 dihedral angle for disulfide bonds from empirical equation
Figure \(\PageIndex{22}\) shows the distribution of energy values in the 1505 native disulfide bonds using our updated function. We found that 90% of native disulfides have an energy value less than 2.2 kcal/mol. This value provides a convenient guideline when considering potential disulfide bonds with DbD2. The energy parameter provides a relative value that can be compared between candidate disulfides to identify potential bonds that best conform to native disulfide geometry.

Figure \(\PageIndex{22}\): Distribution of the disulfide bond energy calculated for 1505 native disulfide bonds in our survey set using the DbD2 energy function. The mean value is 1.0 kcal/mol, and the 90th percentile is 2.2 kcal/mol.
You calculated the approximate value for χ3 dihedral for the C28-C181 native disulfide bond form in Carbonic anhydrase from Neisseria gonorrhea using iCn3D in Question x above. Determine the approximate energy from the empirical function graph in Figure x above for that χ3 dihedral. What percent of native disulfide bonds have that particular calculated energy in the 1505 native disulfide surveyed?
- Answer
-
The estimated χ3 dihedral was 90o. The energy for that χ3 angle would be approximately <0.1kcal/mol, which reflects the energies of about 150/1505 or 10% of the disulfides in the database. It is hence in the most stable range of disulfides, based only on the χ3 dihedral angle.
Yet there are other important parameters as well that would affect the energy of the disulfide bond in the protein. Figure \(\PageIndex{23}\) below shows a comparison of native residue B-factors in stabilizing and destabilizing engineered disulfide bonds

Figure \(\PageIndex{23}\): Comparison of native residue B-factors in stabilizing and destabilizing engineered disulfide bonds. The native structures associated with engineered disulfides previously reported as stabilizing (S) or destabilizing (D), based on experimental evidence, were analyzed with DbD2. The mean B-factor for residues involved in stabilizing disulfide bonds was 31.6 compared with 16.5 for those involved in destabilizing bonds, P = 0.066.
Which proteins were more stabilized by engineered disulfide, those with higher or low B factors.
- Answer
-
"However, the ΣB-factor was considerably higher for the stabilizing disulfides as compared to destabilizing bonds, with mean values of 31.6 and 16.5 respectively (Figure 4). The statistical significance calculated with the Mann-Whitney U test (two-tailed) was P = 0.066. Dani et al. had also reported that engineered disulfides that increase stability are associated with protein regions having higher B-factors. We found that ranking by the ΣB-factor alone is a better predictor of stabilization than when using a score derived from a combination of equally weighted energy and B-factors ranks. It is important to note that B-factors vary widely between protein structures due to the refinement procedure, resolution, and crystal contacts [23-25]. Therefore, when considering potential stabilizing disulfides it is preferable to compare residue B-factors relative to the target protein structure. The colorimetric B-factor scale available in the secondary structure tab of DbD2 is intended to facilitate this analysis."
Another Paper:
Prediction of disulfide bond engineering sites using a machine learning method
https://www.nature.com/articles/s41598-020-67230-z
Gao, X., Dong, X., Li, X. et al. Prediction of disulfide bond engineering sites using a machine learning method. Sci Rep 10, 10330 (2020). https://doi.org/10.1038/s41598-020-67230-z. Creative Commons Attribution 4.0 International License. http://creativecommons.org/licenses/by/4.0/
The amount of data present in a single PDB file is very large, but it is nothing compared to the collective data in all PDB files. If only we could extract empirical rules from the collective PDB files that govern disulfide bond formation. It turns out we can with machine learning and artificial intelligence that can be used to develop and train predictive algorithms. Machine learning has been used to predict amino acid pairs for cysteine mutations to form engineered disulfide bonds. It recognizes 99% of natural disulfide bonds. residues. It uses these parameters:
- distances between the alpha-carbons and the beta-carbons of the bonded cysteine residues
- three torsion angles around the disulfide bonds (χ1,χss,χ1’).
An example of one variable that helps define the stability of disulfide bonds is the distances between the Cα atoms for the disulfide-bonded cysteines, as shown in Figure \(\PageIndex{24}\) below.

Figure \(\PageIndex{24}\): The histogram of distances between Cα atoms of disulfide-bonded cysteines.
The distances range from 3.0 Å and 7.5 Å. Knowing this would constrain the number of choices for paired amino acid side chains for mutagenesis to produce disulfide.
Machine learning can also be used to find other distance constraints to optimize mutagensis experiments. Figure \(\PageIndex{25}\) below shows a graph of 10 different distances and their relative importance in determining disulfide bond stability.

Figure \(\PageIndex{25}\): The relevance of the distance features to the classification outcome. Out of the 45 unique distances, 20 distances have negligible influence on the classification performance. The distances between Cβ and main-chain atoms of the pairing residue are important features in disulfide bond classifications.
An interactive iCn3D model of carbonic anhydrase from Neisseria gonorrhea (1KOQ) highlighting two pairs of amino acids identified by machine learning as candidates for mutations to disulfide-bonded cysteines is shown in Figure \(\PageIndex{26}\) below.
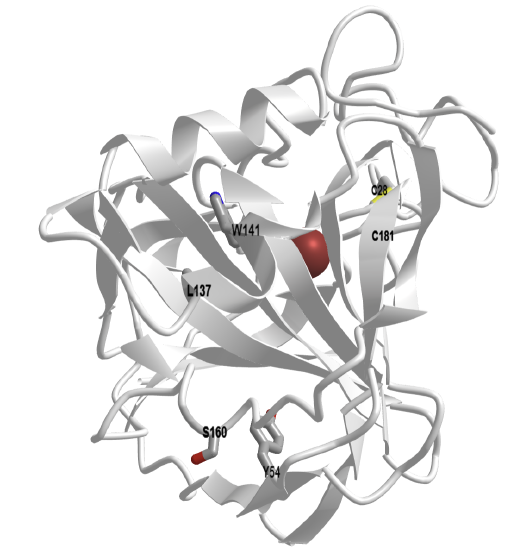
Figure \(\PageIndex{26}\): Carbonic anhydrase from Neisseria gonorrhea (1KOQ) highlighting two pairs of amino acids identified by machine learning as candidates for mutations to disulfide-bonded cysteines (Copyright; author via source). Click the image for a popup or use this external link: https://structure.ncbi.nlm.nih.gov/i...ZH6Tv1urwkKhz8
This question addresses the Biomolecular Visualization Framework theme(s) Atomic Geometry (AG), Macromolecular Building Blocks (MB)
Using the data in Figure \(\PageIndex{25}\) and measurements made using the iCn3D model above (Figure \(\PageIndex{25}\)) , determine which pair would be most likely engineered into a disulfide bond. Complete the table below with the distances you made using iCn3D.
iCn3D instructions: Open the external link and follow these instructions
Trackpad and Mouse Controls
•rotate: click and drag (mouse: left click and drag)
•zoom: pinch and spread (mouse: rotate the scroll wheel)
•translate: two-finger click and drag (mouse: right click and drag)
•Re-center: left click View from the top menu bar, then select “Center Selection”
•Note: ctrl-click on a PC = command-click on Mac; alt-click on PC = option click on Mac
Instructions
- Zoom to clearly see the amino acid pair for distance measures
- From the top menu bar, choose Analysis, Distance, distance between 2 atoms
- Pick the appropriate 2 atoms for measure distance by holding down the Alt key and selecting both
- Record the distances in the table below.
| Mutation Pair | CB1-CA2 (Å) | CB1-CB2 (Å) | CA1-CB2 (Å) |
| 1 (L137) - 2 (W141) | |||
| 1 (Y54) - 1 (S160) |
- Answer
-
Mutation Pair CB1-CA2 (Å) CB1-CB2 (Å) CA1-CB2 (Å) 1 (L137) - 2 (W141) 6 5.2 5.3 1 (Y54) - 1 (S160) 4.1 4.1 5.0
Additional References
- Himadri Bose and Tulasi Satyanarayana. Microbial Carbonic Anhydrases in Biomimetic Carbon Sequestration for Mitigating Global Warming: Prospects and Perspectives. Front Microbiol. 2017; 8: 1615. doi: 10.3389/fmicb.2017.01615
- Ayanne de Oliveira Maciel, Paul Christakopoulos, Ulrika Rova, Io Antonopoulou. Carbonic anhydrase to boost CO2 sequestration: Improving carbon capture utilization and storage (CCUS), Chemosphere, 299, 2022, https://doi.org/10.1016/j.chemosphere.2022.134419
- Craig Bettenhausen. The life-or-death race to improve carbon capture. Craig Bettenhausen. CEN. July 18, 2021
- Tanvi Sharma, Swati Sharma, Hesam Kamyab, Ashok Kumar Energizing the CO2 utilization by chemo-enzymatic approaches and potentiality of carbonic anhydrases: A review. Journal of Cleaner Production. Volume 247, 20 February 2020, 119138. https://doi.org/10.1016/j.jclepro.2019.119138
- Mustaffa, N.I.H.; Latif, M.T.; Wurl, O. The Role of Extracellular Carbonic Anhydrase in Biogeochemical Cycling: Recent Advances and Climate Change Responses. Int. J. Mol. Sci. 2021, 22, 7413. https://doi.org/10.3390/ijms22147413.
- Jo, B., Park, T., Park, H. et al. Engineering de novo disulfide bond in bacterial α-type carbonic anhydrase for thermostable carbon sequestration. Sci Rep 6, 29322 (2016). https://doi.org/10.1038/srep29322