
Photosynthesis
- Page ID
- 2855
\( \newcommand{\vecs}[1]{\overset { \scriptstyle \rightharpoonup} {\mathbf{#1}} } \)
\( \newcommand{\vecd}[1]{\overset{-\!-\!\rightharpoonup}{\vphantom{a}\smash {#1}}} \)
\( \newcommand{\dsum}{\displaystyle\sum\limits} \)
\( \newcommand{\dint}{\displaystyle\int\limits} \)
\( \newcommand{\dlim}{\displaystyle\lim\limits} \)
\( \newcommand{\id}{\mathrm{id}}\) \( \newcommand{\Span}{\mathrm{span}}\)
( \newcommand{\kernel}{\mathrm{null}\,}\) \( \newcommand{\range}{\mathrm{range}\,}\)
\( \newcommand{\RealPart}{\mathrm{Re}}\) \( \newcommand{\ImaginaryPart}{\mathrm{Im}}\)
\( \newcommand{\Argument}{\mathrm{Arg}}\) \( \newcommand{\norm}[1]{\| #1 \|}\)
\( \newcommand{\inner}[2]{\langle #1, #2 \rangle}\)
\( \newcommand{\Span}{\mathrm{span}}\)
\( \newcommand{\id}{\mathrm{id}}\)
\( \newcommand{\Span}{\mathrm{span}}\)
\( \newcommand{\kernel}{\mathrm{null}\,}\)
\( \newcommand{\range}{\mathrm{range}\,}\)
\( \newcommand{\RealPart}{\mathrm{Re}}\)
\( \newcommand{\ImaginaryPart}{\mathrm{Im}}\)
\( \newcommand{\Argument}{\mathrm{Arg}}\)
\( \newcommand{\norm}[1]{\| #1 \|}\)
\( \newcommand{\inner}[2]{\langle #1, #2 \rangle}\)
\( \newcommand{\Span}{\mathrm{span}}\) \( \newcommand{\AA}{\unicode[.8,0]{x212B}}\)
\( \newcommand{\vectorA}[1]{\vec{#1}} % arrow\)
\( \newcommand{\vectorAt}[1]{\vec{\text{#1}}} % arrow\)
\( \newcommand{\vectorB}[1]{\overset { \scriptstyle \rightharpoonup} {\mathbf{#1}} } \)
\( \newcommand{\vectorC}[1]{\textbf{#1}} \)
\( \newcommand{\vectorD}[1]{\overrightarrow{#1}} \)
\( \newcommand{\vectorDt}[1]{\overrightarrow{\text{#1}}} \)
\( \newcommand{\vectE}[1]{\overset{-\!-\!\rightharpoonup}{\vphantom{a}\smash{\mathbf {#1}}}} \)
\( \newcommand{\vecs}[1]{\overset { \scriptstyle \rightharpoonup} {\mathbf{#1}} } \)
\(\newcommand{\longvect}{\overrightarrow}\)
\( \newcommand{\vecd}[1]{\overset{-\!-\!\rightharpoonup}{\vphantom{a}\smash {#1}}} \)
\(\newcommand{\avec}{\mathbf a}\) \(\newcommand{\bvec}{\mathbf b}\) \(\newcommand{\cvec}{\mathbf c}\) \(\newcommand{\dvec}{\mathbf d}\) \(\newcommand{\dtil}{\widetilde{\mathbf d}}\) \(\newcommand{\evec}{\mathbf e}\) \(\newcommand{\fvec}{\mathbf f}\) \(\newcommand{\nvec}{\mathbf n}\) \(\newcommand{\pvec}{\mathbf p}\) \(\newcommand{\qvec}{\mathbf q}\) \(\newcommand{\svec}{\mathbf s}\) \(\newcommand{\tvec}{\mathbf t}\) \(\newcommand{\uvec}{\mathbf u}\) \(\newcommand{\vvec}{\mathbf v}\) \(\newcommand{\wvec}{\mathbf w}\) \(\newcommand{\xvec}{\mathbf x}\) \(\newcommand{\yvec}{\mathbf y}\) \(\newcommand{\zvec}{\mathbf z}\) \(\newcommand{\rvec}{\mathbf r}\) \(\newcommand{\mvec}{\mathbf m}\) \(\newcommand{\zerovec}{\mathbf 0}\) \(\newcommand{\onevec}{\mathbf 1}\) \(\newcommand{\real}{\mathbb R}\) \(\newcommand{\twovec}[2]{\left[\begin{array}{r}#1 \\ #2 \end{array}\right]}\) \(\newcommand{\ctwovec}[2]{\left[\begin{array}{c}#1 \\ #2 \end{array}\right]}\) \(\newcommand{\threevec}[3]{\left[\begin{array}{r}#1 \\ #2 \\ #3 \end{array}\right]}\) \(\newcommand{\cthreevec}[3]{\left[\begin{array}{c}#1 \\ #2 \\ #3 \end{array}\right]}\) \(\newcommand{\fourvec}[4]{\left[\begin{array}{r}#1 \\ #2 \\ #3 \\ #4 \end{array}\right]}\) \(\newcommand{\cfourvec}[4]{\left[\begin{array}{c}#1 \\ #2 \\ #3 \\ #4 \end{array}\right]}\) \(\newcommand{\fivevec}[5]{\left[\begin{array}{r}#1 \\ #2 \\ #3 \\ #4 \\ #5 \\ \end{array}\right]}\) \(\newcommand{\cfivevec}[5]{\left[\begin{array}{c}#1 \\ #2 \\ #3 \\ #4 \\ #5 \\ \end{array}\right]}\) \(\newcommand{\mattwo}[4]{\left[\begin{array}{rr}#1 \amp #2 \\ #3 \amp #4 \\ \end{array}\right]}\) \(\newcommand{\laspan}[1]{\text{Span}\{#1\}}\) \(\newcommand{\bcal}{\cal B}\) \(\newcommand{\ccal}{\cal C}\) \(\newcommand{\scal}{\cal S}\) \(\newcommand{\wcal}{\cal W}\) \(\newcommand{\ecal}{\cal E}\) \(\newcommand{\coords}[2]{\left\{#1\right\}_{#2}}\) \(\newcommand{\gray}[1]{\color{gray}{#1}}\) \(\newcommand{\lgray}[1]{\color{lightgray}{#1}}\) \(\newcommand{\rank}{\operatorname{rank}}\) \(\newcommand{\row}{\text{Row}}\) \(\newcommand{\col}{\text{Col}}\) \(\renewcommand{\row}{\text{Row}}\) \(\newcommand{\nul}{\text{Nul}}\) \(\newcommand{\var}{\text{Var}}\) \(\newcommand{\corr}{\text{corr}}\) \(\newcommand{\len}[1]{\left|#1\right|}\) \(\newcommand{\bbar}{\overline{\bvec}}\) \(\newcommand{\bhat}{\widehat{\bvec}}\) \(\newcommand{\bperp}{\bvec^\perp}\) \(\newcommand{\xhat}{\widehat{\xvec}}\) \(\newcommand{\vhat}{\widehat{\vvec}}\) \(\newcommand{\uhat}{\widehat{\uvec}}\) \(\newcommand{\what}{\widehat{\wvec}}\) \(\newcommand{\Sighat}{\widehat{\Sigma}}\) \(\newcommand{\lt}{<}\) \(\newcommand{\gt}{>}\) \(\newcommand{\amp}{&}\) \(\definecolor{fillinmathshade}{gray}{0.9}\)Introduction
Before beginning this exercise, it is necessary to understand that photosynthesis uses light energy to synthesize carbohydrate from carbon dioxide. The equation is below.
\[\mathrm{6CO_2 + 6H_2O + Energy \rightarrow C_6H_{12}O_6 + 6O_2}\]
This process requires light for some of the reactions.
It is also necessary to understand that the plant is constantly undergoing cellular respiration according to the equation below.
\[\mathrm{C_6H_{12}O_6 + 6O_2 \rightarrow 6CO_2 + 6H_2O + Energy}\]
Notice that these two equations appear to be opposites.
When plants are exposed to light, photosynthesis and cellular respiration both occur. In the dark, only cellular respiration occurs.
We will study photosynthesis in an aquatic plant (Elodea) We can measure the rate of photosynthesis and cellular respiration by measuring the amount of CO2 given off or taken up by the plant.
Carbon dioxide combines with water to form carbonic acid (H2CO3) which dissociates into hydrogen ions (H+) and bicarbonate ions (HCO3-). The pH drops due to the presence of hydrogen ions.
\[\mathrm{CO_2 + H_2O \leftrightarrow H_2CO_3 \leftrightarrow H^+ + \sideset{ }{_{3}^{-}}{HCO}}\]
Respiring plants release CO2 into the water, causing the pH to decline. During photosynthesis, plants take up CO2 and the pH increases.
Using the pH Probe
Set up the pH probe by following the instructions given in the link below.
Instructions for setting up and using the pH probe.
Procedure for Measuring Photosynthesis
Create a hypothesis for this experiment.
Be sure to use tap water for the experiments below. Distilled water should not be used.
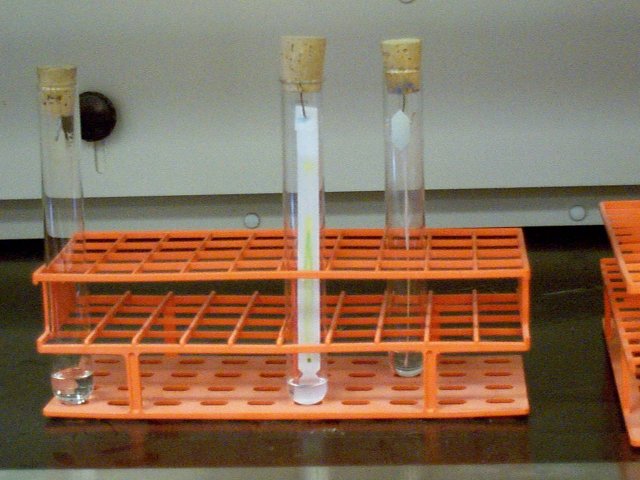
After the probe is set up (see the step above), obtain two large test tubes for this experiment. A ring stand can be used to hold the tubes as shown in the photograph below.
Rinse both tubes and stoppers thoroughly with tap water to remove any traces of contaminants that might affect pH.
Fill each tube with tap water to approximately 2 cm from the top.
Cut a sprig of Elodea that is long enough to fill the entire length of one tube but not protrude from the water. The length of the stem can be adjusted, if necessary, by cutting a piece from the base of the stem. Put the plant in one of the tubes. The other tube will serve as a control.
Clamp the two tubes on a ring stand to hold them.

Insert one pH probe into each test tube.
When the pH stabilizes, record the pH in each tube and then turn on the lamp and begin timing the experiment. The pH probes can be kept in the tubes until the experiment is finished.
Record the pH of the water in each tube every 10 minutes for one hour. Your data table will have 7 pH readings for each tube.
You should begin the chromatography procedure (below) while waiting to take pH readings.
Chromatography
Create a hypothesis for this experiment.
During photosynthesis, light energy is absorbed by photosynthetic pigments. Chlorophyll A is the main photosynthetic pigment but chlorophyll B, carotenes, and xanthophylls also absorb light. Each pigment absorbs a specific range of colors but all of them together enable the plant to use a larger amount of light. These pigments absorb red and blue light best and absorb green the least. Plants look green; because the green light is not absorbed by the plant; it is reflected.
Chromatography is a technique used to separate the components of a mixture. In this investigation, you will use chromatography to separate and identify several photosynthetic pigments in a solution prepared from spinach leaves.
Paper chromatography can be used to separate the components of a mixture based on their polarity. Some of the mixture is placed on one end of a piece of paper and that end of the paper is immersed in a nonpolar liquid (see the diagram below).
 |
Click on the photograph to view an enlargement. |
As the liquid moves up the paper, the molecules of the sample mixture will also move. Polar molecules within the sample will spend most of their time bound to the polar surface of the paper and will therefore not move very much. Nonpolar molecules, however, will spend most of their time dissolved in the liquid as it moves up the paper. When the liquid reaches the top of the paper, these molecules will also have traveled most of the way to the top. The two types of molecules (polar and nonpolar) are now separated.
Rf
It is useful to determine the relative distance moved by a particular kind of molecule using chromatography. This value is known as Rf. For example, if the molecules move half as far as the solvent traveled, the Rf = 0.5. If the molecules moved 1/4 the distance, the Rf = 0.25. The maximum value for Rf is therefore 1.0.
Procedure
Using a pencil, put a small dot in the center of a strip of chromatography paper 2 cm. from one end.
Put a hole in the other end of the paper so that it can be suspended on a wire clip inserted in a cork stopper as shown in the photograph above. The paper should be able to reach to within 1 cm of the bottom of the tube but not touch the bottom.
When the apparatus is adjusted properly, remove the paper so that you can add pigment extract.
Caution - The remainder of this procedure should be conducted under the hood because the vapors from the chemicals used are toxic and carcinogenic (cause cancer).
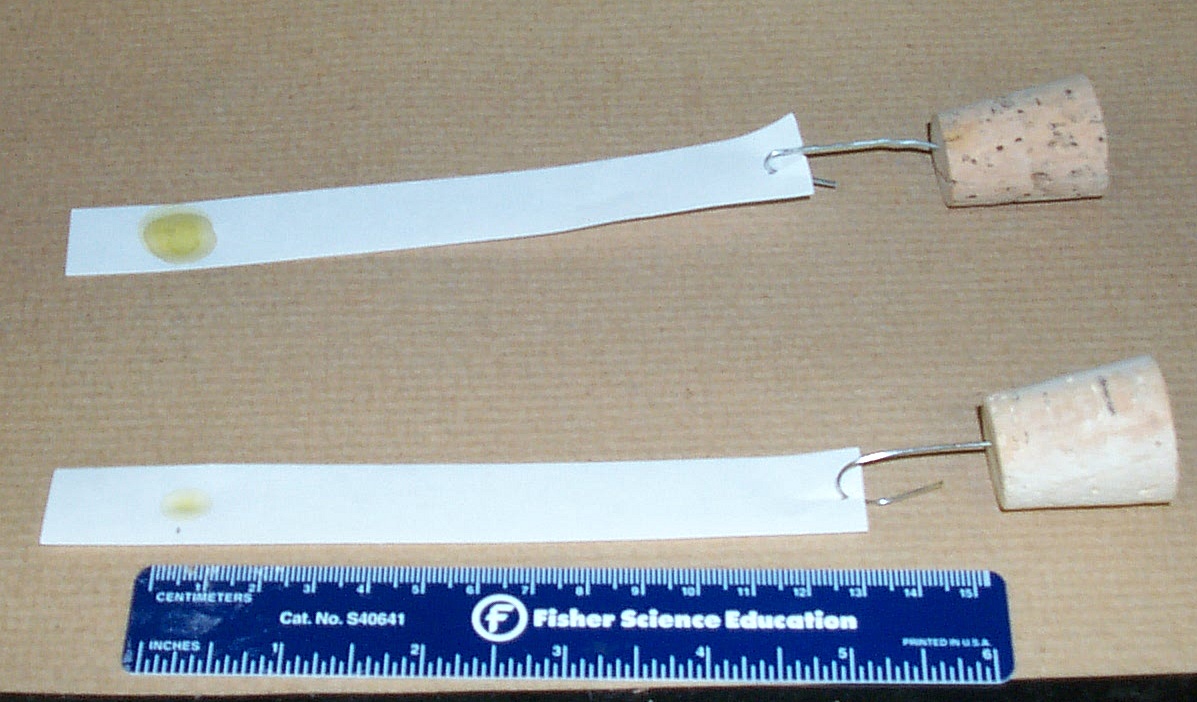
Use a micropipette to place a 5 ul of pigment extract on the dot that you marked on the paper. The extract should be placed directly on top of the dot. It will spread, producing a small circular spot. Allow the spot to dry for 1 minute and repeat this procedure 4 more times for a total of 5 applications of pigment extract. Allow the spot to dry between each application.
|
|
The paper in the top photograph has had one application of extract. After 5 applications, your paper should look like the one in the bottom photograph. Click on the photographs to view enlargements. |
While waiting for the paper to dry after the fifth application, add chromatography solvent to the bottom of the chromatography tube. Add enough solvent so that the end of the chromatography paper will be immersed in the solvent but the spot with pigment extract will remain above the solvent. It is important not to immerse the pigment spot. This tube should be kept under the hood at all times.
When the spot has dried, suspend the paper vertically in a chromatography tube. If possible, keep the paper from touching the sides of the tube.
Check the movement of the solvent after 20 minutes. The paper should be removed before the solvent reaches the top of the paper.
Before the solvent dries, draw a line on the paper that shows how far the solvent moved. One end of the paper should have a dot that indicates where the pigments were applied and the other end should have a line that indicates how far the solvent traveled.
Allow the paper to dry under the hood. After the paper is dried, you may bring it out from under the hood.
Do not discard the chromatography solution down the drain, discard it in the beaker provided under the hood.
The photosynthetic pigments will be separated in the following order beginning with the highest Rf: beta-carotenes, xanthophylls, chlorophyll a, chlorophyll b. Beta-carotenes are orange or orange-yellow, xanthophylls are yellow, chlorophyll A is blue-green, and chlorophyll B is olive-green.
The proportion of the total distance moved by the spot is often calculated in chromatography procedures. To calculate this value, you must first measure the distance moved by the solvent. This can be done by measuring the distance from the spot to the top of the paper. Next, measure the distance moved by each of the pigments.
Rf = distance moved by the pigment/distance moved by the solvent
For each of the pigments (beta-carotenes, xanthophylls, chlorophyll a, chlorophyll b) record the distance moved and the Rf.
One member of your group should paste the chromatogram in their notebook. The names of the members of your group should be listed next to the chromatogram.
Results
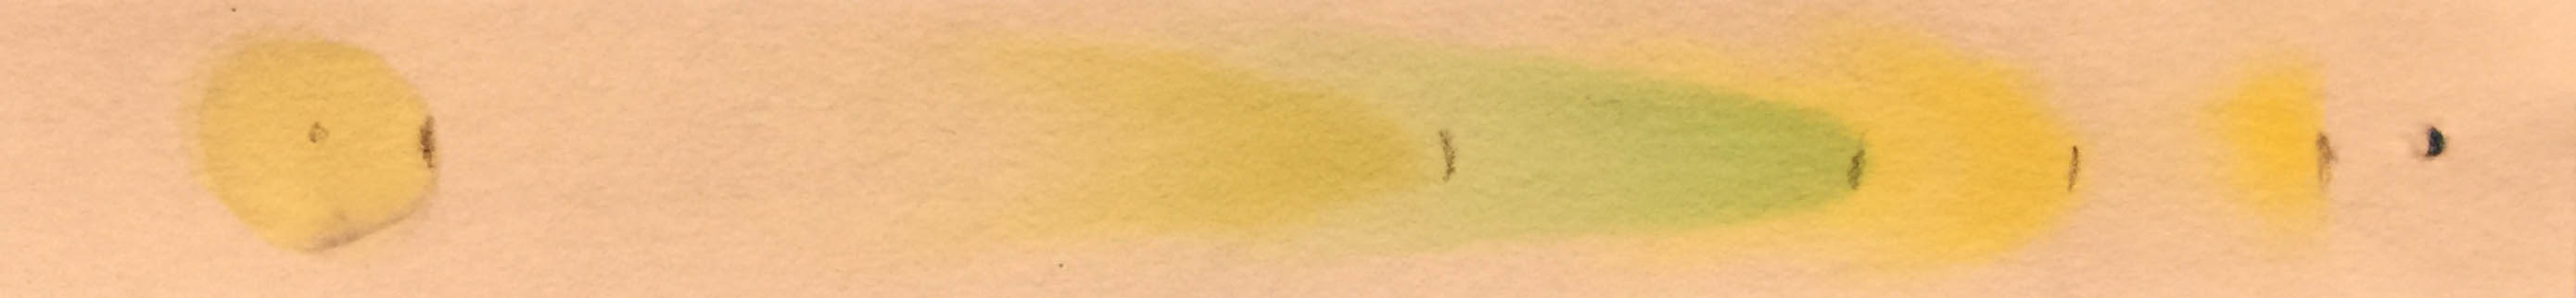 |
Click to enlarge |
Questions
Create a graph of your results from the photosynthesis experiment. Put time on the X-axis and pH on the Y-axis. If you have a notebook with quad-ruled pages, you can draw the graph directly in your notebook. If not, use graph paper or use a computer graphing program such as Excel or LibreOffice.
Adjust the graph so that the minimum value of the Y-axis is a number that is slightly less than the minimum value observed in the table above. The maximum value should be equal to or slightly greater than the maximum value of the data. For example, suppose that the minimum pH that you measured was 5.9 and the maximum was 7.3. You could make the minimum on the graph 5.5 and the maximum 7.5.
Be sure that you clearly identify the two lines on the graph. For example, you could use circles for points on one line and squares for points on the other line.
- What will happen to the pH of water when CO2 is dissolved in the water?
- Write the equation that describes what happens when CO2 is dissolved in water.
- What will happen to the pH of water when CO2 is removed from the water?
- Two kinds of metabolic reactions caused the pH to change in the tube with the plant. One of these processes caused the pH to increase, the other caused it to decrease. Name these processes and tell which causes the pH to increase and which causes the pH to decline.
- The two processes listed above had opposite effects on the pH. Why did the pH increase in the light tube if both of these process were occurring at the same time?
- Explain why the values produced from the tube with the plant do not reflect the total photosynthesis (total CO2 consumption) of the plant. [Hint - Think about your answer to questions 4 and 5.]
- Explain why the pH of the tube with the plant might stop increasing toward the end of the 60 minute time period. The diagram above may be helpful for answering this question.