Reading- Statistical Analysis
( \newcommand{\kernel}{\mathrm{null}\,}\)
Statistical Analysis- The t-test
Suppose that a researcher wishes to test if a certain kind of growth hormone will produce faster growth in mice. She injects 10 mice with the hormone and uses another 10 as a control. Three weeks later, she weighs the mice and discovers that the mean weight of mice that have received the injections is 12.05 g and the mean weight of control mice is 9.3 g. These values indicate that the mice receiving the hormone are heavier. Is her value of 12.05 significantly different than 9.3? Is it possible that the hormone has no effect, that the weight difference between the two groups is due to chance? This is like flipping a coin 10 times. You expect 5 heads and 5 tails but you might get 6 heads or 7 heads or perhaps 8 heads. Similarly, if the hormone does not work, you expect the mean for the two groups to be similar but it may not be exactly the same.
| Group 1 - Hormone - Weight (grams) |
Group 2 – No Hormone - Weight (grams) |
|---|---|
| 12.5 | 12 |
| 13 | 8.5 |
| 12 | 10 |
| 12 | 8 |
| 13 | 8 |
| 14 | 13.5 |
| 13 | 9 |
| 10.5 | 8.5 |
| 9.5 | 6.5 |
| 11 | 9 |
| Mean = 12.05 | Mean = 9.3 |
What is the chance that the two means would be as different as 12.05g and 9.3g if the hormone really did not work? Statistical tests test whether differences in the data are real differences or whether they are due to chance. In the example above, we test if the mean of group 1 is significantly different than the mean of group 2. The alternative is that the difference is due to chance or random fluctuations and the hormone did not cause additional weight gain. The test gives the probability that difference could be due to chance. If the probability that the difference is due to chance is less than 1 out of 20 (<0.05), then we conclude that the difference is real. If the probability is greater than 0.05, we conclude that the difference is not significant, it could be due to chance.
There are several tests available for testing means. A commonly used test for data that are normally distributed is the t-test.
Sara's Hypothesis is that newborn mice injected with the hormone will be heavier after 3 weeks of growth than mice without the hormone.
The calculations for the test can be performed by hand, but computer software can do them very quickly. To perform the test, the weight data for the two groups of mice above are entered into a t-test program.
The software reveals that p = 0.0012. The probability that the difference between the two means (12.05 and 9.3) is due to chance (random effects) is 0.0012 (or 12 out of 10,000). Because p < 0.05, we conclude that the two means are really different and that the difference is not due to chance. The researcher accepts her hypothesis that the hormone produces faster growth. If p had been greater than 0.05, we would reject her hypothesis and conclude that the two means are not significantly different; the hormone did not cause one group to be heavier.
The word "significant" has a slightly different meaning in statistics than it does in general usage. In a statistical test of two means, if the difference is not due to chance, we conclude that the two means are significantly different. In the example above, the mean weight of group 1 is significantly heavier than the mean weight of group 2.
Number of Tails
The number of tails in a test refers to the number of ways that the two groups can differ. The following hypothesis would lead us to perform a two-tailed test:
The mean weight of mice injected with the hormone will be different than the mean weight of the control mice.
This is two-tailed because the hypothesis proposes two possible outcomes. The hypothesis is true if the weight hormone mice is greater than the weight of control mice. The hypothesis is also true if the weight of hormone mice is less than the weight of control mice.
The following hypothesis would lead us to perform a one-tailed test:
The mean weight of mice injected with the hormone will be greater than the mean weight of the control mice.
The following hypothesis would lead us to perform a one-tailed test.
The mean weight of mice injected with the hormone will be less than the mean weight of the control mice.
This is a one-tailed test because the hypothesis proposes that there is only one possible outcome: the weight of the hormone mice will be less than the weight of the control mice.
A researcher wishes to learn if a certain drug slows the growth of tumors. She obtained mice with tumors and randomly divided them into two groups. She then injected one group of mice with the drug and used the second group as a control. After 2 weeks, she sacrificed the mice and weighed the tumors. The weight of tumors for each group of mice is below.
The researcher is interested in learning if the drug reduces the growth of tumors. Her hypothesis is: The mean weight of tumors from mice in group A will be less than the mean weight of mice in group 2.
| Group A Treated with Drug |
Group B Control- Not Treated |
|
|---|---|---|
| 0.72 | 0.71 | |
| 0.68 | 0.83 | |
| 0.69 | 0.89 | |
| 0.66 | 0.57 | |
| 0.57 | 0.68 | |
| 0.66 | 0.74 | |
| 0.70 | 0.75 | |
| 0.63 | 0.67 | |
| 0.71 | 0.80 | |
| 0.73 | 0.78 | |
| Mean = | ` 0.675 | 0.742 |
A t-test can be used to test the probability that the two means do not differ. The alternative is that tumors from the group treated with the drug will not weigh less than tumors from the control group. This is a one-tailed test because the researcher is interested in if the drug decreased tumor size. She is not interested in if the drug changed tumor size.
The calculations involved in doing a t-test will not be discussed in this course but this is often covered in introductory statistics courses. A spreadsheet has been prepared to perform these calculations. The values from the table above are entered into the spreadsheet as shown below.

The t-test shows that tumors from the drug group were significantly smaller than the tumors from the control group because p < 0.05. The researcher therefore accepts her hypothesis that the drug reduces the growth of tumors.
A researcher wishes to learn whether the pH of soil affects seed germination of a particular herb found in forests near her home. She filled 10 flower pots with acid soil (pH 5.5) and ten flower pots with neutral soil (pH 7.0) and planted 100 seeds in each pot. The mean number of seeds that germinated in each type of soil is below.
| Acid Soil pH 5.5 |
Neutral Soil pH 7.0 |
|
|---|---|---|
| 42 | 43 | |
| 45 | 51 | |
| 40 | 56 | |
| 37 | 40 | |
| 41 | 32 | |
| 41 | 54 | |
| 48 | 51 | |
| 50 | 55 | |
| 45 | 50 | |
| 46 | 48 | |
| Mean = | 43.5 | 48 |
The researcher is testing whether soil pH affects germination of the herb. Her hypothesis is: The mean germination at pH 5.5 is different than the mean germination at pH 7.0.
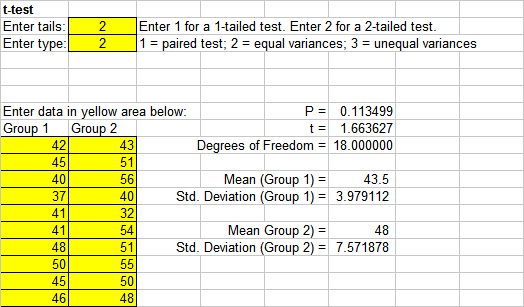
A t-test can be used to test the probability that the two means do not differ. The alternative is that the means differ; one of them is greater than the other. This is a two-tailed test because the researcher is interested in if soil acidity changes germination percentage. She does not specify if it increases or decreases germination. Notice that a 2 is entered for the number of tails below.

The t-test shows that the mean germination of the two groups does not differ significantly because p > 0.05. The researcher concludes that pH does not affect germination of the herb.
Suppose that a researcher wished to learn if a particular chemical is toxic to a certain species of beetle. She believes that the chemical might interfere with the beetle’s reproduction. She obtained beetles and divided them into two groups. She then fed one group of beetles with the chemical and used the second group as a control. After 2 weeks, she counted the number of eggs produced by each beetle in each group. The mean egg count for each group of beetles is below.
| Group 1 fed chemical |
Group 2 not fed chemical (control) |
|
|---|---|---|
| 33 | 35 | |
| 31 | 42 | |
| 34 | 43 | |
| 38 | 41 | |
| 32 | ||
| 28 | ||
| Mean = | 32.7 | 40.3 |
The researcher believes that the chemical interferes with beetle reproduction. She suspects that the chemical reduces egg production. Her hypothesis is: The mean number of eggs in group 1 is less than the mean number of group 2.
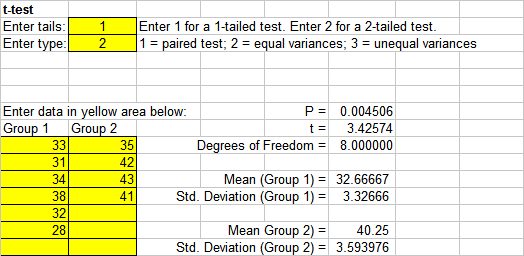
A t-test can be used to test the probability that the two means do not differ. The alternative is that the mean of group 1 is greater than the mean of group 2. This is a 1-tailed test because her hypothesis proposes that group B will have greater reproduction than group 1. If she had proposed that the two groups would have different reproduction but was not sure which group would be greater, then it would be a 2-tailed test. Notice that a 1 is entered for the number of tails below.
The results of her t-test are copied below.

The researcher concludes that the mean of group 1 is significantly less than the mean for group 2 because the value of P < 0.05. She accepts her hypothesis that the chemical reduces egg production because group 1 had significantly less eggs than the control.

