
12.1: Fresh Water Supply
- Page ID
- 69461

Despite the vast volumes of water on Earth, only 2.5% is freshwater (figure \(\PageIndex{1}\)), and only 0.01% is available for humans to use. If all of world’s water was shrunk to the size of 1 gallon, then the total amount of fresh water would be about 1/3 cup, and the amount of readily usable freshwater would be 2-3 tablespoons. Much of Earth's freshwater is trapped in glaciers and polar ice caps (figure \(\PageIndex{1}\)), and this water is inconveniently located, mostly in Antarctica and Greenland. Shallow groundwater (water located below the Earth's surface) is the largest reservoir of usable fresh water. Many organisms are dependent on surface waters, such as lakes and rivers, which comprise a small fraction of freshwater on Earth. A lack of these surface waters can have negative effects on ecosystems.
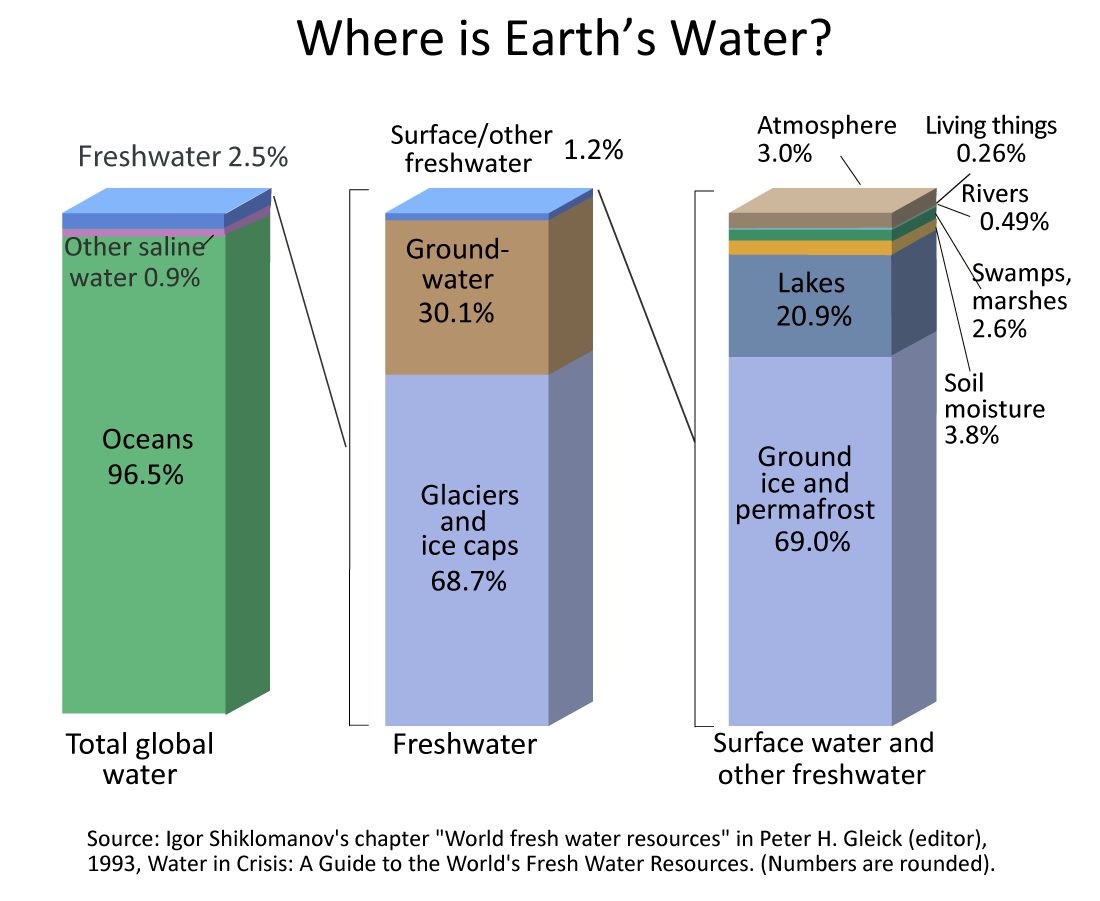
Figure \(\PageIndex{1}\): Bar chart of the distribution of Earth’s water, including total global water, fresh water, and surface water. Oceans are the largest of Earth’s water reservoirs, and only 2.5% of Earth's water is freshwater. Most of this freshwater (68.7%) is in glaciers and ice caps, 30.1% is groundwater, and 1.2% is surface and other freshwater. Of this 1.2%, 3.0% is found in the atmosphere, 0.26% in living things, 0.49% in rivers, 2.6% in swamps and marshes, 3.8% as soil moisture, 20.9% in lakes, and 69.0% as ground ice and permafrost. Image from USGS/Igor Shiklomanov (public domain).
Water Usage
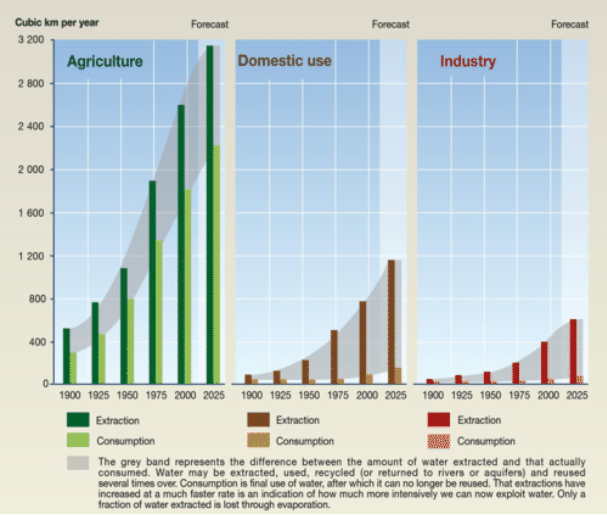
Freshwater supply is one of the most important ecosystem services. In 2014, global water consumption was 3999 km3 per year (over 1,000 trillion gallons!). The greatest use of this water is for irrigation in agriculture, but significant quantities of water are also extracted for public and municipal use, as well as industrial applications and power generation (figure \(\PageIndex{2}\)).
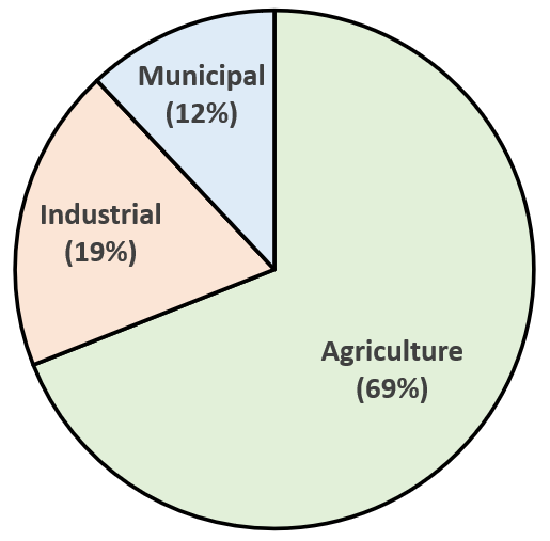
Figure \(\PageIndex{2}\): Global water usage by sector. Municipal refers to domestic use, such as by local businesses and households. Data from FAO. Image by Melissa Ha (CC-BY-NC).
Humans require only about 1 gallon per day to survive, but a typical person in a U.S. household uses approximately 80-100 gallons per day, which includes cooking, washing dishes and clothes, flushing the toilet, and bathing. Additionally, we rely on the food, energy, and mineral resources, which all require water to produce. For example, approximately three gallons are needed to produce a tomato, 150 gallons for a loaf of bread, and 1,600 for a pound of beef. (You can learn more about the water footprint of different foods using this interactive website.) Twenty-one gallons are needed to produce one kilowatt-hour (kWh) of electricity from a traditional power plant (about 1 kWh is needed to heat an oven for 30 minutes), and one ton of steel consumes about 63,000 gallons of water.
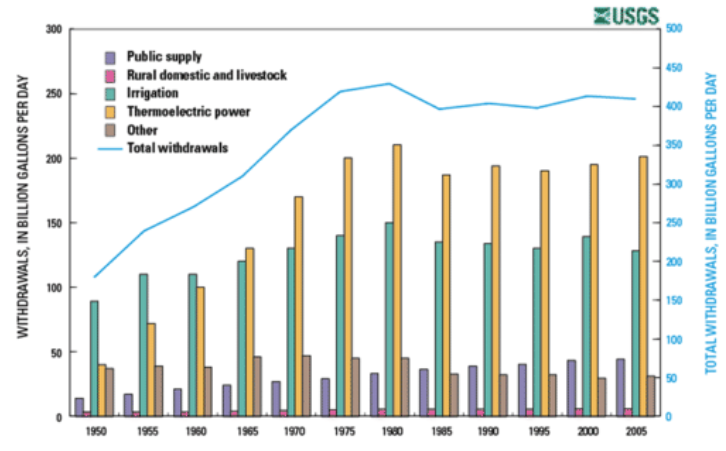
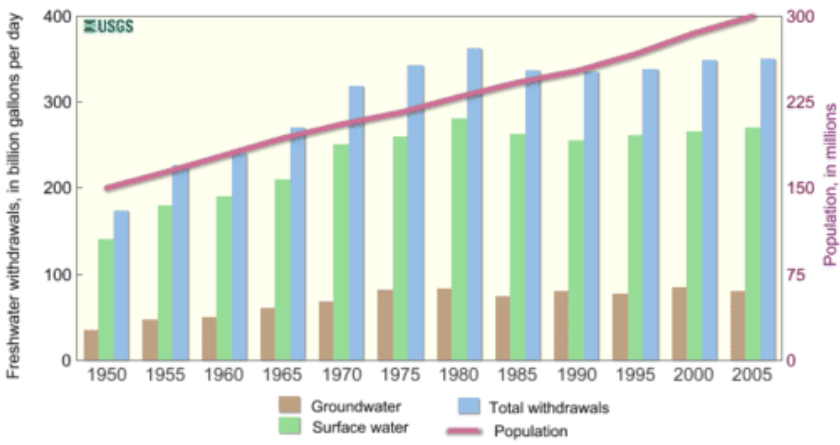
The water demand of an area is a function of the population and other uses of water. There are several general categories of water use, including offstream use, which removes water from its source, e.g., irrigation, thermoelectric power generation (cooling electricity-producing equipment in fossil fuel, nuclear, and geothermal power plants), industry, and public supply; consumptive use, which is a type of offstream use where water does not return to the surface water or groundwater system immediately after use, e.g., irrigation water that evaporates or goes to plant growth; and instream use, which is water used but not removed from a river, mostly for hydroelectric power generation. The relative size of these three categories are instream use >> offstream use > consumptive use. In 2005, the U.S. used approximately 3,300 billion gallons per day for instream use, 410 billion gallons per day for offstream use, and 100 billion gallons per day for consumptive use. The major offstream uses of that water were thermoelectric (49%), irrigation (31%), public supply (11%), and industry (4%, see Figure \(\PageIndex{3}\)). About 15% of the total water withdrawals in the U.S. in 2005 were saline water, which was used almost entirely for thermoelectric power generation. Almost all of the water used for thermoelectric power generation is returned to the river, lake, or ocean from where it came but about half of irrigation water does not return to the original source due to evaporation, plant transpiration, and loss during transport, e.g., leaking pipes. Total withdrawals of water in the U.S. actually decreased slightly from 1980 to 2005, despite a steadily increasing population. This is because the two largest categories of water use (thermoelectric and irrigation) stabilized or decreased over that time period due to better water management and conservation. In contrast, public supply water demand increased steadily from 1950 (when estimates began) through 2005. Approximately 77% of the water for offstream use in the U.S. in 2005 came from surface water and the rest was from groundwater (see Figure \(\PageIndex{4}\)).
Global total water use is steadily increasing at a rate greater than world population growth (Figure \(\PageIndex{5}\)). During the 20th century global population tripled and water demand grew by a factor of six. The increase in global water demand beyond the rate of population growth is due to improved standard of living without an offset by water conservation. Increased production of goods and energy entails a large increase in water demand. The major global water uses are irrigation (68%), public supply (21%), and industry (11%).
In the United States, 281 billion gallons of water were withdrawn per day in 2015, of which 82 billion gallons are fresh groundwater (figure \(\PageIndex{6}\)). The state of California accounts for 9% of national water withdrawal (figure \(\PageIndex{7}\)).
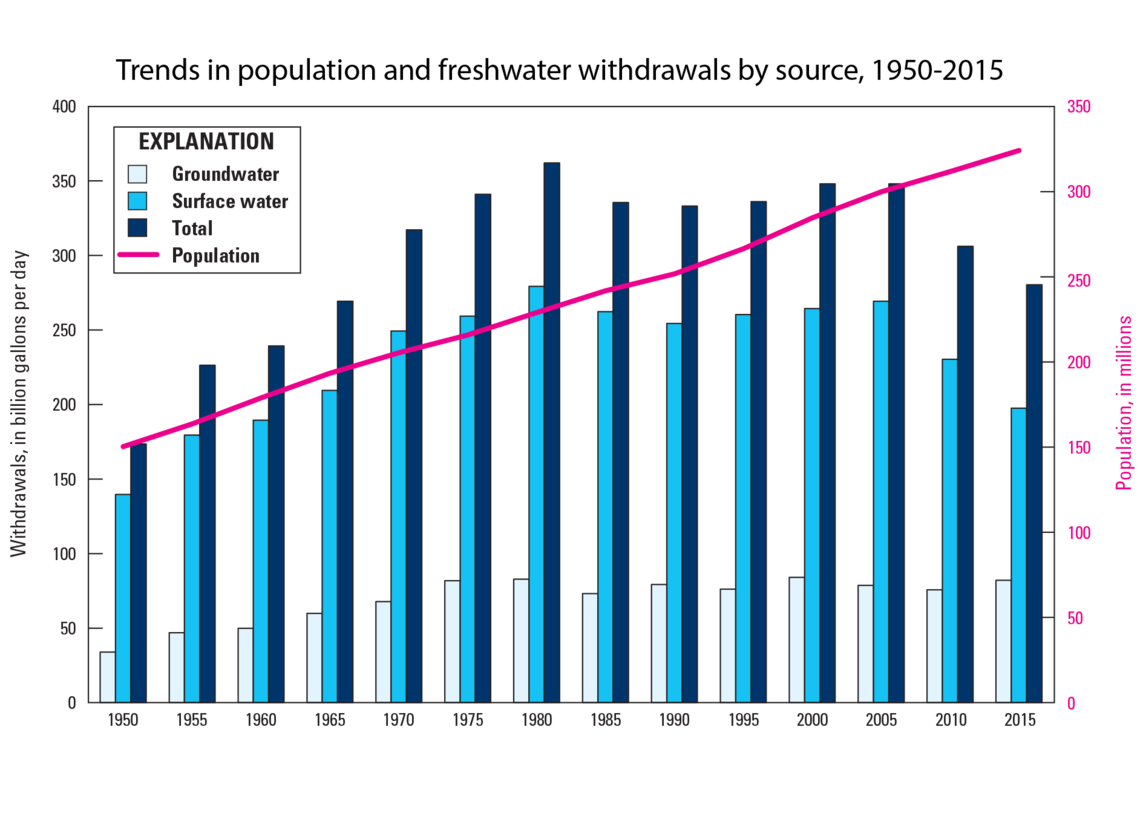
Figure \(\PageIndex{6}\): Average daily freshwater withdrawals (in billion gallons per day, left y-axis) over time (x-axis) in the United States. Light blue bars (left) represent groundwater withdrawals, medium blue (middle) represents withdrawals from surface water, and dark blue bars (right) represent total withdrawals in billions of gallons per day. In 1950, total withdrawals were around 170 billion gallons per day. This gradually increased until 1980 at just over 350 billion gallons per day. In 1985, total withdrawals dropped to around 325 billion gallons and stayed relatively constant until decreasing in 2010. In 2015, total withdrawals were around 260 billion gallons. Most of the changes in withdrawals overtime were due to changes in surface water withdrawals rather than groundwater withdrawals. Surface water withdrawals have generally been 2-3 times greater than groundwater withdrawals. The pink line represents the United States population size in millions (right y-axis), which has increased from roughly 170 million in 1950 to about 325 million in 2015. Image by USGS (public domain).
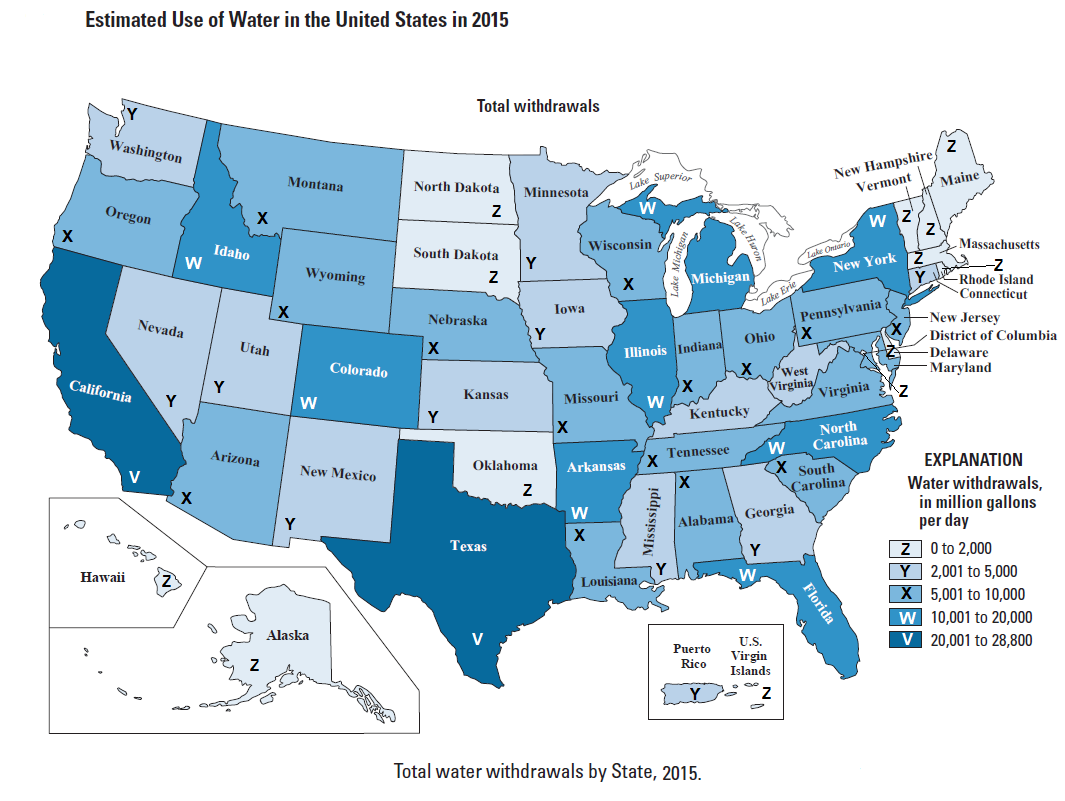
Figure \(\PageIndex{7}\): Total water withdrawals by state in 2015. The lightest blue (Z) indicates 0-2,000 million gallons per day, and the darkest blue (V) indicates 20,001-28,800 million gallons per day. California and Texas consume the most water, and Alaska, Hawaii, the Dakotas, Oklahoma, and some New England states consume the least. Image modified from USGS (public domain).
Primary Freshwater Resources: Precipitation
Precipitation levels are unevenly distributed around the globe, affecting fresh water availability (figure \(\PageIndex{8}\)). In general, due the uneven heating of the Earth and global air circulation cells resulting from the Earth's rotation, air rises near the equator and near 60° north and south latitude and sinks at the poles and 30° north and south latitude. The intense sunlight at the equator heats air, causing it to rise and cool, which decreases the ability of the air mass to hold water vapor and results in frequent rainstorms. Around 30 degrees north and south latitude, descending air conditions produce warmer air, which increases its ability to hold water vapor and results in dry conditions. Both the dry air conditions and the warm temperatures of these latitude belts favor evaporation. The size of continents, mountains, prevailing winds, ocean circulation patterns, and even the proximity of bodies of water can affect local climate patterns. For example, when cold winds blow across the relatively warm Great Salt Lake, the air warms, which causes it to pick up moisture. This local increase in the moisture content of the air may eventually fall as snow or rain on nearby mountains, a phenomenon known as “lake-effect precipitation”.
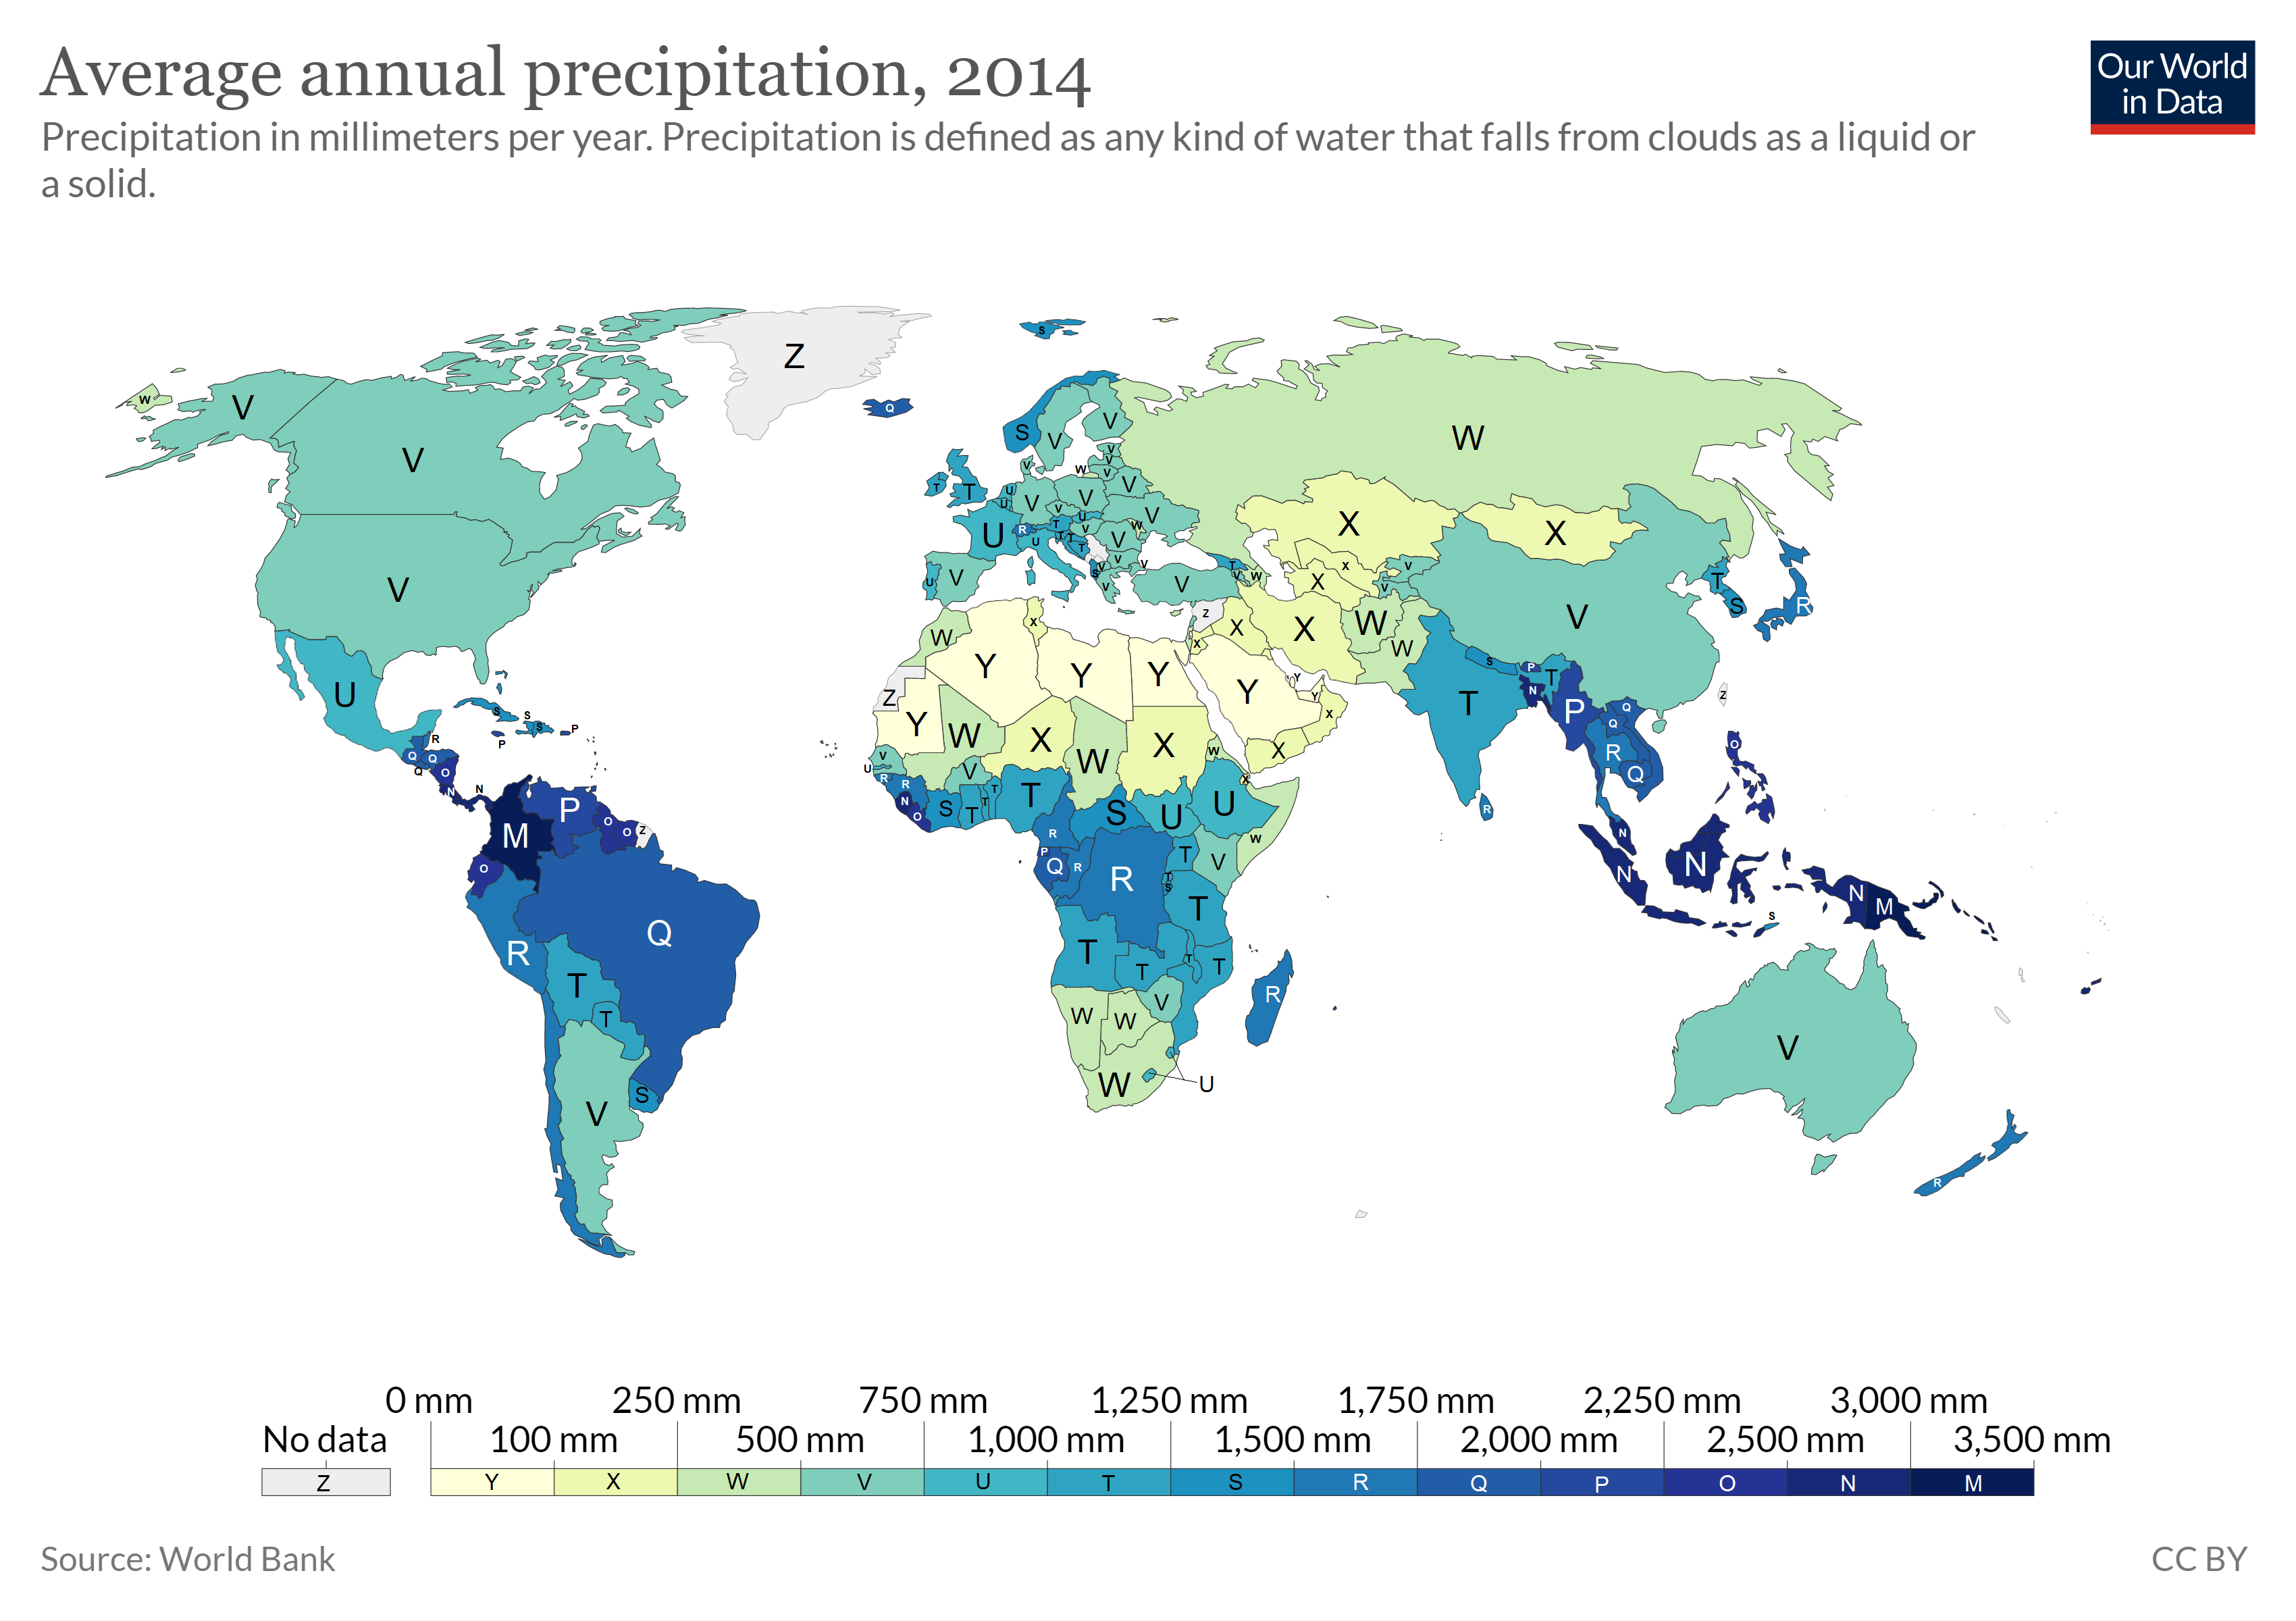
Figure \(\PageIndex{8}\): Annual average precipitation by country in 2014. Countries with the highest rainfall (3000-3500 mm) are Nicaragua, Costa Rica, Panama, Columbia, Sierra Leone (in West Africa), Bangladesh, and many of the islands is Southeast Asia. Countries with the least rainfall (0-100 mm) are Saudi Arabia and several North African countries. The United States has intermediate rainfall (500-750 mm). The world’s rainforests grow in areas with high rainfall while areas with very little rainfall are deserts. Image modified from Our World in Data/World Bank (CC-BY).
In the United States, the 100th Meridian roughly marks the boundary between the humid and arid parts of the country (figure \(\PageIndex{9}\)). Irrigation is required to grow crops west of the 100th Meridian. In the West, surface water is stored in reservoirs (artificial lakes) and mountain snowpacks and strategically released through a system of canals during times of high use.
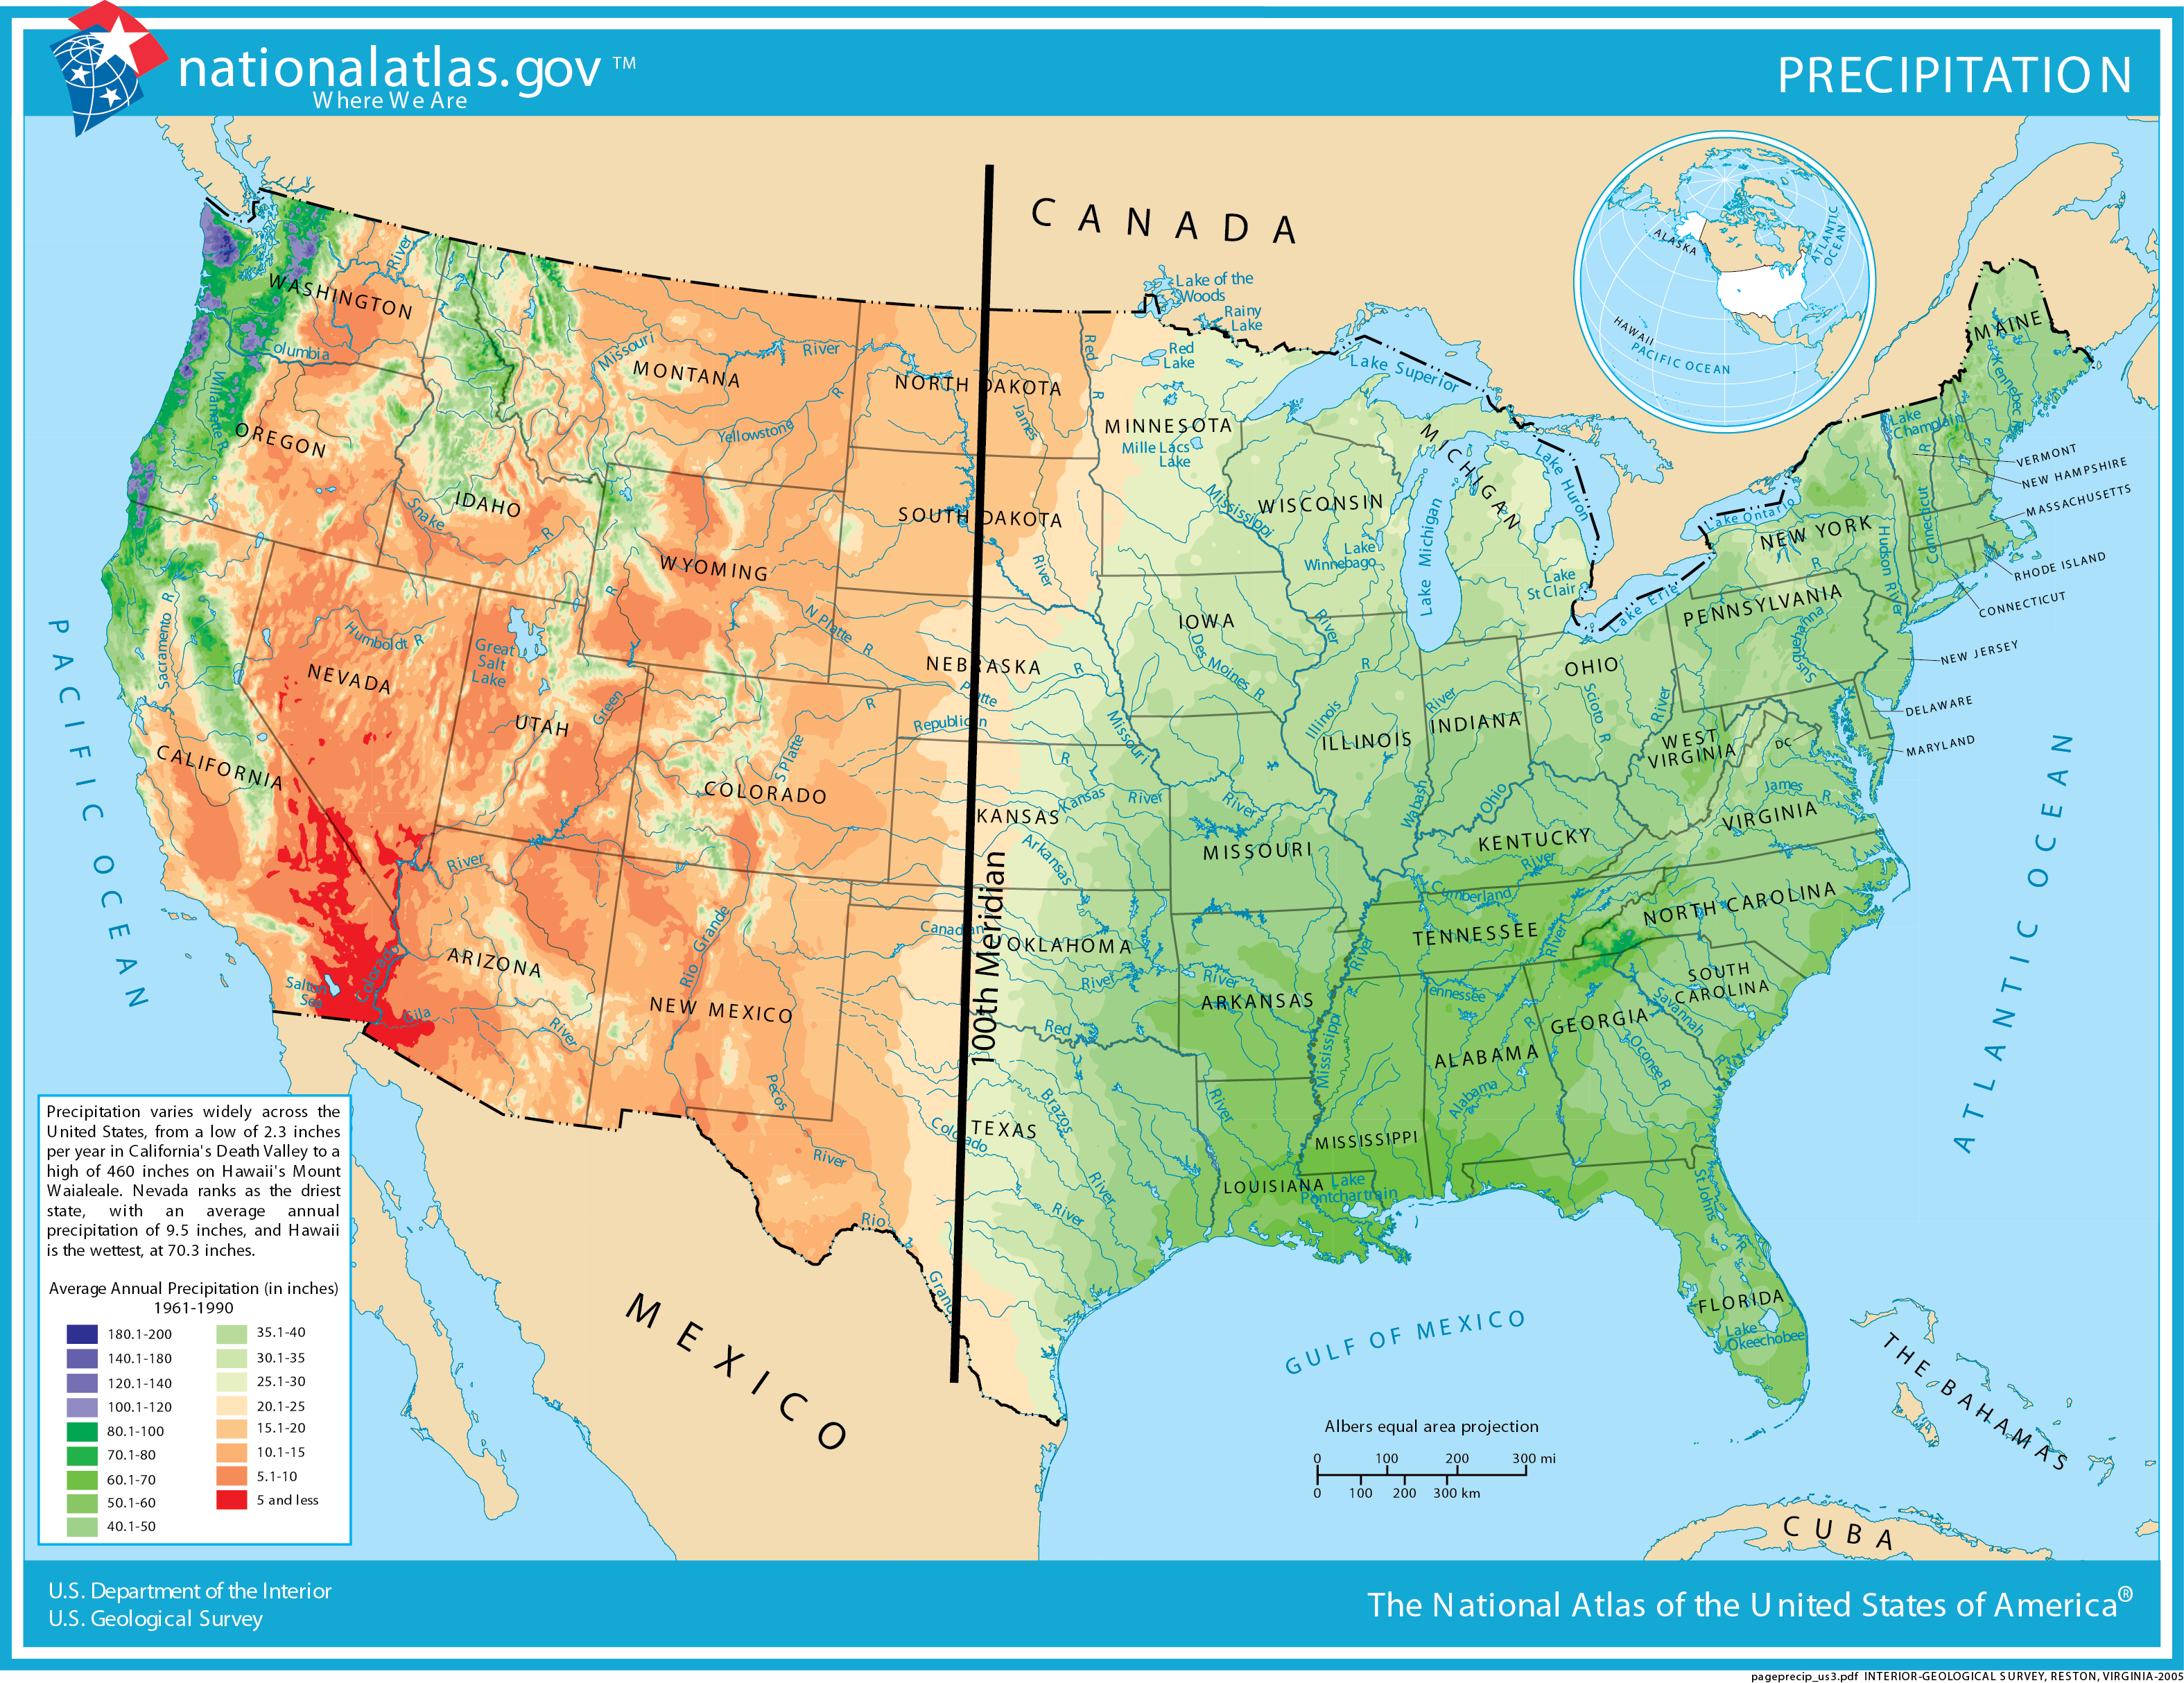
Figure \(\PageIndex{9}\): Distribution of precipitation in the United States. The 100th Meridian is approximately where the average precipitation transitions from relatively wet to dry. Eastern states are mostly green, indicating greater precipitation than most western states, which are mainly orange or red (indicating low precipitation). (Source: U.S. Geological Survey)
Surface Water: Rivers and Lakes
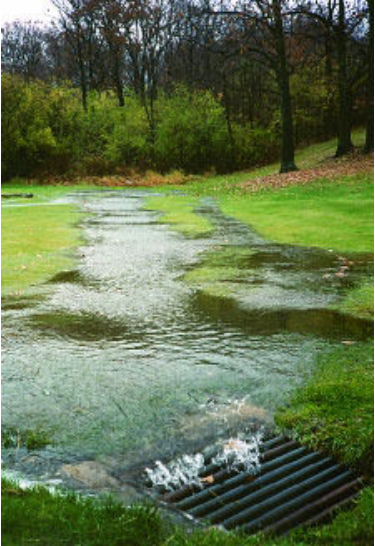
Figure \(\PageIndex{10}\): Surface runoff, part of overland flow in the water cycle Source: James M. Pease at Wikimedia Commons
Rivers are an important water resource for irrigation of cropland and drinking water for many cities around the world. Flowing water from rain and melted snow on land enters river channels by surface runoff (figure \(\PageIndex{10}\)) and seepage from surrounding land (figure \(\PageIndex{11}\)).
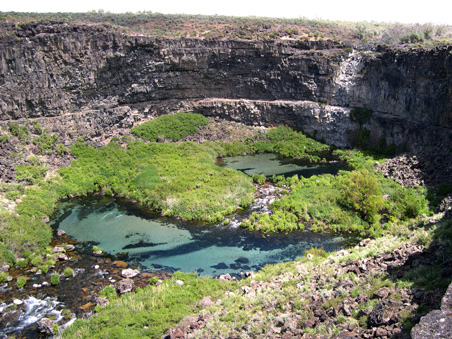
Figure \(\PageIndex{11}\): Groundwater Seepage Groundwater seepage can be seen in Box Canyon in Idaho, where approximately 10 cubic meters per second of seepage emanates from its vertical headwall. Source: NASA
River discharge describes the volume of water moving through a river channel over time (see Figure \(\PageIndex{12}\)). The relative contributions of surface runoff vs. groundwater seepage to river discharge depend on precipitation patterns, vegetation, topography, land use, and soil characteristics. Soon after a heavy rainstorm, river discharge increases due to surface runoff. The steady normal flow of river water is mainly from groundwater that discharges into the river. Gravity pulls river water downhill toward the ocean. Along the way the moving water of a river can erode soil particles and dissolve minerals, creating the river’s load of moving sediment grains and dissolved ions. Groundwater also contributes a large amount of the dissolved ions in river water. The geographic area drained by a river and its tributaries is called a watershed or drainage basin. The Mississippi River watershed includes approximately 40% of the U.S., a measure that includes the smaller watersheds, such as the Ohio River and Missouri River that help to comprise it. Rivers that have had international disputes over water supply include the Colorado (Mexico, southwest U.S.), Nile (Egypt, Ethiopia, Sudan), Euphrates (Iraq, Syria, Turkey), Ganges (Bangladesh, India), and Jordan (Israel, Jordan, Syria).
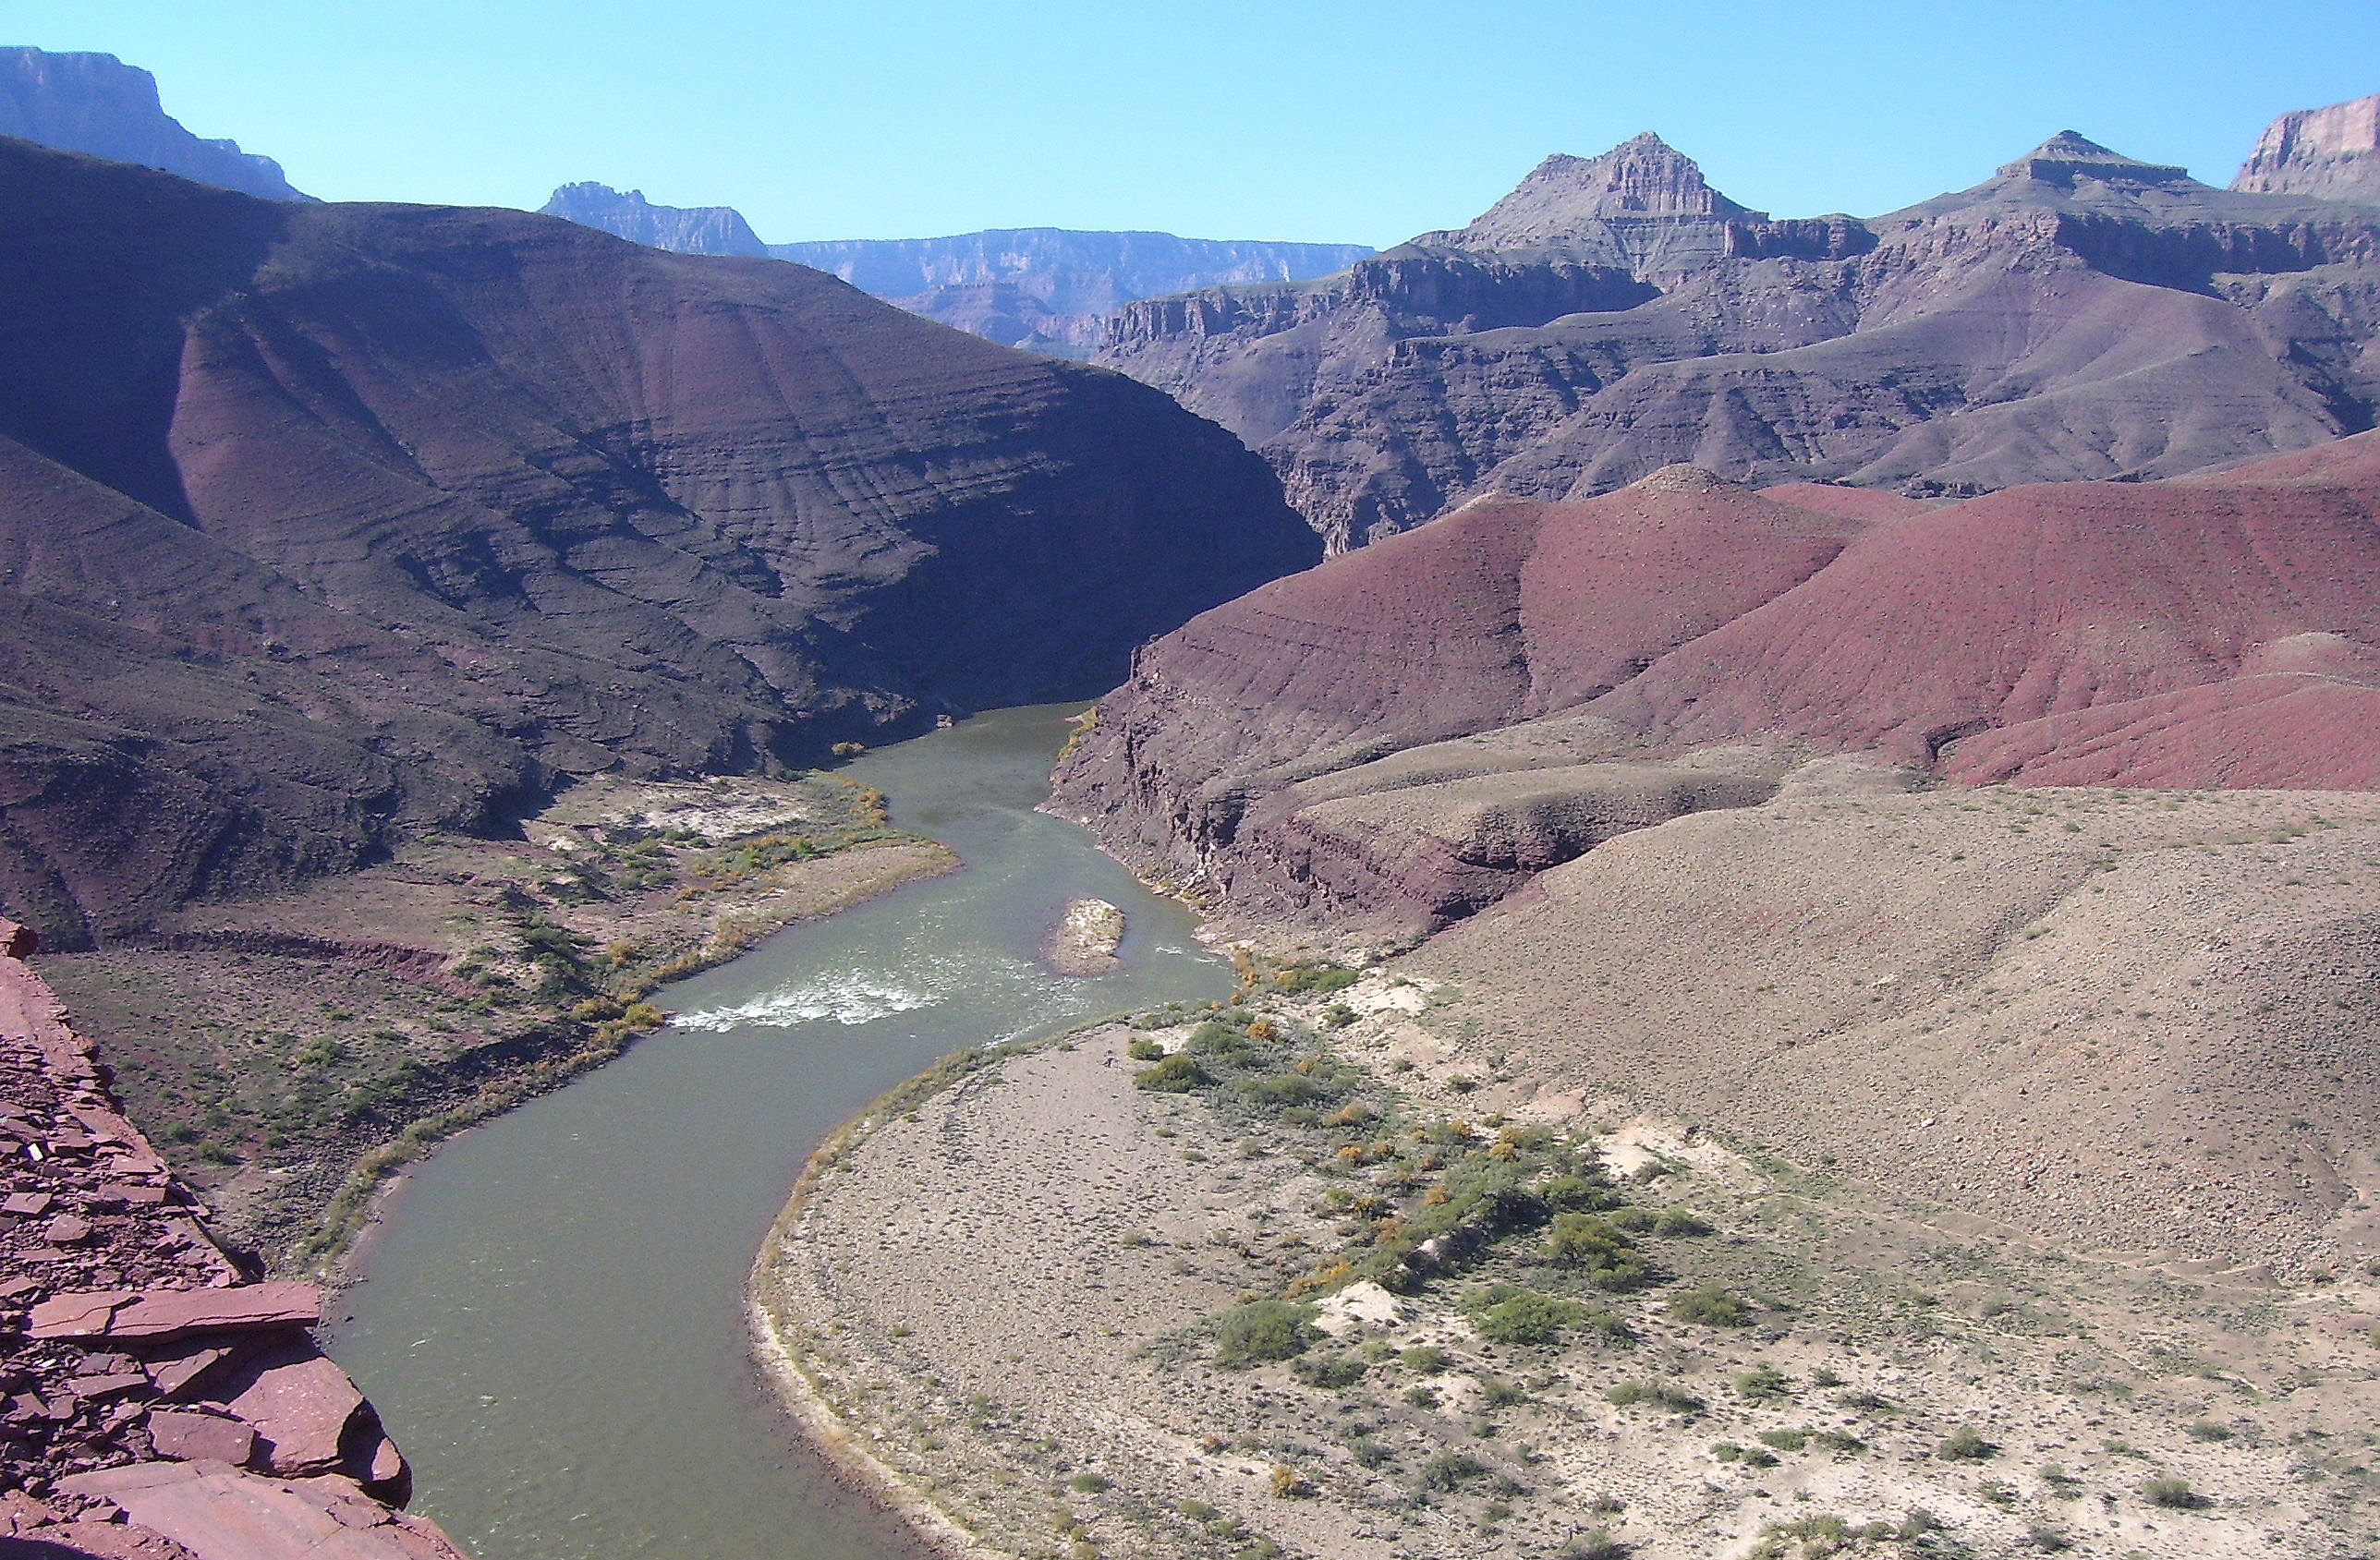
Figure \(\PageIndex{12}\): River Discharge Colorado River, U.S.. Rivers are part of overland flow in the water cycle and an important surface water resource. Source: Gonzo fan2007 at Wikimedia Commons
The Colorado River, probably the most exploited river in the U.S., has many dams, some huge reservoirs, and several large aqueducts so that it can provide large amounts of fresh water to 7 states in the arid southwestern U.S. and Mexico. The primary use for the water is for a few large cities (Las Vegas, Phoenix, and Tuscon) and irrigation. Allocation of Colorado River water is strictly regulated. Fortunately, not all states use all of their water allocation because the total amount of allocated water is more than the typical Colorado River discharge. Colorado River water gets so saline due to evaporation along its course that the U.S. was forced to build a desalination plant near the border with Mexico so that it could be used for drinking and irrigation. The wetlands of the Colorado River delta and its associated ecosystem have been sadly degraded by the water overuse; some years, no river flow even reaches the ocean.
Lakes can also be an excellent source of fresh water for human use. They usually receive water from surface runoff and groundwater discharge. They tend to be short-lived on a geological time-scale because they are constantly filling in with sediment supplied by rivers. Lakes form in a variety of ways including glaciation (Great Lakes, North America, See Figure \(\PageIndex{13}\):), recent tectonic uplift (Lake Tanganyika, Africa), and volcanic eruptions (Crater Lake, Oregon). People also create artificial lakes (reservoirs) by damming rivers. Large changes in climate can result in major changes in a lake’s size. As Earth was coming out of the last Ice Age about fifteen thousand years ago, the climate in the western U.S. changed from cool and moist to warm and arid, which caused more than 100 large lakes to disappear. The Great Salt Lake in Utah is a remnant of a much larger lake called Lake Bonneville.
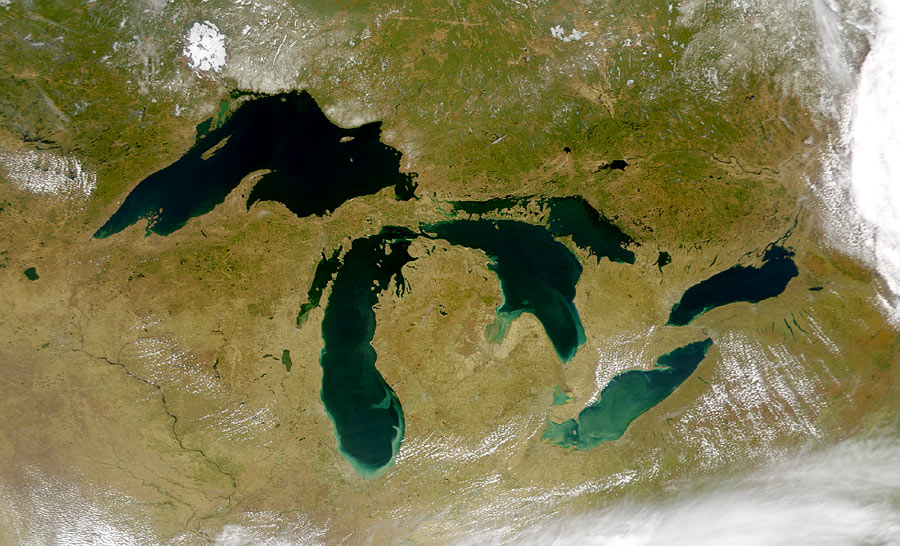
Figure \(\PageIndex{13}\): Great Lakes from Space The Great Lakes hold 21% of the world's surface fresh water. Lakes are an important surface water resource. Source: SeaWiFS Project, NASA/Goddard Space Flight Center, and ORBIMAGE
Surface Water: Glaciers
Although glaciers represent the largest reservoir of fresh water, they generally are not used as a water source because they are located too far from most people (see Figure \(\PageIndex{14}\)). Melting glaciers do provide a natural source of river water and groundwater. A large part of the world's population uses surface water which originally comes from melting snow and glaciers in mountain regions. During the last Ice Age there was as much as 50% more water in glaciers than there is today, which caused sea level to be about 100 m lower. Over the past century, sea level has been rising in part due to melting glaciers. If Earth’s climate continues to warm, the melting glaciers will cause an additional rise in sea level.
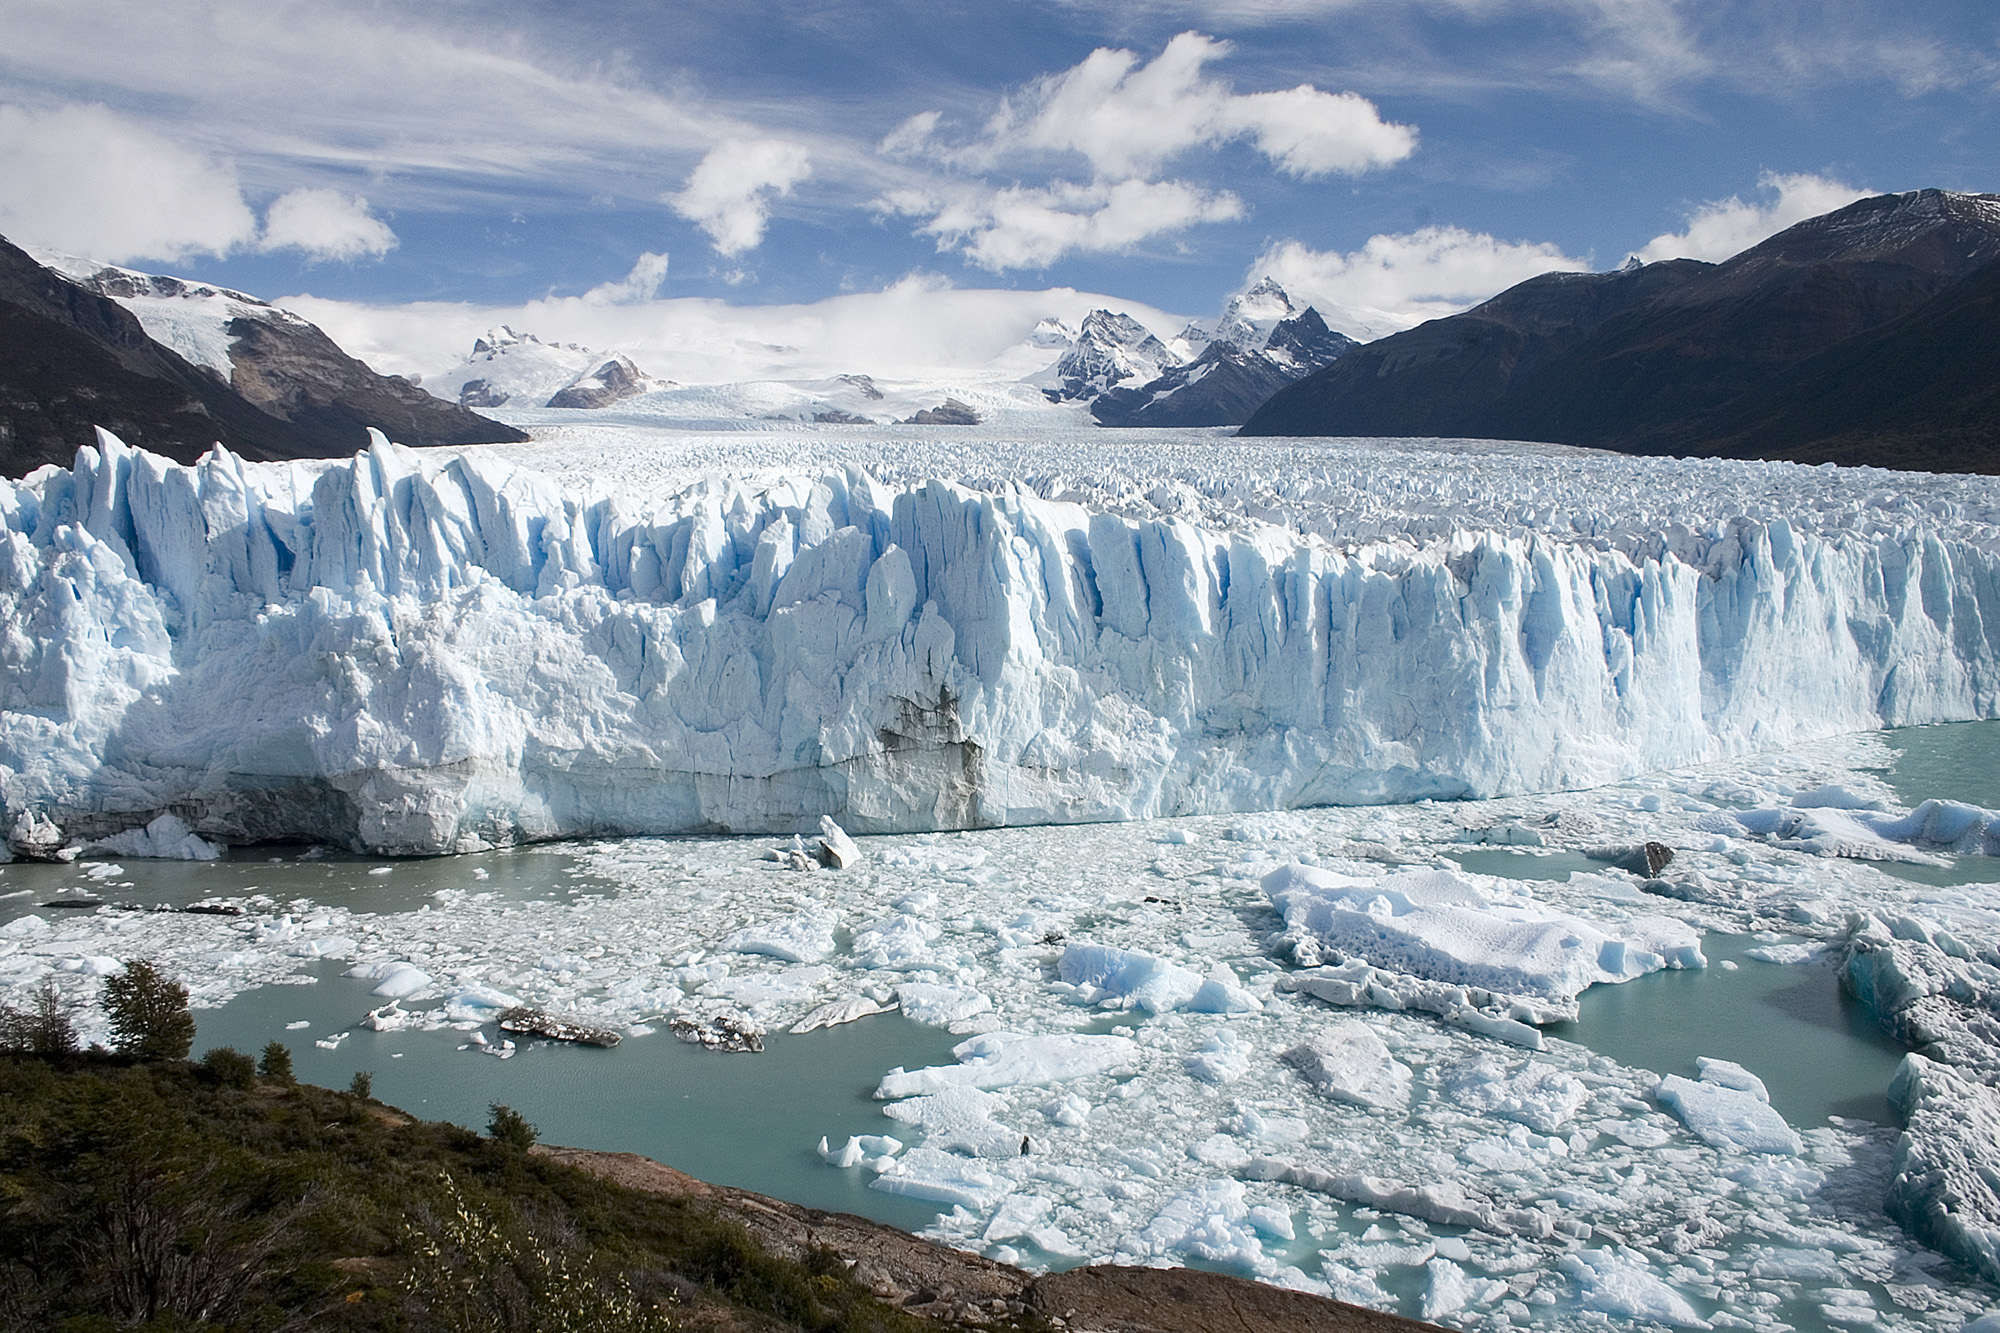
Figure \(\PageIndex{14}\): Figure 7. Mountain Glacier in Argentina Glaciers are the largest reservoir of fresh water but they are not used much as a water resource directly by society because of their distance from most people. Source: Luca Galuzzi – www.galuzzi.it
Groundwater Resources
Groundwater is water located in small spaces, called pore space, between mineral grains and fractures in subsurface earth materials (rock or sediment, i.e., loose grains). Although most people in the world use surface water, groundwater is a much larger reservoir of usable freshwater, containing more than 30 times more water than rivers and lakes combined. Groundwater is a particularly important resource in arid climates, where surface water may be scarce. In addition, groundwater is the primary water source for rural homeowners, providing 98% of that water demand in the U.S. Groundwater is not located in underground rivers or lakes except where there are caves, which are relatively rare. A large area of subsurface, porous rock unit or sediment that holds extractable groundwater is an aquifer. Between the land surface and the depth where there is groundwater is the unsaturated zone, where pore spaces contain only air and water films on mineral grains (figure \(\PageIndex{15}\)). The saturated zone of an aquifer is where groundwater completely fills pore spaces in earth materials (figure \(\PageIndex{15}\)). The water table is the uppermost level at which the pores are fully saturated with water (figure \(\PageIndex{15}\)).
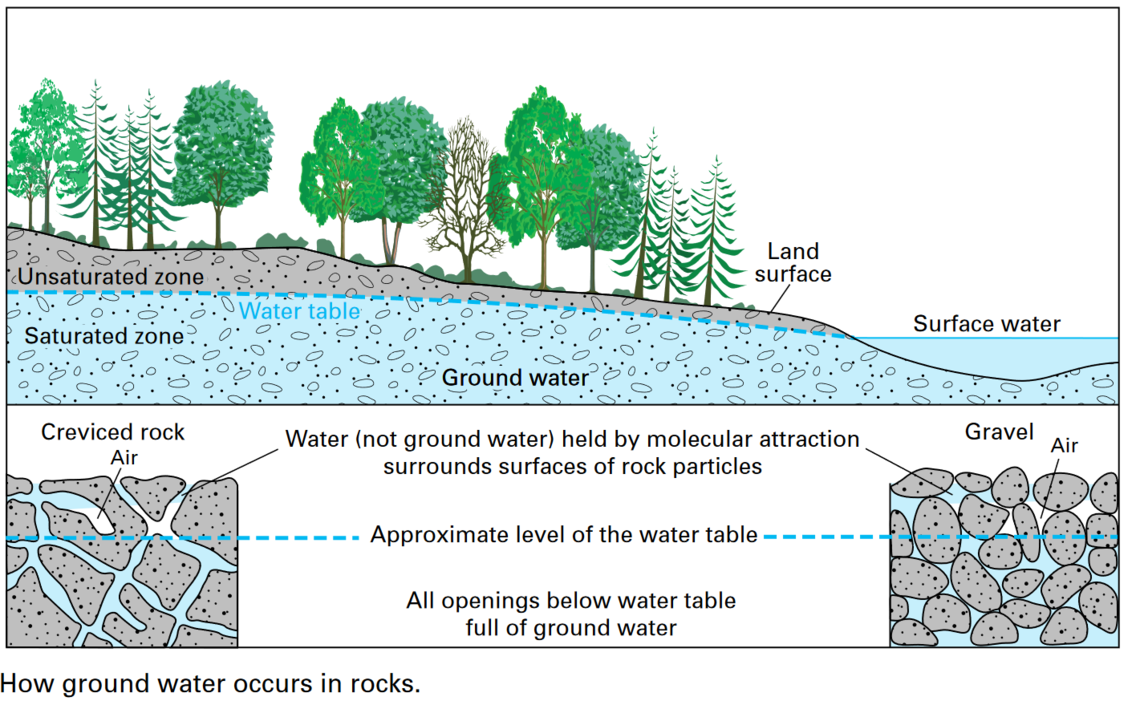
Figure \(\PageIndex{15}\): The unsaturated and saturated zones of an aquifer, which stores groundwater. The water table is the upper level of the saturated zone. The land surface is covered in vegetation, and the top of the surface water is continuous with the water table. The bottom of the image shows creviced rock (left) and gravel (right), both of which contain spaces that store air and water. Above the water table, water (not groundwater) is held by molecular attraction and surrounds the surfaces of rock particles. All openings below the water table are full of water table. Image by USGS (public domain)
A combination of a place to put water (porosity) and the ability to move water (permeability) makes a good aquifer. Porosity is a measure of the open space in rocks –expressed as the percentage of open space that makes up the total volume of the rock or sediment material. Permeability is a measure of the interconnectedness of pores in a rock or sediment. The connections between pores allows for that material to transmit water. Groundwater is in constant motion due to interconnection between pore spaces. Examples of aquifers are earth materials with abundant, large, well-connected pore spaces such as sand, gravel, uncemented sandstone, and any highly fractured rock. Porosity and permeability are functions of soil particle composition. For example, clays generally have very high porosity, but the pores are poorly connected, thereby causing low permeability.
Hydraulic conductivity is another common measure of the connectedness of pore spaces and is a function of both permeability and fluid properties. Because it considers fluid properties, hydraulic conductivity is used by both petroleum geologists and hydrogeologists to describe the production capability of oil reservoirs and aquifers. A high hydraulic conductivity indicates a rapid transmission of fluid through an aquifer.
Most groundwater originates from rain or snowmelt, which infiltrates the ground and moves downward until it reaches the saturated zone. Other sources of groundwater include seepage from surface water (lakes, rivers, reservoirs, and swamps), surface water deliberately pumped into the ground, irrigation, and underground wastewater treatment systems, i.e., septic tanks. Recharge areas are locations where surface water infiltrates the ground rather than running off into rivers or evaporating (figure \(\PageIndex{16}\)). Recharge areas are generally the topographically highest location of an aquifer. They are characterized by streams that lie below the water table and sediment or rock that allows infiltration into the subsurface. Wetlands, for example, are excellent recharge areas. Recharge areas mark the beginning of groundwater flow paths.
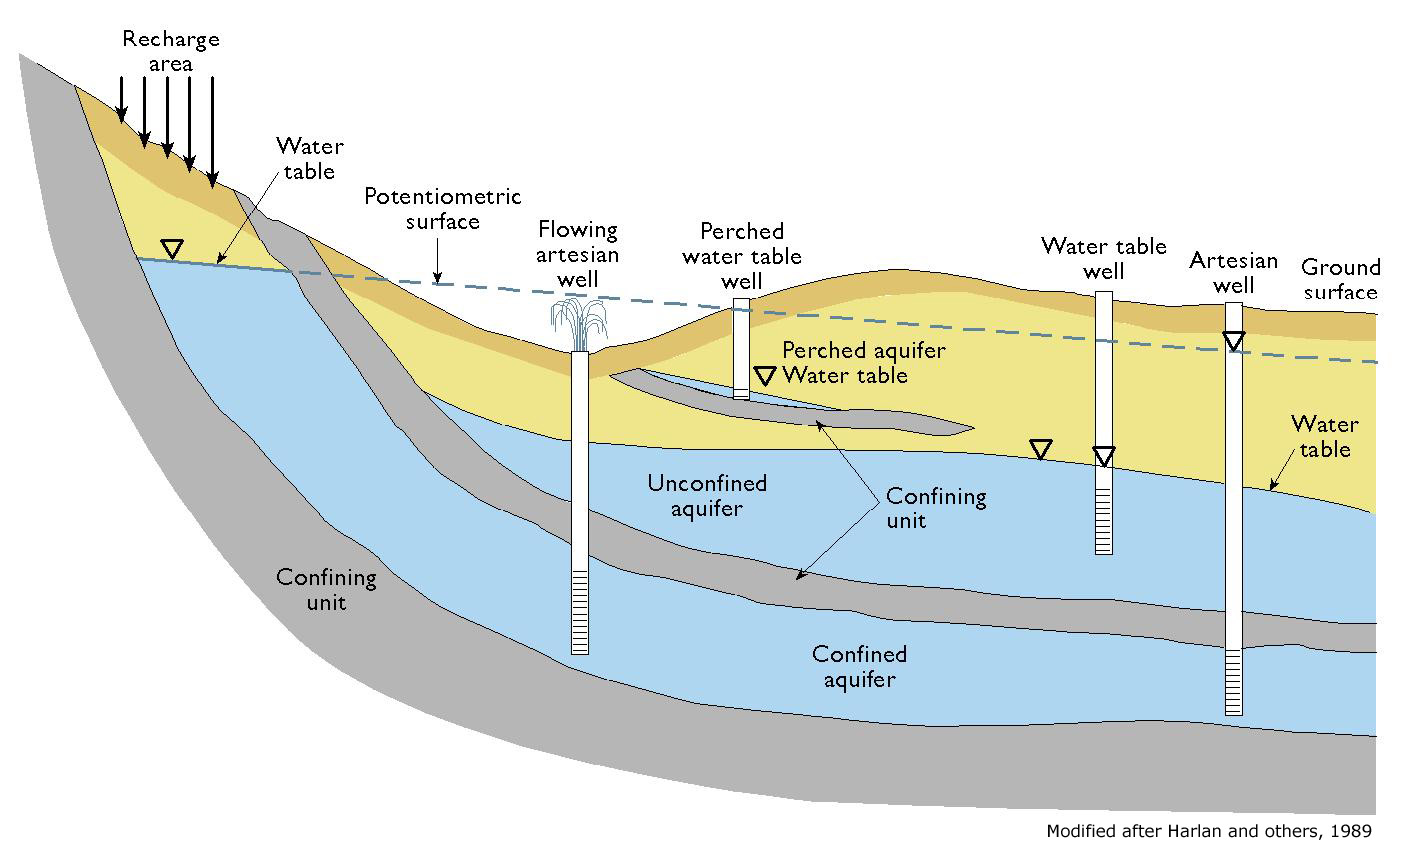
Figure \(\PageIndex{16}\)): Schematic Cross Section of Aquifer Types This figure shows different types of aquifers and water wells, including unconfined aquifer, confined aquifer, water table well, artesian well, and flowing artesian well. Point of triangle is water level in each well and water table in other parts of figure. Water level in artesian well is at potentiometric surface and above local water table (dashed blue line) due to extra pressure on groundwater in confined aquifer. Water in flowing artesian well moves above land surface. Source: Colorado Geological Survey
Another reason for groundwater movement is that the surface of the water table commonly is not completely flat but mimics the topography of the land surface, especially in humid climates. There is "topography" to the water table because groundwater moves slowly through rock and soil, so it builds up in higher elevation areas. An earth material with low hydraulic conductivity is an aquitard. Examples of aquitards include clay, shale (sedimentary rock with abundant clay), and igneous and metamorphic rock, if they contain few fractures. In fact, when groundwater flows slowly through aquitards and deep underground, it can take many thousands of years to move relatively short distances. An unconfined aquifer has no aquitard above it and, therefore, it is exposed to the atmosphere and surface waters through interconnected pores (Figure \(\PageIndex{16}\)). In an unconfined aquifer, groundwater flows because of gravity to lower water table levels, where it eventually may discharge or leave the groundwater flow system. Discharge areas include rivers, lakes, swamps, reservoirs, water wells, and springs (Figure \(\PageIndex{16}\)). Springs are rivers that emerge from underground due to an abrupt intersection of the land surface and the water table caused by joints, caves, or faults that bring permeable earth materials to the surface. A confined aquifer is bounded by aquitards below and above, which prevents recharge from the surface immediately above. Instead, the major recharge occurs where the confined aquifer intercepts the land surface, which may be a long distance from water wells and discharge areas (Figure \(\PageIndex{16}\)). Confined aquifers are commonly inclined away from recharge areas, so groundwater in a confined aquifer is under greater-than-atmospheric pressure due to the weight of water in the upslope direction. Similar to river discharge, groundwater discharge describes the volume of water moving through an aquifer over time. Total groundwater discharge depends on the permeability of the earth material, the pressure that drives groundwater flow, and the size of the aquifer. It is important to determine groundwater discharge to evaluate whether an aquifer can meet the water needs of an area.
Human Impacts on Groundwater
Aquifers are commonly drilled, and wells installed, to provide water for agriculture and personal use. In many cases aquifers are being depleted faster than they are being replenished by water infiltrating down from above. Most shallow water wells are drilled into unconfined aquifers. These are called water table wells because the water level in the well coincides with the water table (Figure \(\PageIndex{16}\)). 90% of all aquifers for water supply are unconfined aquifers composed of sand or gravel. To produce water from a well, you simply need to drill a hole that reaches the saturated zone and then pump water to the surface. Attempting to pump water from the unsaturated zone is like drinking root beer with a straw immersed only in the foam at the top.
To find a large aquifer for a city, hydrogeologists (geologists who specialize in groundwater) use a variety of information including knowledge of earth materials at the surface and sub-surface as well as test wells. Some people search for water by dowsing, where someone holds a forked stick or wire (called a divining rod) while walking over an area. The stick supposedly rotates or deflects downward when the dowser passes over water. Controlled tests show that a dowser's success is equal to or less than random chance. Nevertheless, in many areas water wells are still drilled on dowser’s advice sometimes for considerable money. There is no scientific basis to dowsing.
Wells into confined aquifers typically are deeper than those into unconfined aquifers because they must penetrate a confining layer. The water level in a well drilled into a confined aquifer, which is an artesian well, (Figure \(\PageIndex{16}\)), moves above the local water table to a level called the potentiometric surface because of the greater pressure on the groundwater. Water in a flowing well (Figure \(\PageIndex{17}\)) moves all of the way to the land surface without pumping.
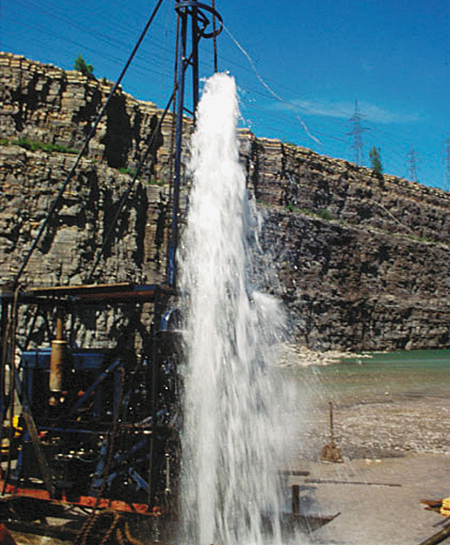
Figure \(\PageIndex{17}\): A Flowing Well Flowing artesian well where water moves above the land surface due to extra pressure on the groundwater in a confined aquifer. Source: Environment Canada
As groundwater is pumped from water wells, there usually is a localized drop in the water table around the well called a cone of depression (figure \(\PageIndex{18}\)). When there are a large number of wells that have been pumping water for a long time, the regional water table can drop significantly. This is called groundwater mining, which can force the drilling of deeper, more expensive wells that commonly encounter more saline groundwater.
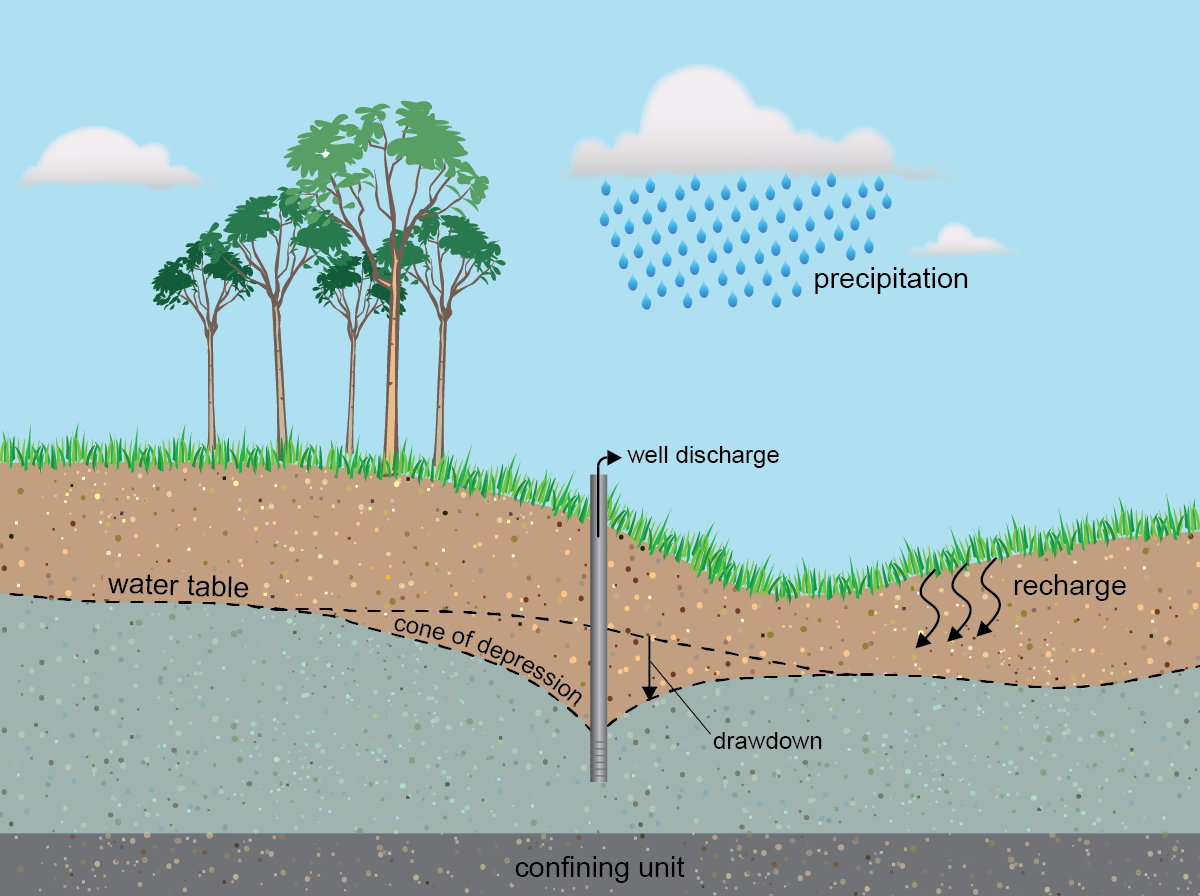
Figure \(\PageIndex{18}\): As groundwater is extracted from the well, the water table of the aquifer dips, forming a cone of depression. Drawdown is between the water table and the cone of depression. Precipitation is represented by water droplets falling from a cloud. It soaks into the ground, recharging the aquifer. At the bottom of the aquifer is the confining unit, which is impermeable to water. Image by Tara Gross/USGS (public domain).
A confined aquifer tends to be depleted from groundwater pumping more quickly than an unconfined aquifer, assuming similar aquifer properties and precipitation levels. This is because confined aquifers have smaller recharge areas, which may be far from the pumping well. Conversely, an unconfined aquifer tends to be more susceptible to pollution because it is hydrologically connected to the surface, which is the source of most pollution. Urban development usually worsens groundwater mining because natural recharge rates drop with the proliferation of impermeable pavement, buildings, and roads. Extensive groundwater pumping around Chicago has created a gigantic cone of depression there. Because the water table dropped up to 250 m (800 ft) in the area (Figure \(\PageIndex{19}\)), many local public water suppliers have switched to Lake Michigan water. Chicago is fortunate to have a large alternate supply of fresh water; many arid locations don’t have that luxury.
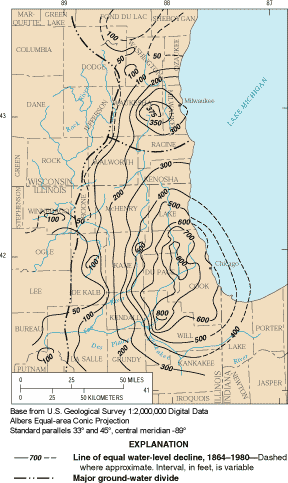
Figure \(\PageIndex{19}\): Drop in Water Table in a Confined Aquifer in the Area of Chicago, Illinois and Milwaukee, Wisconsin, U.S. from 1864 - 1980 Source: United States Geological Survey
Another water resource problem associated with groundwater mining is saltwater intrusion, where overpumping of fresh water aquifers near ocean coastlines causes saltwater to enter freshwater zones. The drop of the water table around a cone of depression in an aquifer can change the direction of regional groundwater flow, which could send nearby pollution toward the pumping well instead of away from it. Saltwater intrusion is a significant problem in many coastal areas of the U.S. including Long Island, New York; Cape Cod, Massachusetts; and southeastern and Gulf Coastal states.
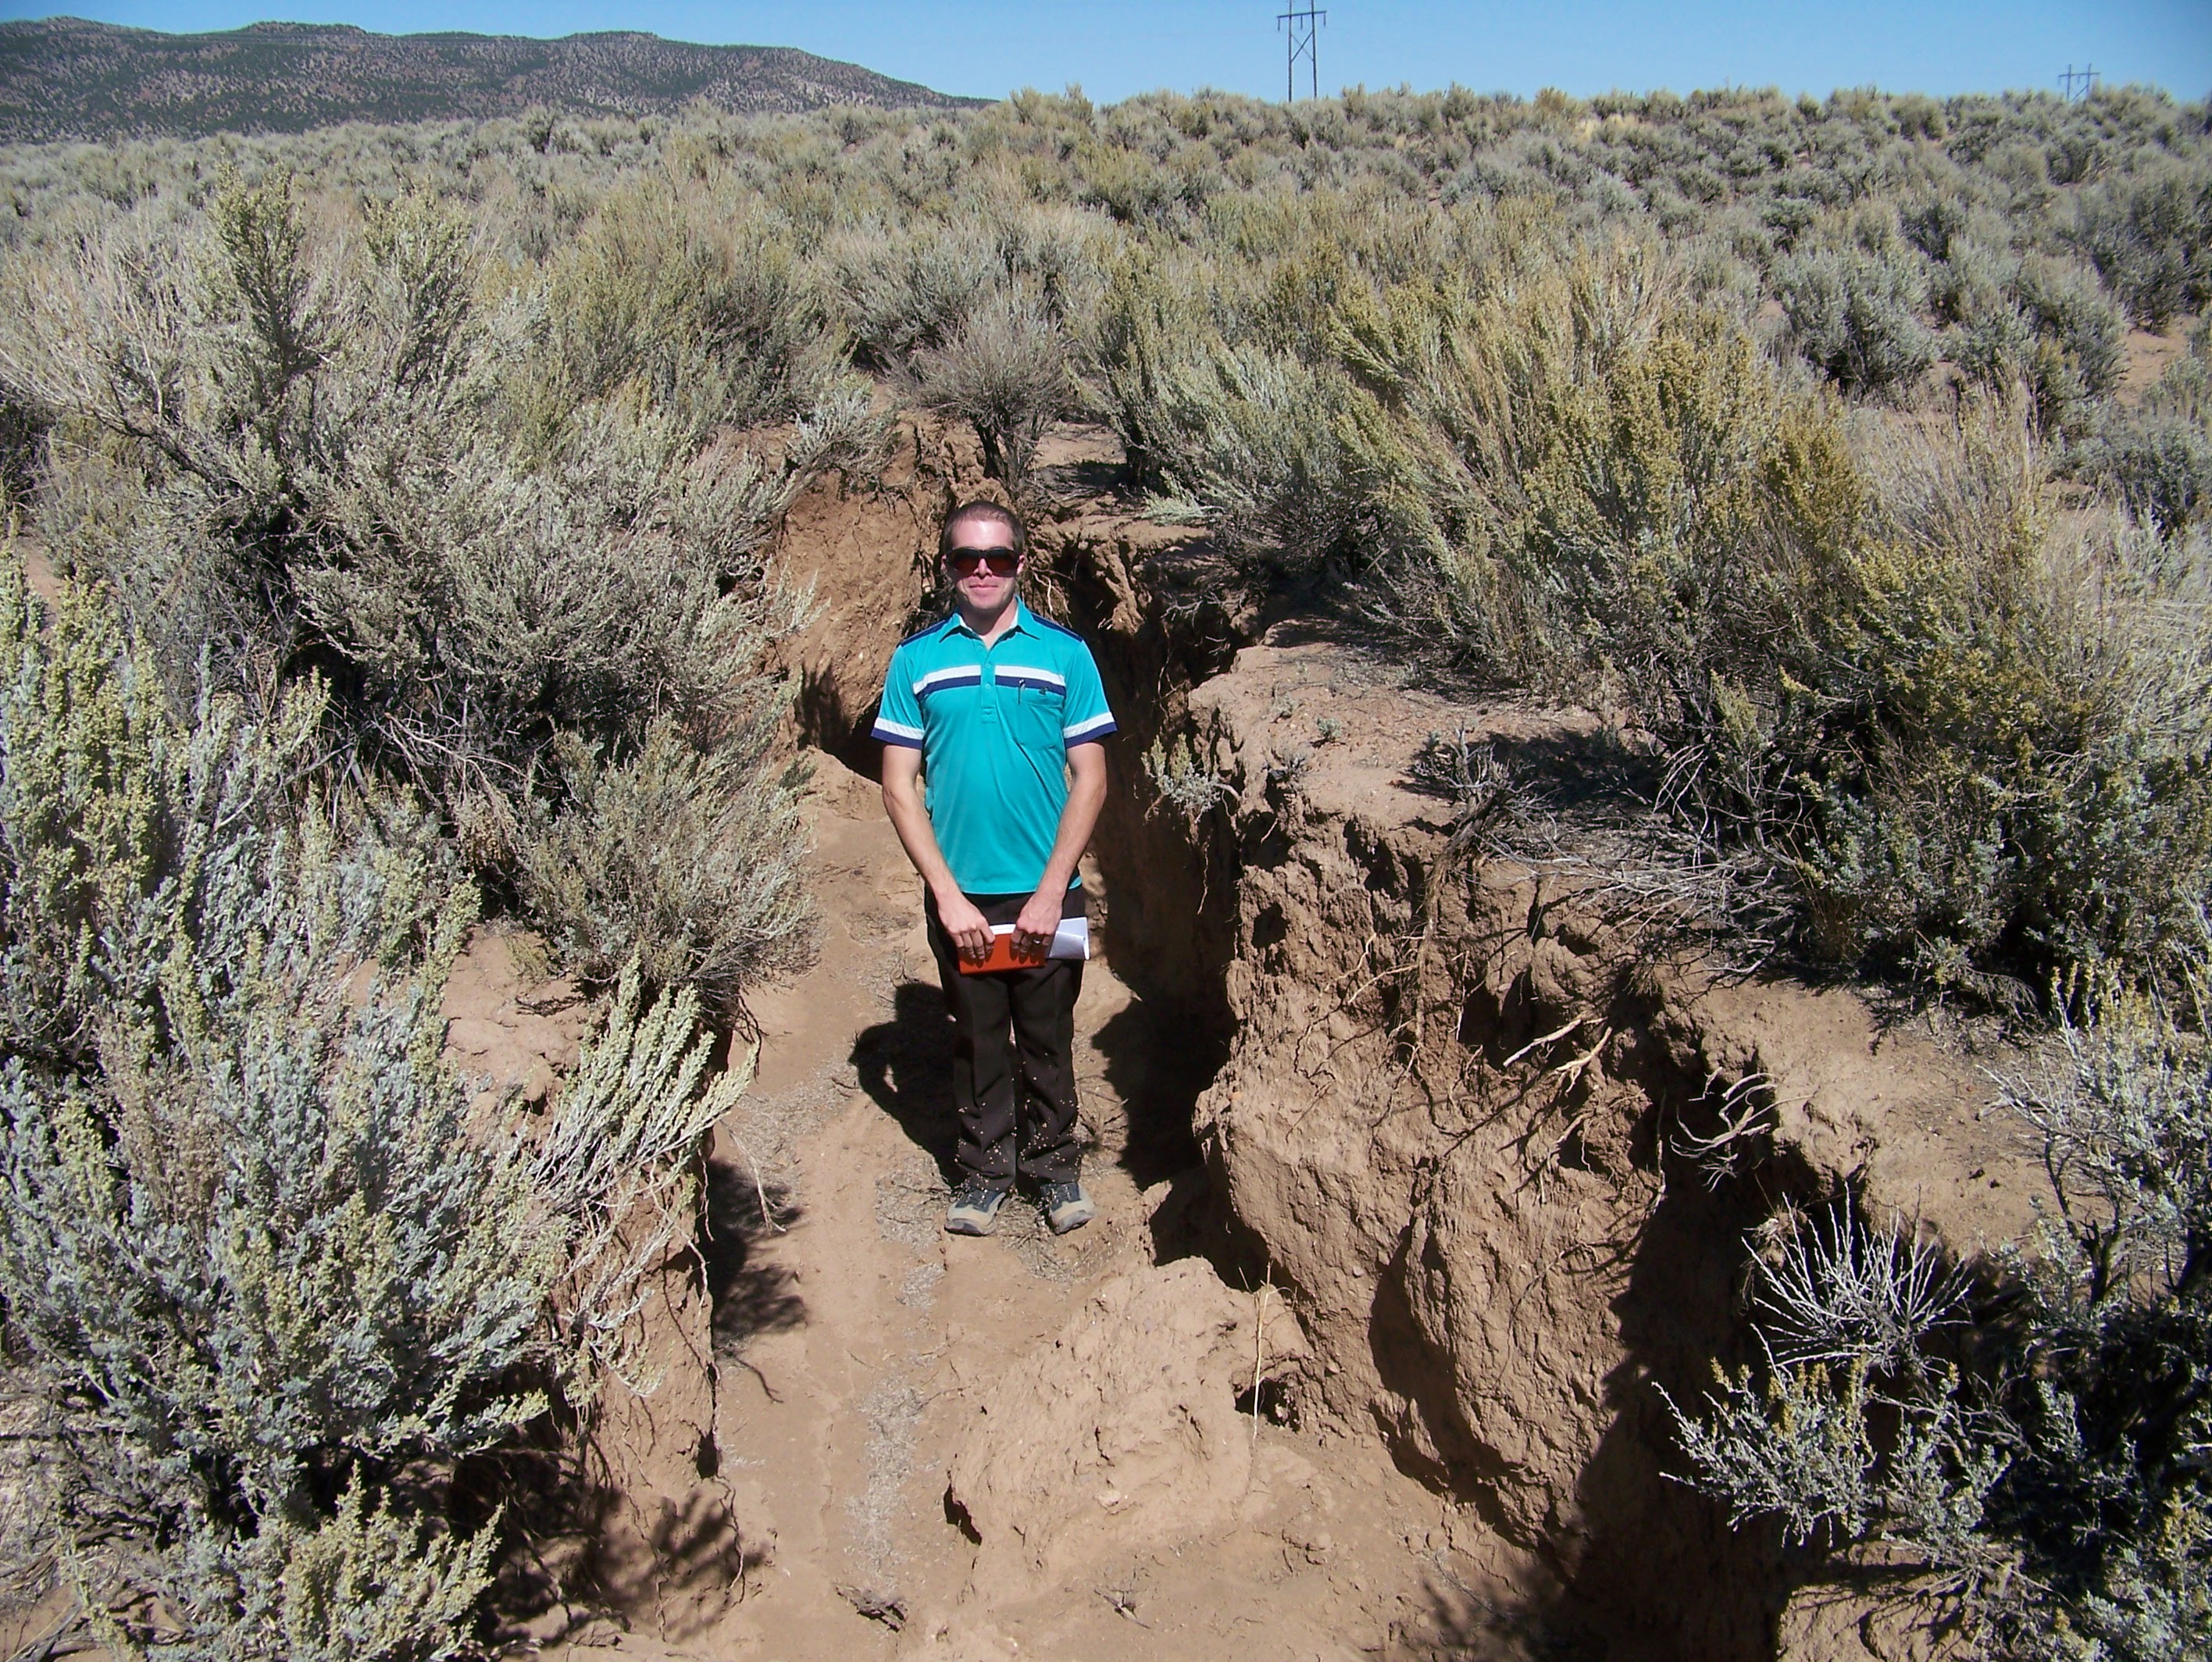
Finally, problems of subsidence (gradual sinking of the land surface over a large area) and sinkholes (rapid sinking of the land surface over a small area) can develop due to a drop in the water table (Figure \(\PageIndex{20-21}\)). Because the pores in the aquifer collapse as subsidence occurs, this permanently reduces the capacity of the aquifer to hold water in the future. In many places, water actually helps hold up the skeleton of the aquifer by the water pressure exerted on the grains in an aquifer. If pore pressure decreases because of groundwater mining, the aquifer can compact, causing the surface of the ground to sink. Areas especially susceptible to this effect are aquifers made of unconsolidated sediments. Unconsolidated sediments with multiple layers of clay and other fine-grained material are at higher risk because clay can compact considerably when drained of water [36, 37]. In many cases, the amount of compaction in one area will be greater than the amount of compaction in an adjacent area. The different amounts of compaction in areas that are next to each other can cause the land to offset and develop cracks and fissures.

Recharge can be induced through the aquifer management practice of aquifer storage and recovery. Injection wells allow for humans to increase the rate of recharge into an aquifer system by pumping water into an aquifer (figure \(\PageIndex{22}\)). Injection wells are regulated by state and federal governments to ensure that the injected water is not negatively impacting the quality or supply of the existing groundwater in the aquifer. Some aquifers are capable of storing significant quantities of water, allowing water managers to use the aquifer system like a surface reservoir. Water is stored in the aquifer during periods of low water demand and high water supply and later extracted during times of high water demand and low water supply.
Figure \(\PageIndex{22}\): Groundwater can be replenished through natural recharge areas as well as artificial injection wells. In this diagram, precipitation emerges from a storm cloud. Some of the water washes away as runoff, and some water infiltrates through the sand (natural recharge from precipitation). The water fills the sand and gravel in the aquifer (labeled ground water reservoir). Below the aquifer is bedrock, which is impermeable to water. Another natural source of recharge is from streams. Through an artificial recharge well, water flows from a pipe through a control valve into an injection pipe. This also adds to the groundwater. Image by USGS (public domain).
Water Supply Crisis
The water crisis refers to a global situation where people in many areas lack access to sufficient water, clean water, or both. This section describes the global situation involving water shortages, also called water stress. In general, water stress is greatest in areas with very low precipitation (major deserts), large population density (e.g., India), or both. Future global warming could worsen the water crisis by shifting precipitation patterns away from humid areas and by melting mountain glaciers that recharge rivers downstream. Melting glaciers will also contribute to rising sea level, which will worsen saltwater intrusion in aquifers near ocean coastlines.
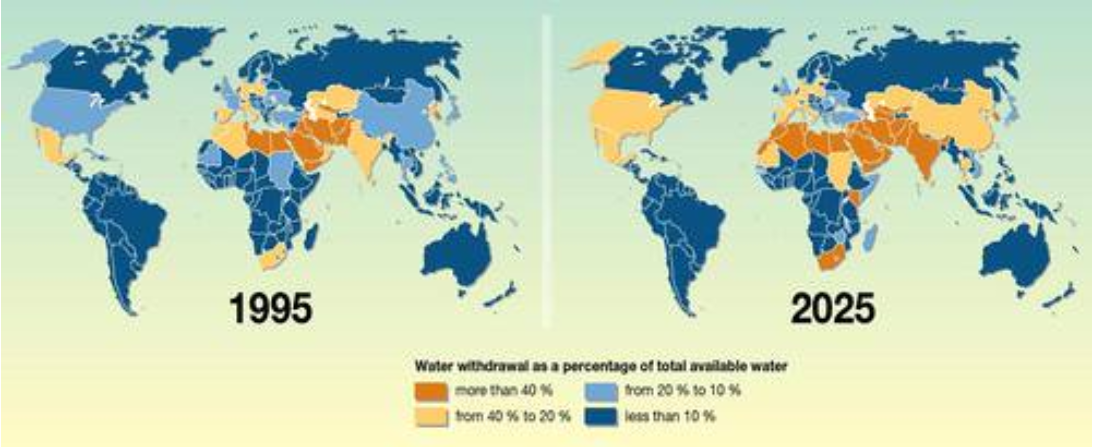
According to a 2006 report by the United Nations Development Programme, 700 million people (11% of the world’s population) lived with water stress. Most of them live in the Middle East and North Africa. By 2025, the report projects that more than 3 billion people (about 40% of the world’s population) will live in water-stressed areas with the large increase coming mainly from China and India. The water crisis will also impact food production and our ability to feed the ever-growing population. We can expect future global tension and even conflict associated with water shortages and pollution. Historic and future areas of water conflict include the Middle East (Euphrates and Tigris River conflict among Turkey, Syria, and Iraq; Jordan River conflict among Israel, Lebanon, Jordan, and the Palestinian territories), Africa (Nile River conflict among Egypt, Ethiopia, and Sudan), Central Asia (Aral Sea conflict among Kazakhstan, Uzbekistan, Turkmenistan, Tajikistan, and Kyrgyzstan), and south Asia (Ganges River conflict between India and Pakistan).
Water scarcity refers to water shortages, which can be physical or economic (Figure \(\PageIndex{24}\)). Physical water scarcity is the lack of sufficient water resources in an area; that is, water is depleted more quickly than it is replenished. Unpredictable precipitation patterns associated with climate change, which increase the risk of flooding and drought, exacerbates physical water scarcity. Economic water scarcity occurs when people cannot afford access to water. The United Nations estimates that over half of the global population faces water scarcity for one or more months of the year (see The Sustainable Development Goals Report 2019). According to the World Health Organization and UNICEF, 785 million people lack access to even a basic drinking water service and two billion people lack access to improved sanitation as simple as a pit latrine , and three billion people lack a facility to wash their hands. As a result, nearly 829,000 people die every year from diarrheal diseases, and 297,000 of those deaths occur among children under the age of five.
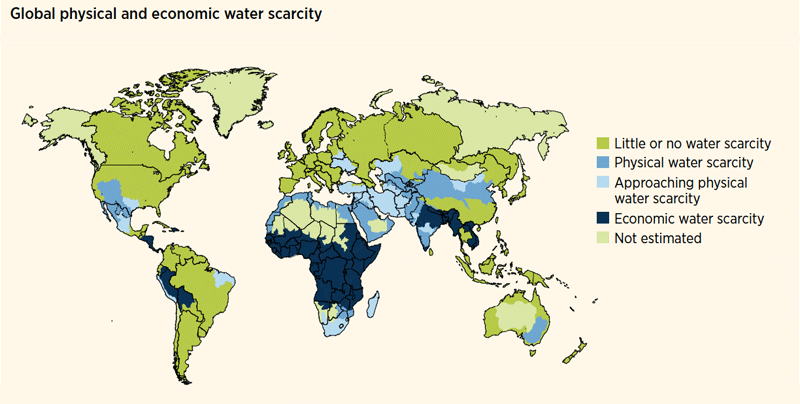
Figure \(\PageIndex{24}\): Regions facing or approaching water scarcity in 2012. Physical water stress occurs in the southwestern United States, the Middle East, North Africa, southern India, and southeast Australia. Economic water stress occurs in Central and East Africa, western India, and Southeast Asia. Image by World Water Assessment Programme (WWAP; public domain).
Sustainable Solutions to the Water Supply Crisis?
The current and future water crisis described above requires multiple approaches to extending our fresh water supply and moving towards sustainability. Some of the longstanding traditional approaches include dams and aqueducts.
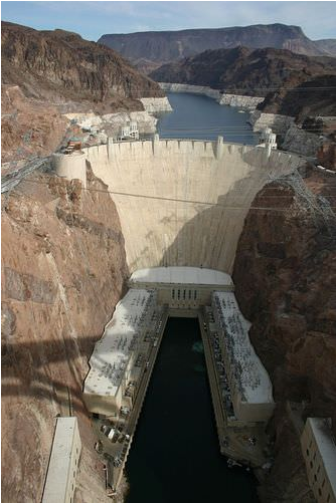
Reservoirs that form behind dams in rivers can collect water during wet times and store it for use during dry spells. They also can be used for urban water supplies. Other benefits of dams and reservoirs are hydroelectricity, flood control, and recreation. Some of the drawbacks are evaporative loss of water in arid climates, downstream river channel erosion, and impact on the ecosystem including a change from a river to lake habitat and interference with migration and spawning of fish.
Aqueducts can move water from where it is plentiful to where it is needed. Aqueducts can be controversial and politically difficult especially if the water transfer distances are large. One drawback is the water diversion can cause drought in the area from where the water is drawn. For example, Owens Lake and Mono Lake in central California began to disappear after their river flow was diverted to the Los Angeles aqueduct. Owens Lake remains almost completely dry, but Mono Lake has recovered more significantly due to legal intervention.
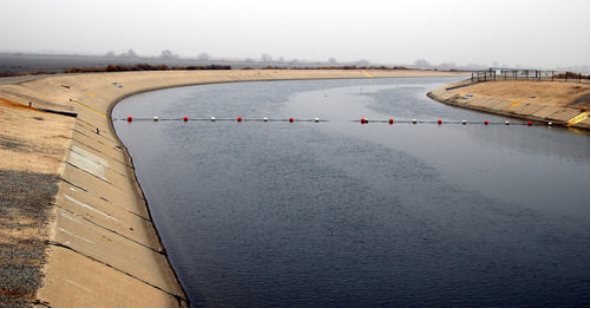
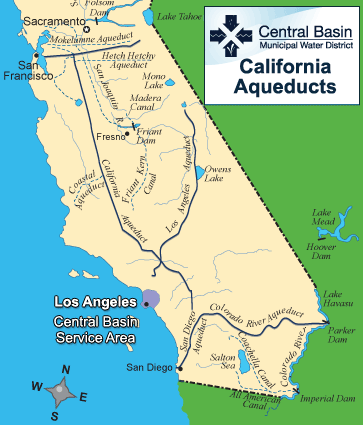
Figure \(\PageIndex{27}\). Map of California Aqueducts Map of California aqueducts that bring water to southern California from central and northern California and from the Colorado River to the east. Source: Central Basin Municipal Water District
Rainwater harvesting involves catching and storing rainwater before it reaches the ground. Figure \(\PageIndex{28}\) shows a complex rainwater harvesting system (rain water capture system) proposed for federal buildings, but smaller, simpler systems (sometimes called rain barrels) can be used by individual homeowners (figure \(\PageIndex{29}\)).
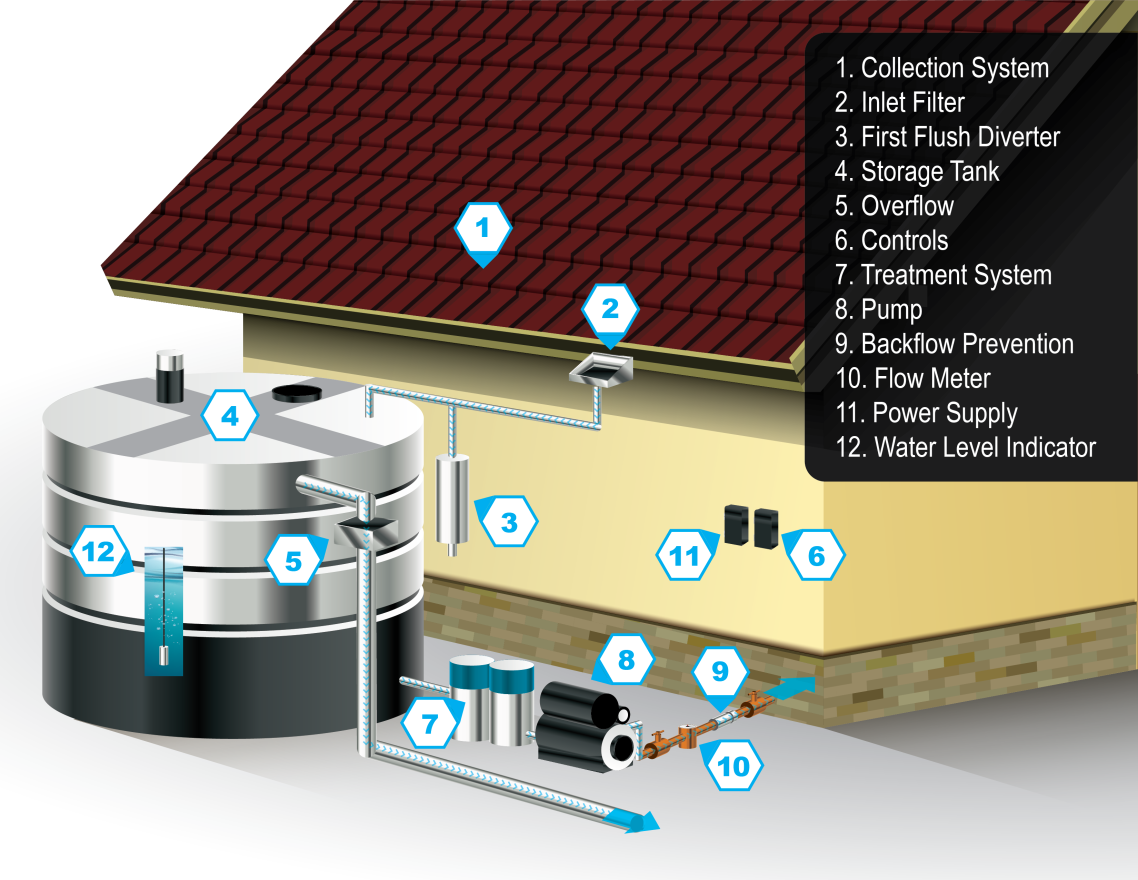
Figure \(\PageIndex{28}\): The components of a rainwater harvesting system include (1) the collection system consisting of the roof surface and gutters that capture rain water and send it to (2) the inlet filter, a screen that catches large debris. (3) The first flush diverter removes debris not captured by the inlet filter from the initial stream of rainwater. (4) The storage tank is composed of food-grade polyester resin material approved by the U.S. Food and Drug Administration (FDA), which is green in color and helps to reduce bacterial growth. (5) The overflow is a drainage spout that releases excess water if the storage tank is full. The (6) control system monitors the water level and filtration system, and the (7) treatment system is responsible for filtration and disinfection, treating water until it is potable (safe to drink). The (8) pump moves water through the system to where it will be used, and the (9) backflow preventer ensures that water cannot flow backwards through the system in cases of low water pressure (when the storage tank is low). (10) The flow meter (with data logger) measure water production. The (11) power supply may rely on conventional energy sources or solar energy, and the (12) water level indicator monitors the water level in the storage tank. Caption modified from and image from Office of Energy Efficiency and Renewable Energy, Department of Energy (public domain).
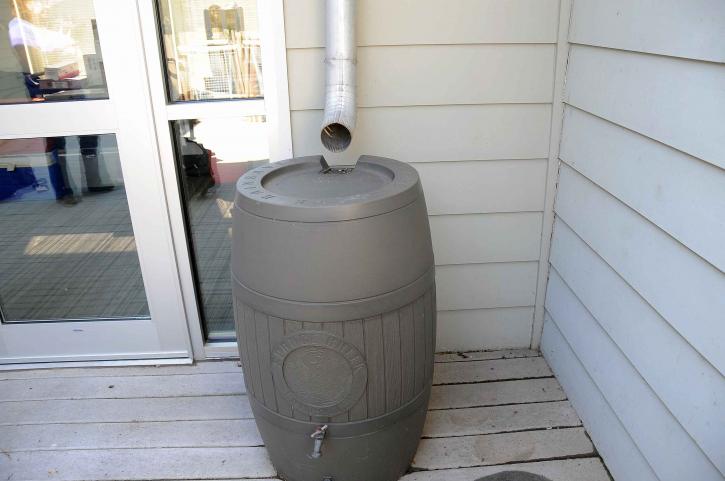
Figure \(\PageIndex{29}\): A rain barrel is a simple rainwater harvesting system. Homeowners commonly use the stored water to irrigate their gardens. Image by Walton LaVonda, USFWS (public domain).
One method that can actually increase the amount of fresh water on Earth is desalination, which involves removing dissolved salt from seawater or saline groundwater (figure \(\PageIndex{30}\)). An advantage of this approach is that there is a virtually unlimited supply of saltwater. There are several ways to desalinate seawater including boiling, filtration, and electrodialysis. All of these procedures are moderately to very expensive and require considerable energy input, making the water produced much more expensive than fresh water from conventional sources. In addition, the process creates highly saline wastewater, which must be disposed of and creates significant environmental impact. Desalination is most common in the Middle East, where energy from oil is abundant but water is scarce.
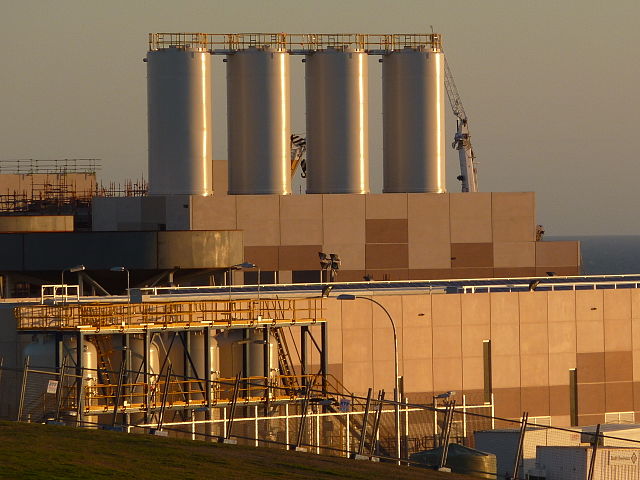
Figure \(\PageIndex{30}\): Port Stanvac Desalination Plant under construction in South Australia. Image by Vmenkov (CC-BY-SA).
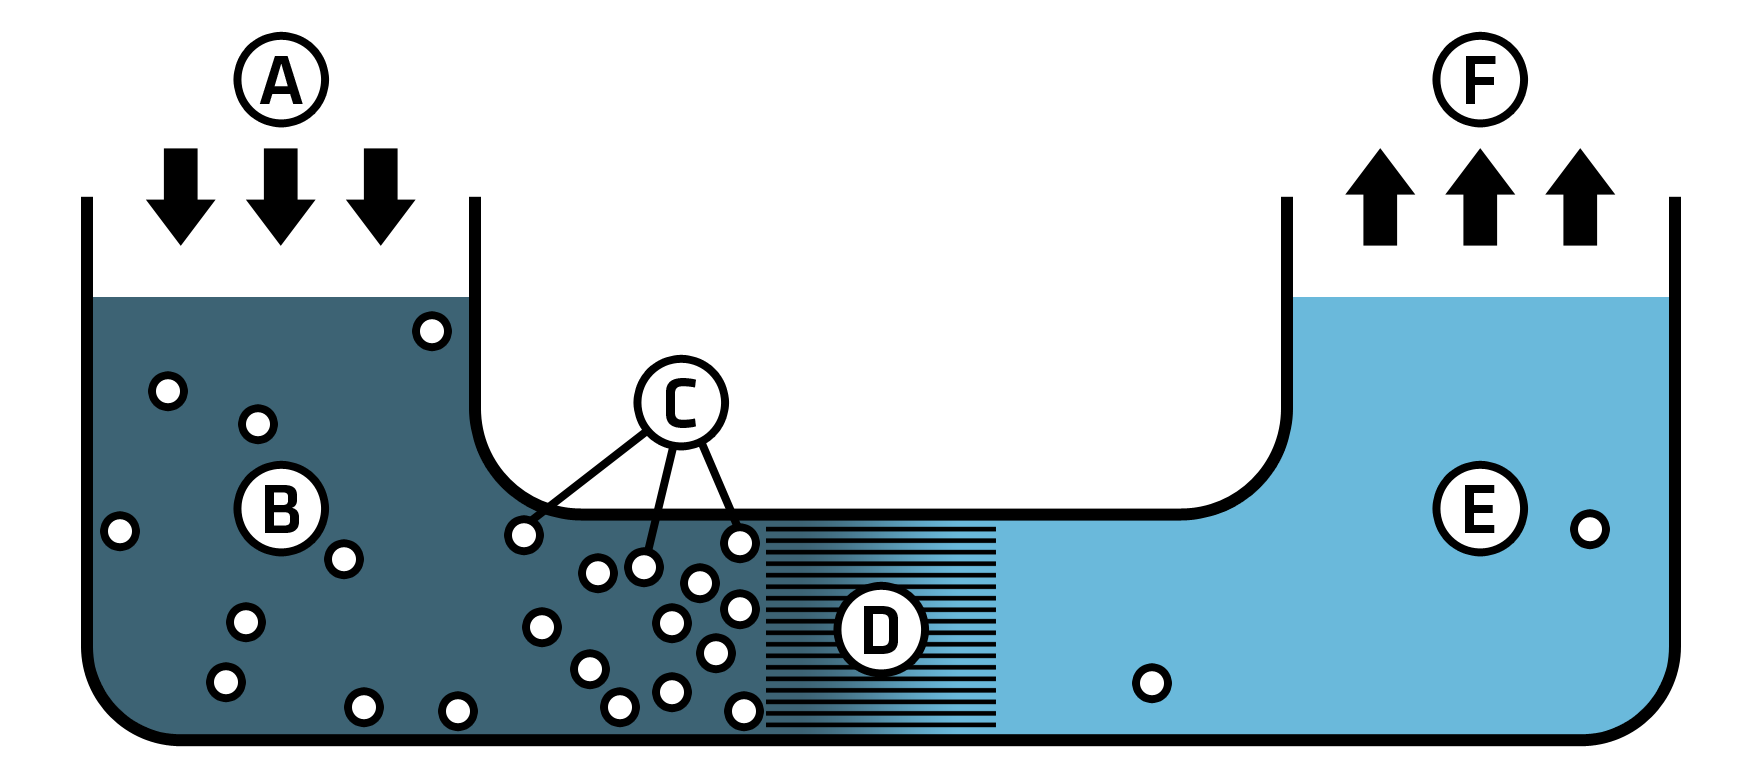
Figure \(\PageIndex{31}\): Reverse osmosis is one method of desalination. In this process, pressure (A) is applied to salt water, which contains ions (charged atoms or molecules) and other contaminants (C). The water is forced through a semipermeable membrane (D), through which the contaminants cannot pass. Clean freshwater that is safe to drink (E) is then distributed (F). Image by Colby Fisher (CC-BY-SA).
Water recycling refers to reusing water for appropriate purposes such as agriculture, municipal water supply, industrial processes, and environmental restoration (figure \(\PageIndex{32}\)). This could occur at the scale of a single household, for example, installing plumbing that reroutes water drained from the sink to flush the toilet. Water recycling can also occur at large scales. For example, wastewater from the sewage system is regularly treated to an extent, but it can be treated further to produce potable water (which is safe to drink) and then pumped into depleted aquifers. This approach limits saltwater intrusion of aquifers near the coast and reduces dependence on precipitation and subsequent infiltration to recharge aquifers. Orange County Water District in California employed this system following an information campaign to explain the purification process and ensure public confidence in the safety of the treated wastewater.
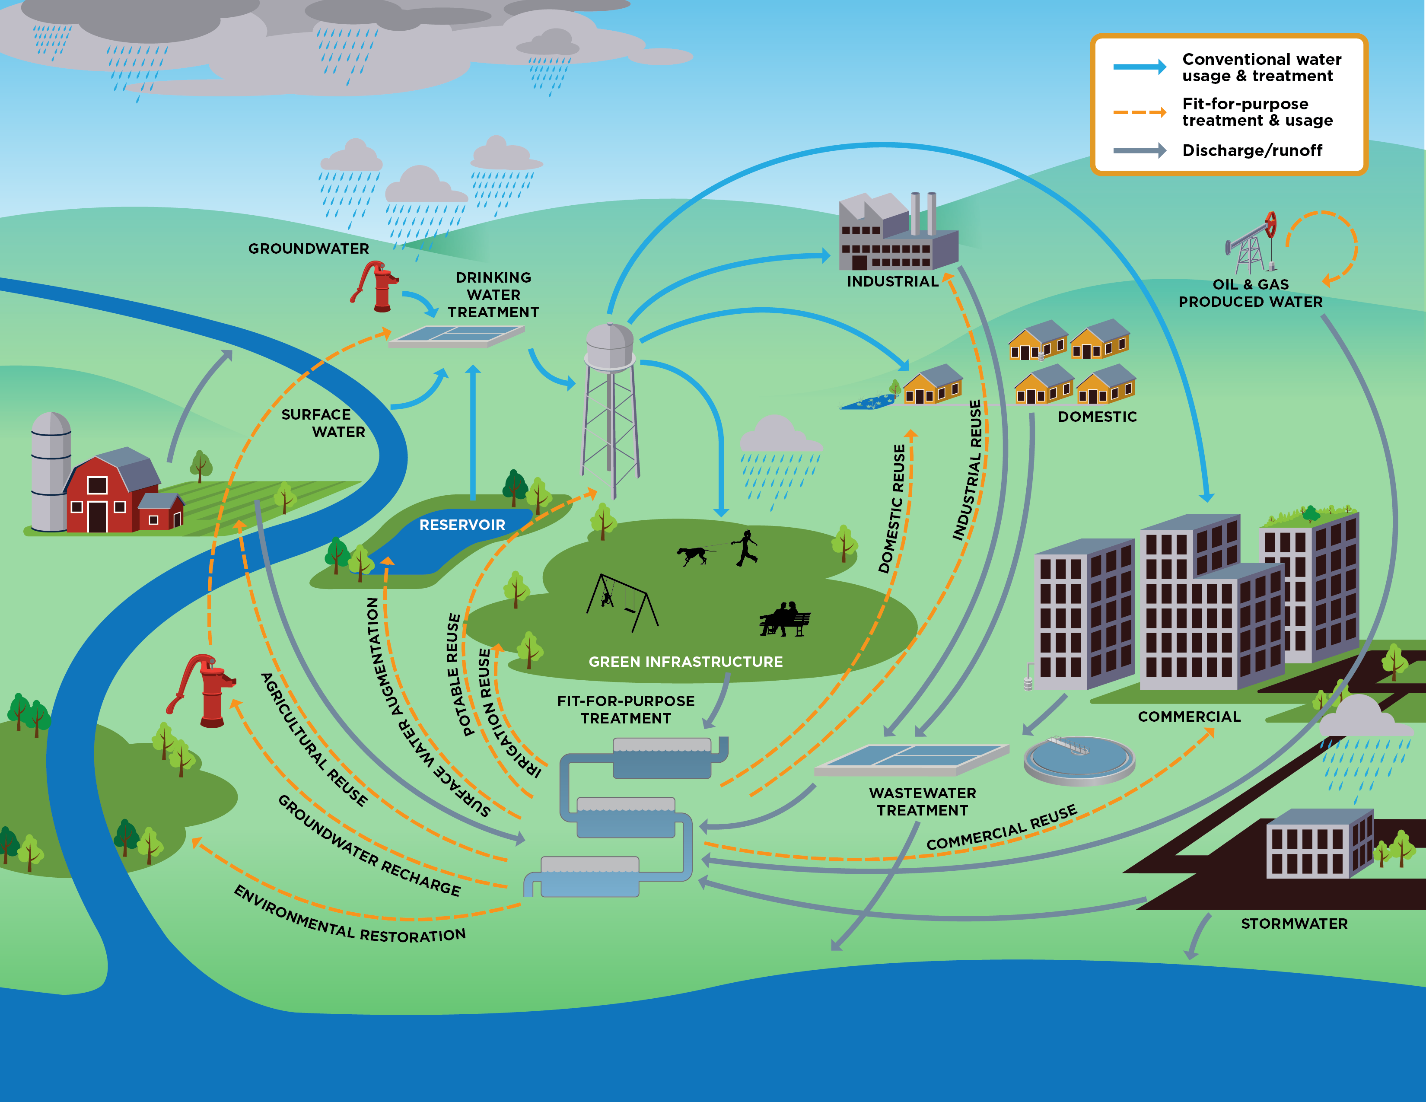
Figure \(\PageIndex{32}\): Flowchart of water reuse. Surface water, groundwater, and water from reservoirs undergoes drinking water treatment. From there, it serves commercial, industrial, and domestic purposes and supports green infrastructure. Used water is treated to the extent needed for its purpose (fit-for-purpose treatment). Fit-for-purpose treatment and usage include environmental restoration, ground water recharge, agricultural reuse, surface water augmentation, portable reuse, irrigation reuse, domestic reuse, industrial reuse, and commercial reuse. Discharge from industrial, domestic, and commercial buildings is processed through wastewater treatment. Image by EPA (public domain).
Water conservation refers to using less water and using it more efficiently. Around the home, conservation can involve both water-saving technologies and behavioral decisions. Examples of water-saving technologies include high-efficiency clothes washers and low-flow showers and toilets. Water-conserving behaviors include turning off the water while you brush your teeth, taking shorter showers and showers instead of baths, and fixing leaky faucets. A dishwasher uses less water than washing dishes by hand, particularly the dishwasher is only run when it is full. Similarly, running fewer, larger loads of laundry conserves water relative to more frequent, smaller loads. Choosing foods with a low water footprint (like eggs) over those with a high water footprint (like beef) can also conserve water.
Gardening offers several water-saving opportunities. If you live in a dry climate, consider growing only native, drought-tolerant vegetation, which requires little irrigation (figure \(\PageIndex{33}\)). When you do irrigate your garden, do so only as needed and early in the morning, when less water will be lost to evaporation. Drip systems assist in delivering only the needed amount of water in a way that minimizes evaporation. These strategies can also be applied at large scales in agriculture, which is extremely important considering the high agricultural demands on our water supply relative to municipal use. Water conservation strategies in agriculture include growing crops in areas where the natural rainfall can support them, more efficient irrigation systems such as drip systems, and no-till farming, which reduces evaporative losses by covering the soil.
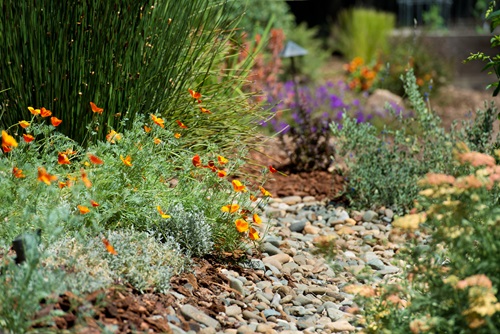
Figure \(\PageIndex{33}\): Using water-efficient plants and irrigation not only looks beautiful, but saves resources and supports biodiversity and natural pollinators. Image and caption from CA Department of Water Resources (public domain).
Another important technique is efficient irrigation, which is extremely important because irrigation accounts for a much larger water demand than public water supply. Water conservation strategies in agriculture include growing crops in areas where the natural rainfall can support them, more efficient irrigation systems such as drip systems that minimize losses due to evaporation, no-till farming that reduces evaporative losses by covering the soil, and reusing treated wastewater from sewage treatment plants. Recycled wastewater has also been used to recharge aquifers.
Bottled water is not a sustainable solution to the water crisis. Bottled water is not necessarily any safer than the U.S. public water supply, it costs on average about 700 times more than U.S. tap water, and every year it uses approximately 200 billion plastic and glass bottles that have a relatively low rate of recycling. Compared to tap water, it uses much more energy, mainly in bottle manufacturing and long-distance transportation. (Purchasing a water filter is a more sustainable solution than bottled water if you do not like the taste of tap water.)
Suggested Supplementary Reading:
Weiss, K.R. 2018. Drying Lakes. National Geographic. March. p. 108-133.
This article documents how many lakes across the globe are drying up, the reasons why, and the effect on humans. Overuse and a warming climate threaten lakes that provide sustenance and jobs for humans, while also providing critical habitat for animals.
References
Drinking Water. 2019. WHO. Accessed 2020-12-29.
Hand Hygeine for All. 2020. UNICEF. Accessed 2020-12-29.
Sanitation. 2019. WHO. Accessed 2020-12-29.
The Sustainable Development Goals Report. 2019. United Nations. Accessed 2020-12-29.
14. U.S. Geological Survey (2012) Snowmelt - The Water Cycle, from USGS Water-Science School
34. Freeze AR, Cherry JA (1979) Groundwater, 1 edition. Prentice Hall
Contributors and Attributions
Modified by Kyle Whittinghill and Melissa Ha from the following sources
- Water Cycle and Fresh Water Supply, Water Supply Problems and Solutions, and Biogeochemical Cycles from Environmental Biology by Matthew R. Fisher (licensed under CC-BY)
- The Water Cycle, Water Use and Distribution, and Groundwater from An Introduction to Geology by Chris Johnson et al. (licensed under CC-BY-NC-SA)
- Biogeochemical Cycles and the Flow of Energy in the Earth System and Water Cycle and Fresh Water Supply from Sustainability: A Comprehensive Foundation by Tom Theis and Jonathan Tomkin, Editors (licensed under CC-BY). Download for free at CNX.
- Biogeochemical Cycles from Biology 2e by OpenStax (CC-BY). Access for free at openstax.org.
- Essentials of Environmental Science by Kamala Doršner is licensed under CC BY 4.0.
- Basic Information about Water Reuse by United States Environmental Protection Agency (public domain)