
9.3: Anthropogenic Climate Change
- Page ID
- 69444

\( \newcommand{\vecs}[1]{\overset { \scriptstyle \rightharpoonup} {\mathbf{#1}} } \)
\( \newcommand{\vecd}[1]{\overset{-\!-\!\rightharpoonup}{\vphantom{a}\smash {#1}}} \)
\( \newcommand{\dsum}{\displaystyle\sum\limits} \)
\( \newcommand{\dint}{\displaystyle\int\limits} \)
\( \newcommand{\dlim}{\displaystyle\lim\limits} \)
\( \newcommand{\id}{\mathrm{id}}\) \( \newcommand{\Span}{\mathrm{span}}\)
( \newcommand{\kernel}{\mathrm{null}\,}\) \( \newcommand{\range}{\mathrm{range}\,}\)
\( \newcommand{\RealPart}{\mathrm{Re}}\) \( \newcommand{\ImaginaryPart}{\mathrm{Im}}\)
\( \newcommand{\Argument}{\mathrm{Arg}}\) \( \newcommand{\norm}[1]{\| #1 \|}\)
\( \newcommand{\inner}[2]{\langle #1, #2 \rangle}\)
\( \newcommand{\Span}{\mathrm{span}}\)
\( \newcommand{\id}{\mathrm{id}}\)
\( \newcommand{\Span}{\mathrm{span}}\)
\( \newcommand{\kernel}{\mathrm{null}\,}\)
\( \newcommand{\range}{\mathrm{range}\,}\)
\( \newcommand{\RealPart}{\mathrm{Re}}\)
\( \newcommand{\ImaginaryPart}{\mathrm{Im}}\)
\( \newcommand{\Argument}{\mathrm{Arg}}\)
\( \newcommand{\norm}[1]{\| #1 \|}\)
\( \newcommand{\inner}[2]{\langle #1, #2 \rangle}\)
\( \newcommand{\Span}{\mathrm{span}}\) \( \newcommand{\AA}{\unicode[.8,0]{x212B}}\)
\( \newcommand{\vectorA}[1]{\vec{#1}} % arrow\)
\( \newcommand{\vectorAt}[1]{\vec{\text{#1}}} % arrow\)
\( \newcommand{\vectorB}[1]{\overset { \scriptstyle \rightharpoonup} {\mathbf{#1}} } \)
\( \newcommand{\vectorC}[1]{\textbf{#1}} \)
\( \newcommand{\vectorD}[1]{\overrightarrow{#1}} \)
\( \newcommand{\vectorDt}[1]{\overrightarrow{\text{#1}}} \)
\( \newcommand{\vectE}[1]{\overset{-\!-\!\rightharpoonup}{\vphantom{a}\smash{\mathbf {#1}}}} \)
\( \newcommand{\vecs}[1]{\overset { \scriptstyle \rightharpoonup} {\mathbf{#1}} } \)
\(\newcommand{\longvect}{\overrightarrow}\)
\( \newcommand{\vecd}[1]{\overset{-\!-\!\rightharpoonup}{\vphantom{a}\smash {#1}}} \)
\(\newcommand{\avec}{\mathbf a}\) \(\newcommand{\bvec}{\mathbf b}\) \(\newcommand{\cvec}{\mathbf c}\) \(\newcommand{\dvec}{\mathbf d}\) \(\newcommand{\dtil}{\widetilde{\mathbf d}}\) \(\newcommand{\evec}{\mathbf e}\) \(\newcommand{\fvec}{\mathbf f}\) \(\newcommand{\nvec}{\mathbf n}\) \(\newcommand{\pvec}{\mathbf p}\) \(\newcommand{\qvec}{\mathbf q}\) \(\newcommand{\svec}{\mathbf s}\) \(\newcommand{\tvec}{\mathbf t}\) \(\newcommand{\uvec}{\mathbf u}\) \(\newcommand{\vvec}{\mathbf v}\) \(\newcommand{\wvec}{\mathbf w}\) \(\newcommand{\xvec}{\mathbf x}\) \(\newcommand{\yvec}{\mathbf y}\) \(\newcommand{\zvec}{\mathbf z}\) \(\newcommand{\rvec}{\mathbf r}\) \(\newcommand{\mvec}{\mathbf m}\) \(\newcommand{\zerovec}{\mathbf 0}\) \(\newcommand{\onevec}{\mathbf 1}\) \(\newcommand{\real}{\mathbb R}\) \(\newcommand{\twovec}[2]{\left[\begin{array}{r}#1 \\ #2 \end{array}\right]}\) \(\newcommand{\ctwovec}[2]{\left[\begin{array}{c}#1 \\ #2 \end{array}\right]}\) \(\newcommand{\threevec}[3]{\left[\begin{array}{r}#1 \\ #2 \\ #3 \end{array}\right]}\) \(\newcommand{\cthreevec}[3]{\left[\begin{array}{c}#1 \\ #2 \\ #3 \end{array}\right]}\) \(\newcommand{\fourvec}[4]{\left[\begin{array}{r}#1 \\ #2 \\ #3 \\ #4 \end{array}\right]}\) \(\newcommand{\cfourvec}[4]{\left[\begin{array}{c}#1 \\ #2 \\ #3 \\ #4 \end{array}\right]}\) \(\newcommand{\fivevec}[5]{\left[\begin{array}{r}#1 \\ #2 \\ #3 \\ #4 \\ #5 \\ \end{array}\right]}\) \(\newcommand{\cfivevec}[5]{\left[\begin{array}{c}#1 \\ #2 \\ #3 \\ #4 \\ #5 \\ \end{array}\right]}\) \(\newcommand{\mattwo}[4]{\left[\begin{array}{rr}#1 \amp #2 \\ #3 \amp #4 \\ \end{array}\right]}\) \(\newcommand{\laspan}[1]{\text{Span}\{#1\}}\) \(\newcommand{\bcal}{\cal B}\) \(\newcommand{\ccal}{\cal C}\) \(\newcommand{\scal}{\cal S}\) \(\newcommand{\wcal}{\cal W}\) \(\newcommand{\ecal}{\cal E}\) \(\newcommand{\coords}[2]{\left\{#1\right\}_{#2}}\) \(\newcommand{\gray}[1]{\color{gray}{#1}}\) \(\newcommand{\lgray}[1]{\color{lightgray}{#1}}\) \(\newcommand{\rank}{\operatorname{rank}}\) \(\newcommand{\row}{\text{Row}}\) \(\newcommand{\col}{\text{Col}}\) \(\renewcommand{\row}{\text{Row}}\) \(\newcommand{\nul}{\text{Nul}}\) \(\newcommand{\var}{\text{Var}}\) \(\newcommand{\corr}{\text{corr}}\) \(\newcommand{\len}[1]{\left|#1\right|}\) \(\newcommand{\bbar}{\overline{\bvec}}\) \(\newcommand{\bhat}{\widehat{\bvec}}\) \(\newcommand{\bperp}{\bvec^\perp}\) \(\newcommand{\xhat}{\widehat{\xvec}}\) \(\newcommand{\vhat}{\widehat{\vvec}}\) \(\newcommand{\uhat}{\widehat{\uvec}}\) \(\newcommand{\what}{\widehat{\wvec}}\) \(\newcommand{\Sighat}{\widehat{\Sigma}}\) \(\newcommand{\lt}{<}\) \(\newcommand{\gt}{>}\) \(\newcommand{\amp}{&}\) \(\definecolor{fillinmathshade}{gray}{0.9}\)When we talk about anthropogenic climate change, we are generally thinking of the industrial era, which really got going when we started using fossil fuels (coal to begin with) to drive machinery and trains. That was around the middle of the 18th century. The issue with fossil fuels is that they involve burning carbon that was naturally stored in the crust over hundreds of millions of years. Some climate scientists argue that anthropogenic climate change actually goes back much further than the industrial era, and that humans began to impact the climate by clearing land to grow grains in Europe and the Middle East around 8,000 years BCE and by creating wetlands to grow rice in Asia around 5,000 years BCE. Clearing forests for crops is a type of climate-forcing because the CO2 storage capacity of the crops is generally lower than that of the trees they replace, and creating wetlands is a type of climate forcing because the anaerobic bacterial decay of organic matter within wetlands produces CH4.
In fact, whether anthropogenic climate change started with the agricultural revolution or the industrial revolution is not important, because the really significant climate changes didn’t start until the early part of the 20th century, and although our activities are a major part of the problem, our increasing numbers are a big issue as well. Figure \(\PageIndex{1}\) shows the growth of the world population from around 5 million, when we first started growing crops, to about 18 million when wetland rice cultivation began, to over 800 million at the start of the industrial revolution, to over 7,700 million in 2019. A big part of the incredible growth in our population is related to the availability of the cheap and abundant energy embodied in fossil fuels, which we use for transportation, heating and cooling, industry, and food production.
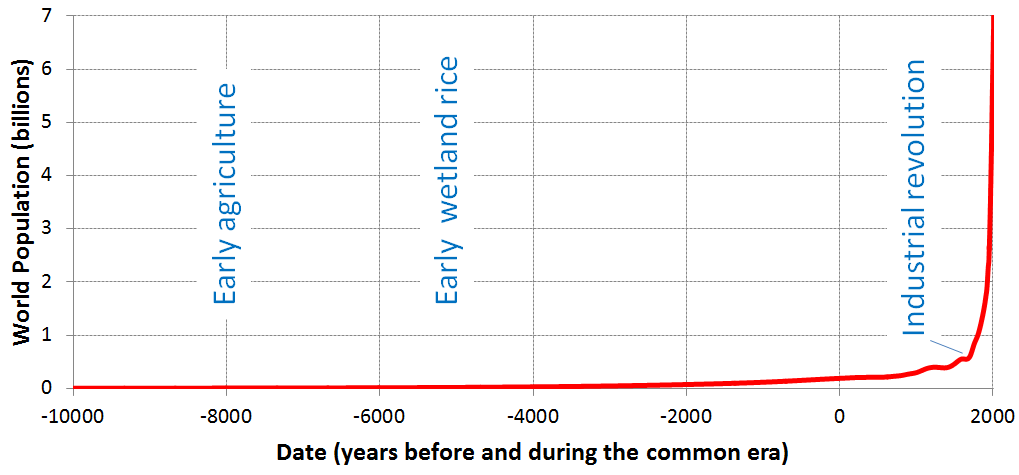
© Steven Earle. CC BY. Based on World Population Annual 12000 years data.
A rapidly rising population, the escalating level of industrialization and mechanization of our lives, and an increasing dependence on fossil fuels for transportation and energy generation have driven the anthropogenic climate change of the past century. The trend of mean global temperatures since 1880 is shown in Figure \(\PageIndex{2}\). For approximately the past 55 years, the temperature has increased at a relatively steady and rapid rate, especially compared to past changes. The average temperature now is approximately 1.0°C higher than before industrialization, and two-thirds of this warming has occurred since 1975.
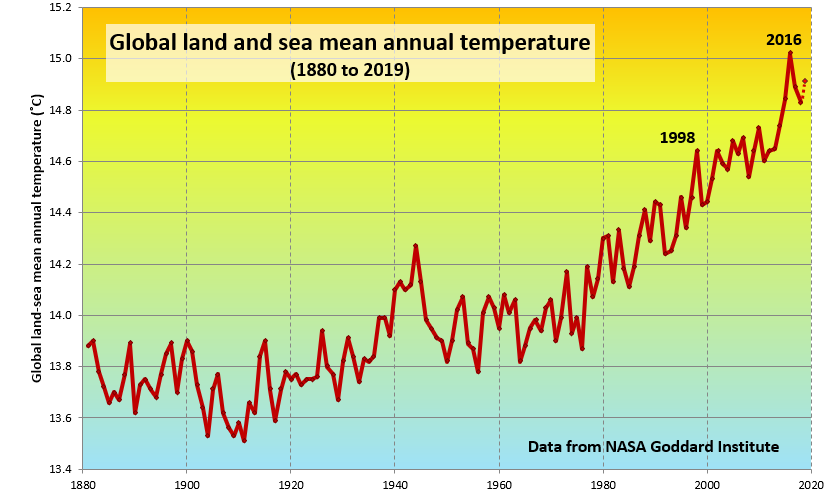
© Steven Earle. CC BY. Based on data from NASA.
Changes in land surface or ocean surface temperatures can be expressed as temperature anomalies. A temperature anomaly is the difference in average temperature measurement from a predetermined datum (or baseline). This datum is the average temperature of a particular date range, for example, 1951 to 1980. Another common datum is the last century (1900-2000). Therefore, an anomaly of 1.25 ℃ for 2015 (last century datum) means that the average temperature for 2015 was 1.25 ℃ greater than the 1900-2000 average. In 1950, the temperature anomaly was -0.28 ℃, so this is -0.28 ℃ lower than the 1900-2000 average [3]. These temperatures are annual average surface temperatures. Figure \(\PageIndex{3}\) shows the global mean temperature estimates for the period of 1880 to 2020 using the datum of the 1951-1980 average temperature.
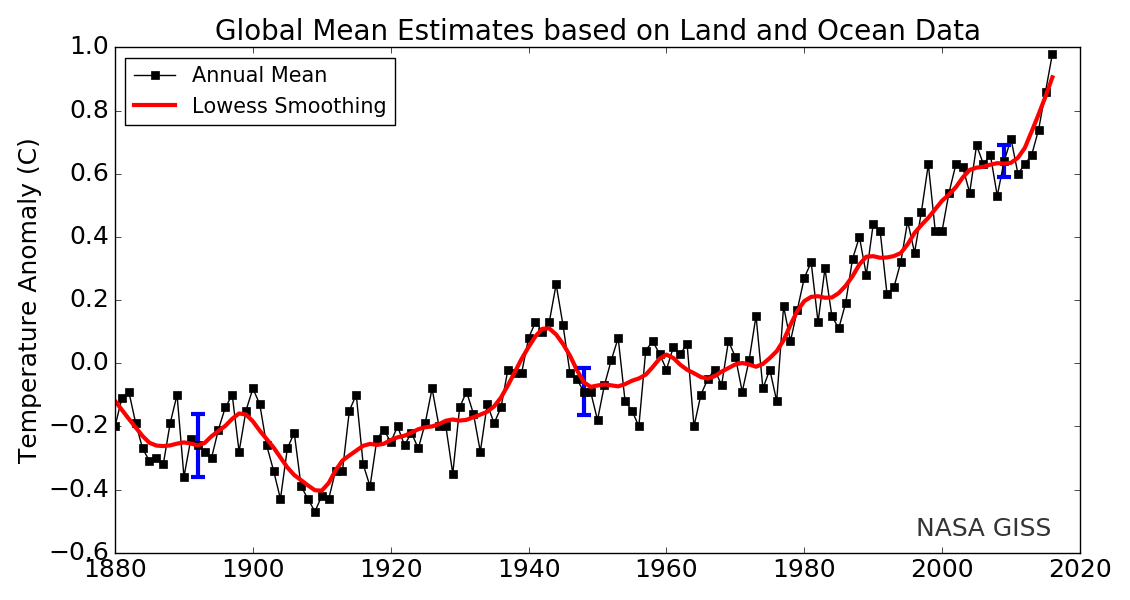
[From https://opengeology.org/textbook/15-...limate-change/ Adapted from Source: National Climate Data Center]
Since 1880, average global surface temperatures have trended upward and most of that warming has occurred since 1970 (see this NASA animation). Since the ocean is absorbing a lot of the additional trapped heat, surface temperatures include both land surface and ocean temperatures [13]. This video figure also shows worldwide temperature changes since 1880. The more blue, the cooler; the more yellow and red, the warmer.
Scientific Consensus: Global Climate Change is Real
The Intergovernmental Panel on Climate Change (IPCC)—established by the United Nations Environment Programme and the World Meteorological Organization in 1988—is responsible for reviewing the scientific literature on climate change and issuing periodic reports on several topics, including the scientific basis for understanding climate change, our vulnerability to observed and predicted climate changes, and what we can do to limit climate change and minimize its impacts. The IPCC uses this information to evaluate current impacts and future risks, in addition to providing policymakers with assessments. These assessments are released about once every every six years. The most recent report, the 5th Assessment, was released in 2013. Hundreds of leading scientists from around the world are chosen to author these reports. Over the history of the IPCC, these scientists have reviewed thousands of peer-reviewed, publicly available studies. The scientific consensus according to the last IPCC assessment is clear: global climate change is real and humans are very likely the cause for this change.
Additionally, the major scientific agencies of the United States, including the National Aeronautics and Space Administration (NASA) and the National Oceanic and Atmospheric Administration (NOAA), also agree that climate change is occurring and that humans are driving it. In 2010, the US National Research Council concluded that “Climate change is occurring, is very likely caused by human activities, and poses significant risks for a broad range of human and natural systems”. Many independent scientific organizations have released similar statements, both in the United States and abroad. This doesn’t necessarily mean that every scientist sees eye to eye on each component of the climate change problem, but broad agreement exists that climate change is happening and is primarily caused by excess greenhouse gases from human activities.
The historical record shows that the climation (NASA) and the National Oceanic and Atmospheric Administration (NOAA), also agree that climate change is occurring and that humans are driving it. In 2010, tate varies naturally over a wide range of time scales. In general, climate changes prior to the Industrial Revolution in the 1700s can be explained by natural causes, such as changes in solar energy, volcanic eruptions, and natural changes in greenhouse gas (GHG) concentrations. Recent changes in climate, however, cannot be explained by natural causes alone. Research indicates that natural causes are very unlikely to explain most observed warming, especially warming since the mid-20th century. Rather, human activities, especially our combustion of fossil fuels, explains the current warming (figure \(\PageIndex{4}\)). The scientific consensus is clear: through alterations of the carbon cycle, humans are changing the global climate by increasing the effects of something known as the greenhouse effect.
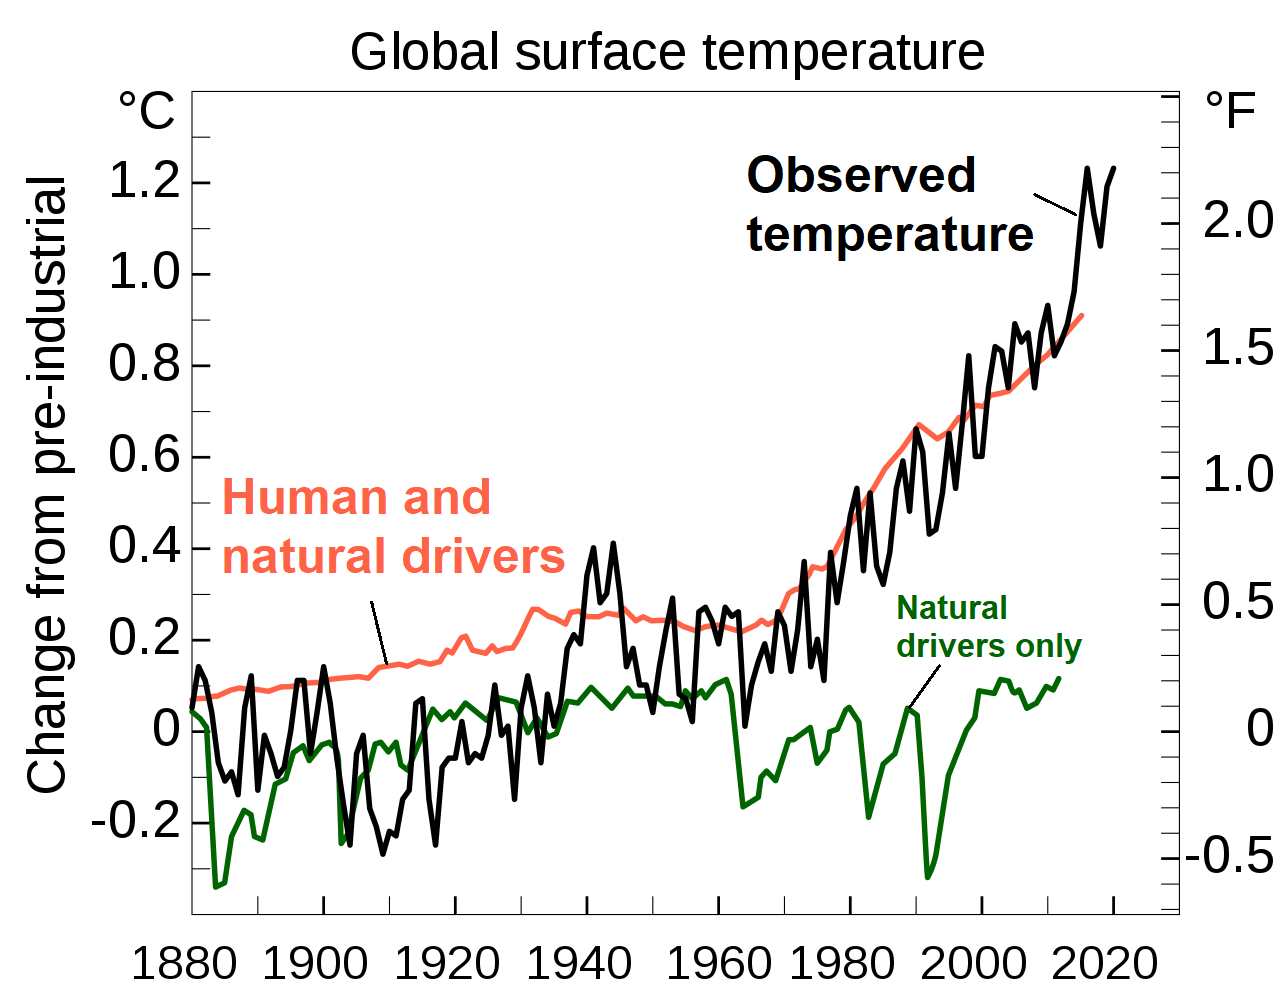
Figure \(\PageIndex{4}\): This graph shows the predicted temperatures from two climate models and observed temperatures from 1880 to 2020. The first model considered only natural factors that could influence temperature and is represented by the green line (bottom). It shows some fluctuations in temperature by no overall increase or decrease. The second model considered both human and natural factors and is represented by the orange line (top). It shows an overall increase in temperature. Actual observations (black, jagged line; middle) more closely match the second model. Overall, temperature has increased about 1.2 degrees Celsius (2.1 degrees Fahrenheit) since pre-industrial times. Image relabeled from Efbrazil (CC-BY-SA).
Human Impact on Greenhouse Gases
Recall that greenhouse gases are probably the most significant drivers of the climate. The greenhouse gases that affect Earth include carbon dioxide, methane, water vapor, nitrous oxide, and ozone. Approximately half of the radiation from the sun passes through these gases in the atmosphere and strikes the Earth. This radiation is converted into thermal radiation on the Earth’s surface, and then a portion of that energy is re-radiated back into the atmosphere as thermal energy. Greenhouse gases absorb much of the thermal energy near the Earth’s surface so the more greenhouse gases there are in the atmosphere, the more thermal energy is retained by the Earth.
Water vapor is the most abundant greenhouse gas and also the most important in terms of its contribution to the natural greenhouse effect, despite having a short atmospheric lifetime. Some human activities can influence local water vapor levels. However, on a global scale, the concentration of water vapor is controlled by temperature, which influences overall rates of evaporation and precipitation. Therefore, the global concentration of water vapor is not substantially affected by direct human emissions.
© Steven Earle. CC BY. Based on data in IPCC AR 5, 2014.
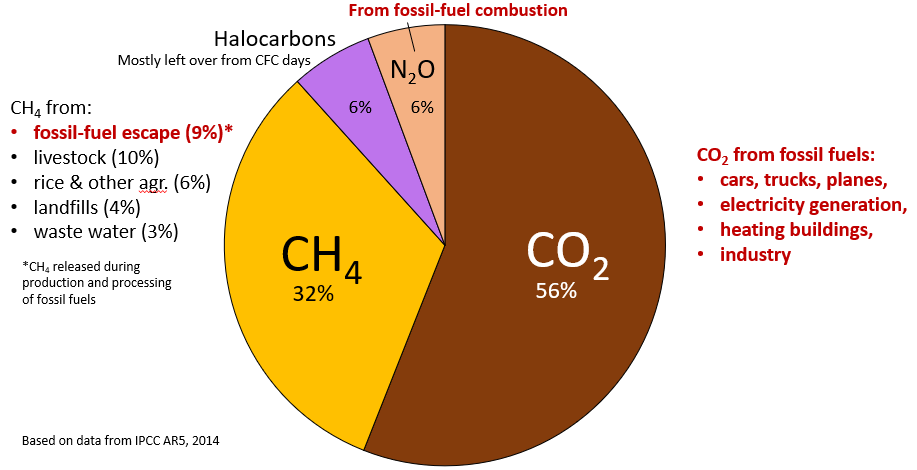
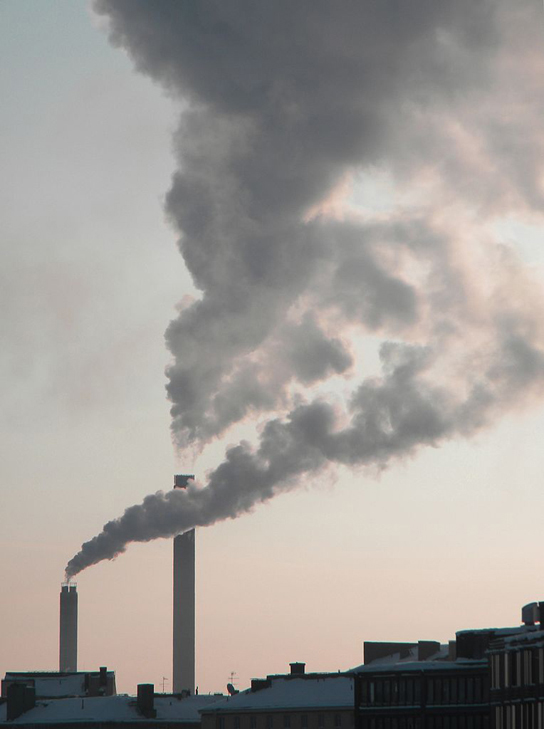
Figure \(\PageIndex{5}\), which is based on data from the fifth assessment report of the IPCC, issued in 2014, shows the relative contributions of various long-lasting anthropogenic GHGs to current climate forcing, based on the changes from levels that existed in 1750. Human activity releases carbon dioxide and methane, two of the most important greenhouse gases, into the atmosphere in several ways. The biggest anthropogenic contributor to warming is CO2, which accounts for 56% of positive forcing. The primary mechanism that releases carbon dioxide is the burning of fossil fuels, such as gasoline, coal, and natural gas (Figure \(\PageIndex{6}\)). CH4 accounts for 32%, and the halocarbon gases (mostly leaked from older air-conditioning appliances that still contain CFCs) and nitrous oxide (N2O) (from burning fossils fuels) account for 6% each. CO2 emissions come mostly from coal- and gas-fired power stations, motorized vehicles (cars, trucks, and aircraft), and industrial operations (e.g., smelting). CH4 emissions come from production of fossil fuels (escape from coal mining and from gas and oil production and processing), livestock farming (mostly beef), landfills, waste water, and wetland rice farming. N2O is derived almost entirely from the combustion of fossil fuels. In summary, most (by far) of our current GHG emissions come from fossil fuel production and use.
Carbon Dioxide
Carbon dioxide (CO2) is the primary greenhouse gas that is contributing to recent global climate change. CO2 is a natural component of the carbon cycle, involved in such activities as photosynthesis, respiration, volcanic eruptions, and ocean-atmosphere exchange. Human activities, primarily the burning of fossil fuels and changes in land use, release very large amounts of CO2 to the atmosphere, causing its concentration in the atmosphere to rise. Deforestation, cement manufacture, animal agriculture, the clearing of land, and the burning of forests are other human activities that release carbon dioxide.
Scientists look at patterns in data and try to explain differences or deviations from these patterns. The atmospheric carbon dioxide data reveal a historical pattern of carbon dioxide increasing and decreasing, cycling between a low of 180 ppm and a high of 300 ppm (Figure \(\PageIndex{4}\)). Scientists have concluded that it took around 50,000 years for the atmospheric carbon dioxide level to increase from its low minimum concentration to its higher maximum concentration.
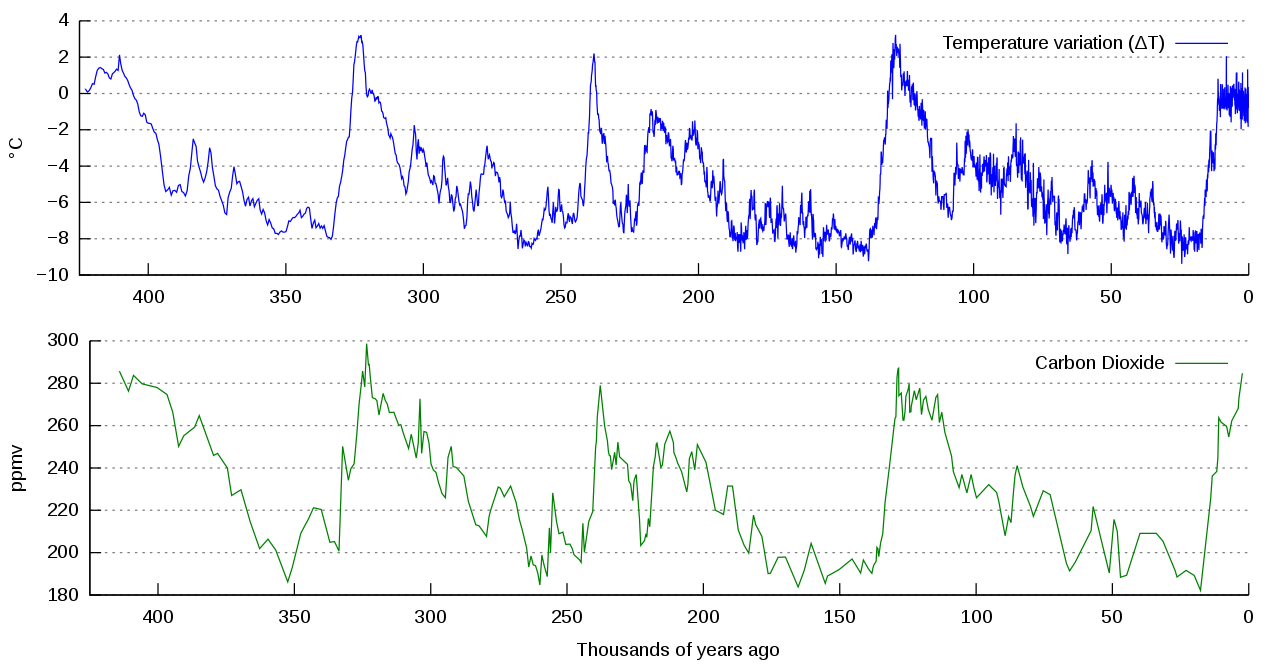
Figure \(\PageIndex{7}\): Graph of change in temperature in degrees Celsius (top, blue line) and carbon dioxide concentration in parts per million by volume (bottom, green line) measured from the Vostok, Antarctica ice core. These have been associated for over 400,000 years. As carbon dioxide concentration increased, so did temperature. As carbon dioxide concentration decreased, so did temperature. These data were collected in 1999. Since then, carbon dioxide concentrations have increased to 409.8 ppm (2019 average). Image and caption (modified) by NOAA/Autopilot (CC-BY-SA)
However, starting recently, atmospheric carbon dioxide concentrations have increased beyond the historical maximum of 300 ppm (figure \(\PageIndex{8-9}\)). Atmospheric CO2 concentrations have increased by 45% since pre-industrial times, from approximately 280 parts per million (ppm) in the 18th century to 409.8 ppm in 2019 (figure \(\PageIndex{8-9}\)).
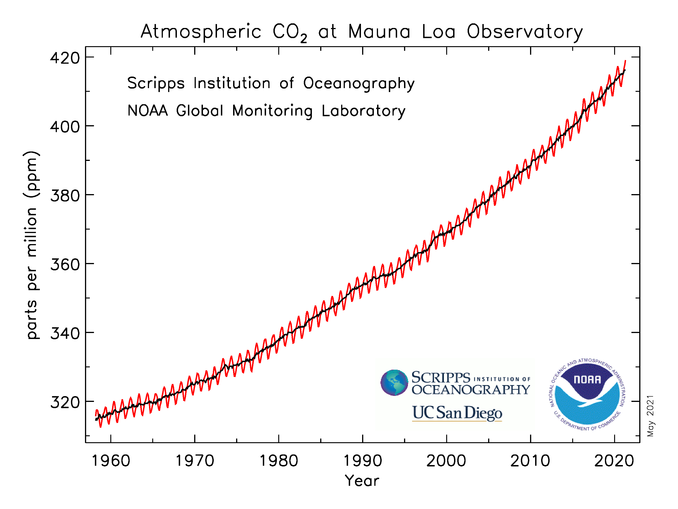
Figure \(\PageIndex{8}\): Monthly mean carbon dioxide concentration in parts per million (ppm) measured at Mauna Loa Observatory, Hawaii. The carbon dioxide data on Mauna Loa constitute the longest record of direct measurements of CO2 in the atmosphere. The fluctuating red line represents the monthly mean values, centered on the middle of each month. Carbon dioxide concentrations dip every summer due to increased photosynthesis. The smoother black line represents the same, after correction for the average seasonal cycle. Image and caption (modified) by NOAA (public domain).
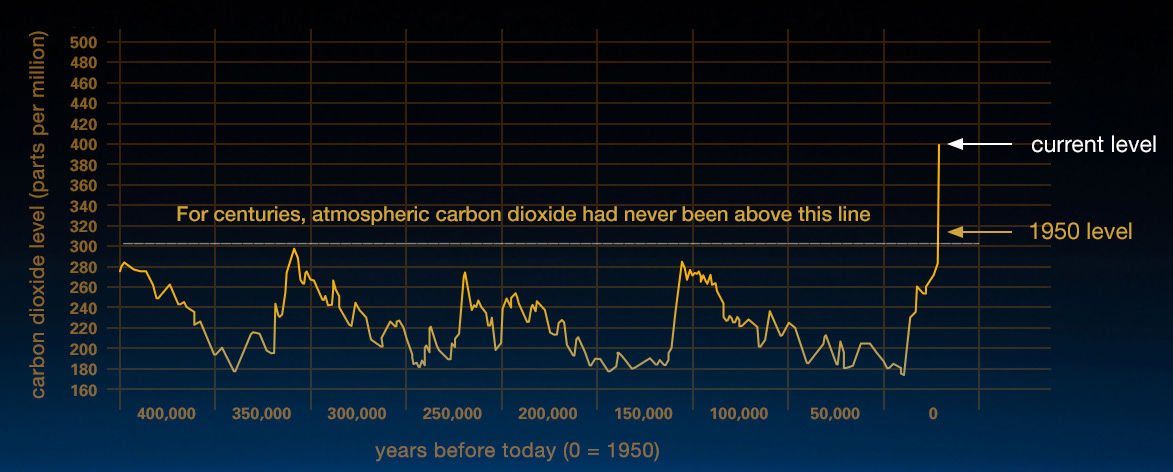
Figure \(\PageIndex{9}\): This graph, based on the comparison of atmospheric samples contained in ice cores and more recent direct measurements, provides evidence that atmospheric CO2 has increased since the Industrial Revolution. On the x-axis are the years before today (0 = 1950). It begins 400,000 years prior to 1950. On the y-axis is the carbon dioxide level in parts per million. Carbon dioxide levels have fluctuated over the years, but they never exceeded 300 parts per million until 1950. In 2018, carbon dioxide levels reached 409.8 ppm. (This graph is a few years old and shows the current CO2 level at 400 ppm; Credit: Vostok ice core data/J.R. Petit et al.; NOAA Mauna Loa CO2 record.)
The current CO2 level is higher than it has been in at least 800,000 years, based on evidence from ice cores that preserve ancient atmospheric gases. The current increases in atmospheric carbon dioxide have happened very quickly—in a matter of hundreds of years rather than thousands of years. What is the reason for this difference in the rate of change and the amount of increase in carbon dioxide? A key factor that must be recognized when comparing the historical data and the current data is the presence of modern human society; no other driver of climate change has yielded changes in atmospheric carbon dioxide levels at this rate or to this magnitude. Human activities currently release over 30 billion tons of CO2 into the atmosphere every year. While some volcanic eruptions released large quantities of CO2 in the distant past, the U.S. Geological Survey (USGS) reports that human activities now emit more than 135 times as much CO2 as volcanoes each year. This human-caused build-up of CO2 in the atmosphere is like a tub filling with water, where more water flows from the faucet than the drain can take away.
The following video shows how atmospheric CO2 has varied recently and also over the last 800,000 years as determined by many CO2 monitoring stations (shown on the insert map). It is also instructive to watch the CO2 variation of the Keeling portion of the video by latitude. This shows that most of the human sources of CO2 are in the Northern Hemisphere.
Methane
Although this concentration is far less than that of CO2, methane (CH4) is 28 times as potent a greenhouse gas. Methane is produced when bacteria break down organic matter under anaerobic conditions and can be released due to natural or anthropogenic processes. Anaerobic conditions can happen when organic matter is trapped underwater (such as in rice paddies) or in the intestines of herbivores. Anthropogenic causes now account for 60% of total methane release. Examples include agriculture, fossil fuel extraction and transport, mining, landfill use, and burning of forests. Methane can also be released from natural gas fields and the decomposition that occurs in landfills. Specifically, raising cattle releases methane due to fermentation in their rumens produces methane that is expelled from their GI tract. Methane is more abundant in Earth’s atmosphere now than at any time in at least the past 650,000 years, and CH4 concentrations increased sharply during most of the 20th century. They are now more than two and-a-half times pre-industrial levels (1.9 ppm), but the rate of increase has slowed considerably in recent decades.
Another source of methane is the melting of clathrates. Clathrates are frozen chunks of ice and methane found at the bottom of the ocean. When water warms, these chunks of ice melt and methane is released. As the ocean’s water temperature increases, the rate at which clathrates melt is increasing, releasing even more methane. This leads to increased levels of methane in the atmosphere, which further accelerates the rate of global warming. This is an example of the positive feedback loop that is leading to the rapid rate of increase of global temperatures.
Other Greenhouse Gases
Nitrous oxide (N2O) is produced through natural and human activities, mainly through agricultural activities and natural biological processes. Fuel burning and some other processes also create N2O. Concentrations of N2O have risen approximately 18% since the start of the Industrial Revolution, with a relatively rapid increase towards the end of the 20th century. [3] In contrast, the atmospheric concentration of N2O varied only slightly for a period of 11,500 years before the onset of the industrial period, as shown by ice core samples.
Ground-level ozone (O3), which also has a short atmospheric lifetime, is a potent greenhouse gas. Chemical reactions create ozone from emissions of nitrogen oxides and volatile organic compounds from automobiles, power plants, and other industrial and commercial sources in the presence of sunlight. In addition to trapping heat, ozone is a pollutant that can cause respiratory health problems and damage crops and ecosystems.
Chlorofluorocarbons (CFCs), hydrochlorofluorocarbons (HCFCs), hydrofluorocarbons (HFCs), perfluorocarbons (PFCs), and sulfur hexafluoride (SF6), together called F-gases, are often used in coolants, foaming agents, fire extinguishers, solvents, pesticides, and aerosol propellants. Unlike water vapor and ozone, these F-gases have a long atmospheric lifetime, and some of these emissions will affect the climate for many decades or centuries.
Human Induced Changes in Albedo
When sunlight energy reaches Earth it can be reflected or absorbed. The amount that is reflected or absorbed depends on Earth’s surface and atmosphere. Light-colored objects and surfaces, like snow and clouds, tend to reflect most sunlight, while darker objects and surfaces, like the ocean and forests, tend to absorb more sunlight. The term albedo refers to the amount of solar radiation reflected from an object or surface, often expressed as a percentage. Earth as a whole has an albedo of about 30%, meaning that 70% of the sunlight that reaches the planet is absorbed. Sunlight that is absorbed warms Earth’s land, water, and atmosphere.
Albedo is also affected by aerosols. Aerosols are small particles or liquid droplets in the atmosphere that can absorb or reflect sunlight. Unlike greenhouse gases (GHGs), the climate effects of aerosols vary depending on what they are made of and where they are emitted. Those aerosols that reflect sunlight, such as particles from volcanic eruptions or sulfur emissions from burning coal, have a cooling effect. Those that absorb sunlight, such as black carbon (a part of soot), have a warming effect. In addition, human activities have generally increased the number of aerosol particles in the atmosphere. Overall, human-generated aerosols have a net cooling effect offsetting about one-third of the total warming effect associated with human greenhouse gas emissions. Reductions in overall aerosol emissions can therefore lead to more warming. However, targeted reductions in black carbon emissions can reduce warming.
Human changes in land use and land cover have changed Earth’s albedo. Processes such as deforestation, reforestation, desertification, and urbanization often contribute to changes in climate in the places they occur. These effects may be significant regionally, but are smaller when averaged over the entire globe.
Climate Feedbacks
When sea ice melts, as it has done in the Arctic Ocean at a disturbing rate over the past decade, the albedo of the area affected changes dramatically, from around 80% down to less than 10%. This is a positive feedback because much more solar energy is absorbed by the water than by the pre-existing ice, and the temperature increase is amplified. The same applies to ice and snow on land, but the difference in albedo is not as great.
When ice and snow on land melt, sea level rises. (Sea level is also rising because the oceans are warming and that increases their volume.) A higher sea level means a larger proportion of the planet is covered with water, and since water has a lower albedo than land, more heat is absorbed and the temperature goes up a little more. Since the last glaciation, sea-level rise has been about 125 m; a huge area that used to be land is now flooded by heat-absorbent seawater. During the current period of anthropogenic climate change, sea level has risen only about 20 cm, and although that doesn’t make a big change to albedo, sea-level rise is accelerating.
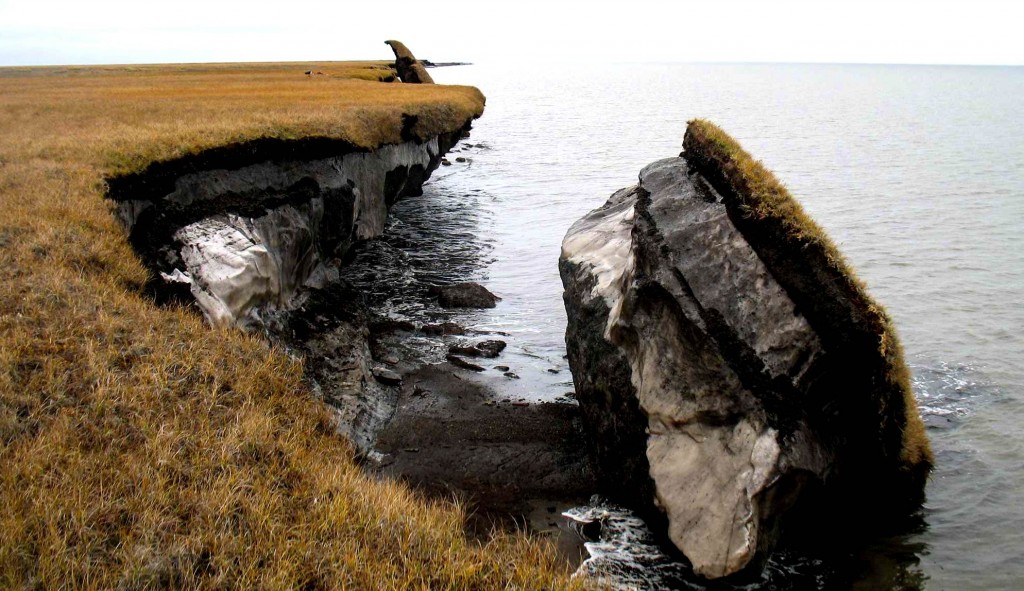
Most of northern Canada has a layer of permafrost that ranges from a few centimeters to hundreds of meters in thickness; the same applies in Alaska, Russia, and Scandinavia. Permafrost is a mixture of soil and ice (Figure \(\PageIndex{10}\)), and it also contains a significant amount of trapped organic carbon that is released as CO2 and CH4 when the permafrost breaks down. Because the amount of carbon stored in permafrost is in the same order of magnitude as the amount released by burning fossil fuels, this is a feedback mechanism that has the potential to equal or surpass the forcing that has unleashed it.
In some polar regions, including northern Canada, permafrost includes methane hydrate, a highly concentrated form of CH4 trapped in solid form. Breakdown of permafrost releases this CH4. Even larger reserves of methane hydrate exist on the sea floor, and while it would take significant warming of ocean water down to a depth of hundreds of meters, this too is likely to happen in the future if we don’t limit our impact on the climate. There is strong isotopic evidence that the Paleocene-Eocene thermal maximum was caused, at least in part, by a massive release of sea-floor methane hydrate.
There is about 45 times as much carbon in the ocean (as dissolved bicarbonate ions, HCO3−) as there is in the atmosphere (as CO2), and there is a steady exchange of carbon between the two reservoirs. But the solubility of CO2 in water decreases as the temperature goes up. In other words, the warmer it gets, the more of that oceanic bicarbonate gets transferred to the atmosphere as CO2. That makes CO2 solubility another positive feedback mechanism.
Vegetation growth responds positively to both increased temperatures and elevated CO2 levels, and so in general, it represents a negative feedback to climate change because the more the vegetation grows, the more CO2 is taken from the atmosphere. But it’s not quite that simple because when trees grow bigger and more vigorously, forests become darker (they have lower albedo) so they absorb more heat. Furthermore, climate warming isn’t necessarily good for vegetation growth; some areas have become too hot, too dry, or even too wet to support the plant community that was growing there, and it might take centuries for something to replace it successfully.
All of these positive (and negative) feedbacks work both ways. For example, during climate cooling, growth of glaciers leads to higher albedos, and formation of permafrost results in storage of carbon that would otherwise have returned quickly to the atmosphere.
Reference
7. Oreskes, N. The scientific consensus on climate change. Science 306, 1686–1686 (2004).
11. Earle, S. Physical geology OER textbook. (BC Campus OpenEd, 2015).
Further "Reading"
For more information, watch this six-minute video on climate change by two professors at a North Carolina State University.
Contributors and Attributions
Connie Rye (East Mississippi Community College), Robert Wise (University of Wisconsin, Oshkosh), Vladimir Jurukovski (Suffolk County Community College), Jean DeSaix (University of North Carolina at Chapel Hill), Jung Choi (Georgia Institute of Technology), Yael Avissar (Rhode Island College) among other contributing authors. Original content by OpenStax (CC BY 4.0; Download for free at http://cnx.org/contents/185cbf87-c72...f21b5eabd@9.87).
- Kyle Whittinghill (University of Pittsburgh)
- ”Physical Geology” by Steven Earle used under a CC-BY 4.0 international license. Download this book for free at http://open.bccampus.ca
- Contributed by Melissa Ha and Rachel Schleiger Faculty (Biological Sciences) at Yuba College & Butte College
- Contributed by Paul Webb Professor (Biology) at Rodger Williams University
- Contributed by Chris Johnson, Matthew D. Affolter, Paul Inkenbrandt, & Cam Mosher Faculty (Geology) at Salt Lake Community College
- Sourced from OpenGeology from An Introduction to Geology Chapter Chapter 15: Global Climate Change
- 12.4 Climate Change from Essentials of Environmental Science by CK-12 and Kamala Doršner (licensed under CC BY 4.0.)
- Climate and the Effects of Global Climate Change from General Biology by OpenStax (licensed under CC-BY)
- Climate Change from Environmental Biology by Matthew R. Fisher (licensed under CC-BY)
- Carbon Cycle from Biology by John W. Kimball (licensed under CC-BY)