

1.8: Cellular Respiration and Photosynthesis
- Page ID
- 222590
\( \newcommand{\vecs}[1]{\overset { \scriptstyle \rightharpoonup} {\mathbf{#1}} } \)
\( \newcommand{\vecd}[1]{\overset{-\!-\!\rightharpoonup}{\vphantom{a}\smash {#1}}} \)
\( \newcommand{\dsum}{\displaystyle\sum\limits} \)
\( \newcommand{\dint}{\displaystyle\int\limits} \)
\( \newcommand{\dlim}{\displaystyle\lim\limits} \)
\( \newcommand{\id}{\mathrm{id}}\) \( \newcommand{\Span}{\mathrm{span}}\)
( \newcommand{\kernel}{\mathrm{null}\,}\) \( \newcommand{\range}{\mathrm{range}\,}\)
\( \newcommand{\RealPart}{\mathrm{Re}}\) \( \newcommand{\ImaginaryPart}{\mathrm{Im}}\)
\( \newcommand{\Argument}{\mathrm{Arg}}\) \( \newcommand{\norm}[1]{\| #1 \|}\)
\( \newcommand{\inner}[2]{\langle #1, #2 \rangle}\)
\( \newcommand{\Span}{\mathrm{span}}\)
\( \newcommand{\id}{\mathrm{id}}\)
\( \newcommand{\Span}{\mathrm{span}}\)
\( \newcommand{\kernel}{\mathrm{null}\,}\)
\( \newcommand{\range}{\mathrm{range}\,}\)
\( \newcommand{\RealPart}{\mathrm{Re}}\)
\( \newcommand{\ImaginaryPart}{\mathrm{Im}}\)
\( \newcommand{\Argument}{\mathrm{Arg}}\)
\( \newcommand{\norm}[1]{\| #1 \|}\)
\( \newcommand{\inner}[2]{\langle #1, #2 \rangle}\)
\( \newcommand{\Span}{\mathrm{span}}\) \( \newcommand{\AA}{\unicode[.8,0]{x212B}}\)
\( \newcommand{\vectorA}[1]{\vec{#1}} % arrow\)
\( \newcommand{\vectorAt}[1]{\vec{\text{#1}}} % arrow\)
\( \newcommand{\vectorB}[1]{\overset { \scriptstyle \rightharpoonup} {\mathbf{#1}} } \)
\( \newcommand{\vectorC}[1]{\textbf{#1}} \)
\( \newcommand{\vectorD}[1]{\overrightarrow{#1}} \)
\( \newcommand{\vectorDt}[1]{\overrightarrow{\text{#1}}} \)
\( \newcommand{\vectE}[1]{\overset{-\!-\!\rightharpoonup}{\vphantom{a}\smash{\mathbf {#1}}}} \)
\( \newcommand{\vecs}[1]{\overset { \scriptstyle \rightharpoonup} {\mathbf{#1}} } \)
\(\newcommand{\longvect}{\overrightarrow}\)
\( \newcommand{\vecd}[1]{\overset{-\!-\!\rightharpoonup}{\vphantom{a}\smash {#1}}} \)
\(\newcommand{\ket}[1]{\left| #1 \right>}\)
\(\newcommand{\bra}[1]{\left< #1 \right|}\)
\(\newcommand{\braket}[2]{\left< #1 \vphantom{#2} \right| \left. #2 \vphantom{#1} \right>}\)
\(\newcommand{\braopket}[3]{\left< #1 \vphantom{#2}\vphantom{#3} \right| #2 \vphantom{#1}\vphantom{#3} \left| #3 \vphantom{#1}\vphantom{#2} \right>}\)
\(\newcommand{\qmvec}[1]{\mathbf{\vec{#1}}}\)
\(\newcommand{\op}[1]{\hat{\mathbf{#1}}}\)
\(\newcommand{\expect}[1]{\langle #1 \rangle}\)
\(\newcommand{\dfn}[1]{\emph{\textbf{#1}}}\)
Cellular Respiration
There are many ways to rebuild and recycle ATP, but not all methods are created equal nor are they free. Cells must bring in energy in order to rebuild ATP. They do this by bringing in and using the chemical energy stored in molecules such as glucose.
Cellular respiration is one process used to rebuild ATP by using the chemical energy stored in glucose. Glucose will go through a series of chemical reactions to move high energy electrons and hydrogen ions. Cellular respiration is aerobic, meaning the final electron acceptor is oxygen. This is why we rely on breathing in oxygen, as most of our ATP is produced by cellular respiration.
Cellular respiration is composed of three main stages: glycolysis, the citric acid cycle (or Krebs cycle), and the electron transport chain. Glycolysis occurs in the cytoplasm of the cell, while the citric acid cycle and electron transport chain both occur inside the mitochondria.

Figure 1: by Karen Marks, Reedley College is licensed under CC BY 4.0
For this activity, we will assess your ability to undergo cellular respiration. Remember that cellular respiration will use oxygen and produce carbon dioxide. Carbon dioxide forms an acid called carbonic acid when mixed with water. This acid can be easily detected with a pH indicator such as bromothymol blue. You will be performing an experiment to view how physical activity changes the rate of cellular respiration.
First let’s formulate a hypothesis. In the table below, rank each activity from fastest (1) to slowest (3) rate of respiration.
|
Activity |
Rank (1 = fastest, 3 = slowest) |
|---|---|
|
Rest |
|
|
Slow Walk |
|
|
Fast Walk |
For the following procedure, you and your lab partner will both complete the following procedure. You may want to have one participant go first, and then have the second participant go after.
Materials:
- 6 test tubes, labeled (3 per person)
- 1 transfer pipette
- Bromothymol blue (may substitute with phenol red)
- 2 drinking straws (1 per person, different colors)
Make sure you only use your own straw for this exercise to prevent the spread of germs. Do not inhale, aspirate, or drink the bromothymol blue.
Procedure:
- Label your test tubes according to the activities listed in Table 2
- Add 1 mL of bromothymol blue to each tube.
- Sit or stand still at your table for 30 seconds.
- Place the straw in your “Rest” tube and prepare a timer.
- Record how long it takes for the bromothymol blue to turn yellow while gently blowing into the straw.
- Walk for 30 seconds. (You may want to do this in the hallway.)
- Repeat steps 4-5 with your tube labeled “Slow Walk”.
- Walk outside, and walk at a faster than normal pace around the building.
- Repeat steps 4-5 with your tube labeled “Fast Walk”.
|
Name of Each Participant |
Time (s) | ||
| Rest | Slow Walk | Fast Walk | |
Now, let’s graph both your and your partner’s data in the graph below. Make a line graph using the data from Table 2. Make sure to color code yours and your partner’s data and label both the x and y axis.
Graph from Table 2
Title:_____________________
Was your hypothesis supported? If yes, how does your data support it? If not, justify your reasoning.
Fermentation and Substrate
Cellular respiration is not the only way to build ATP. Many organisms, such as eukaryotic yeast and many prokaryotes, use fermentation to produce ATP. As humans, we enjoy the benefits of this process and use it to make many food items like bread, kimchi, and beer.
Unlike cellular respiration, fermentation does not need oxygen as a final electron acceptor. Since oxygen is not required, fermentation is an anaerobic process. Instead of oxygen, fermentation uses organic molecules, such as acetaldehyde or pyruvate, as final electron acceptors. When pyruvate is used as the final electron acceptor, lactic acid is produced. When acetaldehyde is the final electron acceptor, ethanol is produced. Remember that regardless of the process, a fuel source, such as glucose, is required, otherwise the cell will not be able to use either cellular respiration or fermentation.

Figure 2. OpenStax, CC BY 4.0, via Wikimedia Commons
To measure fermentation, we will capture the \(\mathrm{CO}_2\) produced by yeast. We will place yeast in several environments with different substrates: some with varying levels of glucose, one with artificial sweetener, and one with only water. First, let’s develop a hypothesis for this exercise.
|
Yeast Environment |
Fermentation? (High/Low/No) |
|---|---|
|
Glucose |
|
|
Fructose |
|
|
Artificial Sweetener |
|
|
Water |
Materials:
- 4 large test tubes or jars, labeled
- 8g baker’s yeast
- Scale with weigh boat
- 4 small balloons
- Glucose
- Fructose
- Artificial Sweetener
- Distilled water
- String and ruler
Procedure:
- Label the tubes according to Table 4.
- Add 2g yeast to each tube.
- Add 1 g glucose to Tube 1.
- Add 1 g fructose to Tube 2.
- Add 1 g artificial sweetener to Tube 3.
- Add 100 mL water to tubes 1-4.
- Shake the tubes.
- Place a balloon over the top of each tube. Ensure it is secure.
- Measure the diameter of each balloon and record it in Table 5.4.
- Leave the tubes alone for 40 minutes, checking every 10 minutes.
- After 40 minutes, measure the diameter of each balloon.
|
Yeast Environment |
0 Minutes |
10 Minutes |
20 Minutes |
30 Minutes |
40 Minutes |
|---|---|---|---|---|---|
|
Glucose |
|||||
|
Fructose |
|||||
|
Artificial Sweetener |
|||||
|
Water |
Graph your data from the table above.
Graph from Table 4
Title:_____________________
What does it mean if the balloon inflated?
What gas do you think the bubbles are made of?
Which substrate had the highest rate of fermentation? How do you know?
The Process of Photosynthesis

Figure 3. At09kg, Wattcle, Nefronus At09kg: original Wattcle: vector graphics Nefronus: redoing the vector graphics, CC BY-SA 4.0, via Wikimedia Commons
Photosynthesis is composed of two main steps -- the light dependent and light independent reactions. The light dependent reaction is where energy from light is used to harvest electrons from water. Light is absorbed by chlorophyll in the form of photons. When chlorophyll absorbs a photon, one of its electrons gets knocked away. A water molecule is then split and one of its electrons replaces the one chlorophyll lost.
These electrons are then passed on to the light independent reaction. In the light independent reaction (also called the Calvin cycle), these electrons are used to “fix” carbon. Carbon dioxide is taken in through the leaves’ stomata and brought into the chloroplast. Then, an enzyme called RuBisCO strips oxygen away and fixes the carbon to another molecule called RuBP. After cycling through the Calvin cycle, a three-carbon molecule called G3P is formed, with RuBP being recycled to be used again later.

Figure 4. Daniel Mayer (mav) - original imageVector version by Yerpo, CC BY-SA 4.0, via Wikimedia Commons

For this exercise, we will observe the consumption of \(\mathrm{CO}_2\) from photosynthesis. Carbon dioxide (\(\mathrm{CO}_2\)) is taken in through the leaves of a plant to be used as a carbon source when building carbohydrates. We will use phenol red to detect the use of \(\mathrm{CO}_2\). Phenol red appears red when in the presence of a neutral and basic pH, but becomes yellow when the pH becomes acidic. \(\mathrm{CO}_2\) becomes carbonic acid when in water, making the liquid slightly acidic. Prior to class, your instructor has added \(\mathrm{CO}_2\) to your phenol red, giving it a yellow color. If \(\mathrm{CO}_2\) is used up, the solution will become less acidic, turning the solution red.
Materials:
- 2 test tubes with a test tube rack
- 1 sprig of Elodea
- Phenol Red (with \(\mathrm{CO}_2\) already added)
Procedure:
- Obtain 1 small branch of Elodea, approximately 2-3 cm long.
- Place 1 branch of Elodea in Tube 1.
- Add enough phenol red (now yellow from the added \(\mathrm{CO}_2\) ) to cover the Elodea in Tube 1.
- Add the same amount of phenol red to Tube 2. (This tube should only have phenol red.)
- Leave the test tubes in a sunny part of the room (such as a window sill) or outside in the sun for 45 minutes.
- After 45 minutes, record the color in the space below.
|
Tube |
Color Before |
Color After |
|---|---|---|
|
With Elodea |
||
|
Without Elodea |
The Chloroplast
In plants, the organelle responsible for photosynthesis is the chloroplast. Since chloroplasts are responsible for harvesting light for photosynthesis, they are capable of moving within the plant cell to effectively harvest light. When light is weak or low, chloroplasts will move towards the brightest area. When light is too intense or strong, chloroplasts will move away. This may seem counterintuitive, but very intense light can cause damage to the chloroplasts. For this activity we will observe this movement of chloroplasts -- called photorelocation -- in Elodea.
Materials:
- Fresh Elodea leaves
- Microscope slide and coverslip
- Dropper bottle of distilled water
- Compound light microscope
- Lamp

Procedure:
- Place one fresh Elodea leaf on a slide.
- Add 1 drop of distilled water to the leaf on the slide and cover with the coverslip.
- View the Elodea slide under the microscope using the high objective.
- After viewing the Elodea under normal conditions, shine the lamp on one side of the slide.
- Leave the lamp shining on one side of the slide for 10 minutes.
- After 10 minutes, view the Elodea slide again.
How were the chloroplasts dispersed in the Elodea cells before exposure to bright light?
How were the chloroplasts dispersed in the Elodea cells after exposure to bright light?
Draw the field of view before and after the exposure to bright light.


 Wet mount slides should NEVER go into the regular trash. Make sure to follow in-class disposal instructions for wet mount slides.
Pigments and Photosynthesis
Within the chloroplasts are photosynthetic pigments. These pigments, such as chlorophyll a and chlorophyll b, help capture light energy for the plant. However, these pigments cannot just capture any wavelength of light. Chlorophylls are limited in which light wavelengths they are able to absorb. Any wavelength of light they cannot absorb is reflected. This is why plants appear green, as green wavelengths (500-600 nm) are reflected, while blue wavelengths (425-500 nm) and red wavelengths (600-700 nm) are readily absorbed.
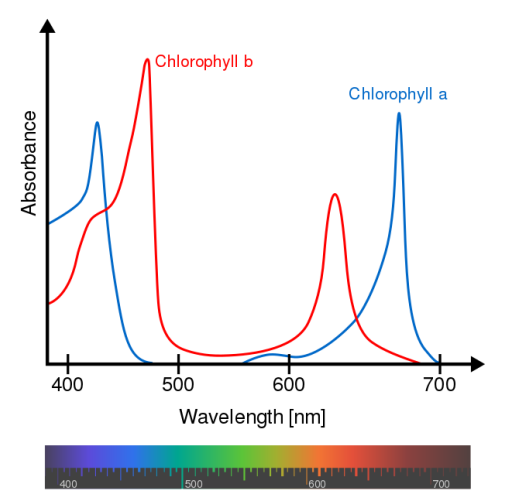
Figure 7. Chlorophyll_ab_spectra2.PNG: Daniele Pugliesi derivative work: M0tty, CC BY-SA 3.0, via Wikimedia Commons
Chlorophylls are not the only pigments found in plants, however. Other pigments such as carotenoids (which appear yellow and orange) and anthocyanins (which take on shades of red and blue) may also be found alongside the chlorophylls. For this final exercise, we will discover which pigments are found within a spinach leaf.
Hypothesis: Based on the above information, which pigment(s) do you think you will see in a spinach leaf?
Materials:
- 2-3 fresh spinach leaves
- A pencil, paperclip, and coin
- A 10 cm length of chromatography paper
- Chromatography solvent or acetone
- A small beaker
- A metric ruler
Procedure:
- Fold the chromatography paper in half lengthwise.
- Measure 2 cm away from one edge and draw a point or line at the 2 cm measurement.
- Place a spinach leaf on the point or line and use the coin to press the leaf into the paper.
- Continue pressing, using fresh parts of the leaves until a solid line of spinach extract has been pressed into the paper. (See example image below.)
- Obtain 10 mL of chromatography solvent (or acetone) from the instructor in the beaker.
- Place the chromatography paper in the beaker with the spinach end closest to the solvent and the other end facing up. (See example image below.)
- Use the paperclip to hold the paper to the beaker.
- Let sit for 45 minutes. Check periodically to ensure that the solvent does not fully evaporate. If the solvent runs low, obtain more from your instructor.
- After 45 minutes, record and draw your results.

Figure 8. by Karen Marks, Reedley College is licensed under CC BY 4.0
|
Pigment(s) Present (include color) |
|
|---|---|
|
Drawing of Chromatography Paper |

How do your results compare to your hypothesis?
Were there any pigments present that surprised you?
In the fall, leaves lose their green color and instead appear in shades of yellow, orange, and red. Based on your knowledge of plant pigments, which pigments disappeared from the leaves? Which ones are likely still present?
Additional Figures


Licensing and Attributions
- 5.3: Cellular Respiration is shared under a CC BY-NC-SA 4.0 license and was authored, remixed, and/or curated by Karen Marks and Valeria Hochman Adler.
- 5.4: Fermentation and Substrate is shared under a CC BY-NC-SA 4.0 license and was authored, remixed, and/or curated by Karen Marks and Valeria Hochman Adler.
- 6.2: The Process of Photosynthesis is shared under a CC BY-NC-SA 4.0 license and was authored, remixed, and/or curated by Karen Marks and Valeria Hochman Adler.
- 6.4: The Chloroplast is shared under a CC BY-NC-SA 4.0 license and was authored, remixed, and/or curated by Karen Marks and Valeria Hochman Adler.
- 6.5: Pigments and Photosynthesis is shared under a CC BY-NC-SA 4.0 license and was authored, remixed, and/or curated by Karen Marks and Valeria Hochman Adler.