
11.2: The Father of Genetics
- Page ID
- 35726
\( \newcommand{\vecs}[1]{\overset { \scriptstyle \rightharpoonup} {\mathbf{#1}} } \)
\( \newcommand{\vecd}[1]{\overset{-\!-\!\rightharpoonup}{\vphantom{a}\smash {#1}}} \)
\( \newcommand{\id}{\mathrm{id}}\) \( \newcommand{\Span}{\mathrm{span}}\)
( \newcommand{\kernel}{\mathrm{null}\,}\) \( \newcommand{\range}{\mathrm{range}\,}\)
\( \newcommand{\RealPart}{\mathrm{Re}}\) \( \newcommand{\ImaginaryPart}{\mathrm{Im}}\)
\( \newcommand{\Argument}{\mathrm{Arg}}\) \( \newcommand{\norm}[1]{\| #1 \|}\)
\( \newcommand{\inner}[2]{\langle #1, #2 \rangle}\)
\( \newcommand{\Span}{\mathrm{span}}\)
\( \newcommand{\id}{\mathrm{id}}\)
\( \newcommand{\Span}{\mathrm{span}}\)
\( \newcommand{\kernel}{\mathrm{null}\,}\)
\( \newcommand{\range}{\mathrm{range}\,}\)
\( \newcommand{\RealPart}{\mathrm{Re}}\)
\( \newcommand{\ImaginaryPart}{\mathrm{Im}}\)
\( \newcommand{\Argument}{\mathrm{Arg}}\)
\( \newcommand{\norm}[1]{\| #1 \|}\)
\( \newcommand{\inner}[2]{\langle #1, #2 \rangle}\)
\( \newcommand{\Span}{\mathrm{span}}\) \( \newcommand{\AA}{\unicode[.8,0]{x212B}}\)
\( \newcommand{\vectorA}[1]{\vec{#1}} % arrow\)
\( \newcommand{\vectorAt}[1]{\vec{\text{#1}}} % arrow\)
\( \newcommand{\vectorB}[1]{\overset { \scriptstyle \rightharpoonup} {\mathbf{#1}} } \)
\( \newcommand{\vectorC}[1]{\textbf{#1}} \)
\( \newcommand{\vectorD}[1]{\overrightarrow{#1}} \)
\( \newcommand{\vectorDt}[1]{\overrightarrow{\text{#1}}} \)
\( \newcommand{\vectE}[1]{\overset{-\!-\!\rightharpoonup}{\vphantom{a}\smash{\mathbf {#1}}}} \)
\( \newcommand{\vecs}[1]{\overset { \scriptstyle \rightharpoonup} {\mathbf{#1}} } \)
\( \newcommand{\vecd}[1]{\overset{-\!-\!\rightharpoonup}{\vphantom{a}\smash {#1}}} \)
\(\newcommand{\avec}{\mathbf a}\) \(\newcommand{\bvec}{\mathbf b}\) \(\newcommand{\cvec}{\mathbf c}\) \(\newcommand{\dvec}{\mathbf d}\) \(\newcommand{\dtil}{\widetilde{\mathbf d}}\) \(\newcommand{\evec}{\mathbf e}\) \(\newcommand{\fvec}{\mathbf f}\) \(\newcommand{\nvec}{\mathbf n}\) \(\newcommand{\pvec}{\mathbf p}\) \(\newcommand{\qvec}{\mathbf q}\) \(\newcommand{\svec}{\mathbf s}\) \(\newcommand{\tvec}{\mathbf t}\) \(\newcommand{\uvec}{\mathbf u}\) \(\newcommand{\vvec}{\mathbf v}\) \(\newcommand{\wvec}{\mathbf w}\) \(\newcommand{\xvec}{\mathbf x}\) \(\newcommand{\yvec}{\mathbf y}\) \(\newcommand{\zvec}{\mathbf z}\) \(\newcommand{\rvec}{\mathbf r}\) \(\newcommand{\mvec}{\mathbf m}\) \(\newcommand{\zerovec}{\mathbf 0}\) \(\newcommand{\onevec}{\mathbf 1}\) \(\newcommand{\real}{\mathbb R}\) \(\newcommand{\twovec}[2]{\left[\begin{array}{r}#1 \\ #2 \end{array}\right]}\) \(\newcommand{\ctwovec}[2]{\left[\begin{array}{c}#1 \\ #2 \end{array}\right]}\) \(\newcommand{\threevec}[3]{\left[\begin{array}{r}#1 \\ #2 \\ #3 \end{array}\right]}\) \(\newcommand{\cthreevec}[3]{\left[\begin{array}{c}#1 \\ #2 \\ #3 \end{array}\right]}\) \(\newcommand{\fourvec}[4]{\left[\begin{array}{r}#1 \\ #2 \\ #3 \\ #4 \end{array}\right]}\) \(\newcommand{\cfourvec}[4]{\left[\begin{array}{c}#1 \\ #2 \\ #3 \\ #4 \end{array}\right]}\) \(\newcommand{\fivevec}[5]{\left[\begin{array}{r}#1 \\ #2 \\ #3 \\ #4 \\ #5 \\ \end{array}\right]}\) \(\newcommand{\cfivevec}[5]{\left[\begin{array}{c}#1 \\ #2 \\ #3 \\ #4 \\ #5 \\ \end{array}\right]}\) \(\newcommand{\mattwo}[4]{\left[\begin{array}{rr}#1 \amp #2 \\ #3 \amp #4 \\ \end{array}\right]}\) \(\newcommand{\laspan}[1]{\text{Span}\{#1\}}\) \(\newcommand{\bcal}{\cal B}\) \(\newcommand{\ccal}{\cal C}\) \(\newcommand{\scal}{\cal S}\) \(\newcommand{\wcal}{\cal W}\) \(\newcommand{\ecal}{\cal E}\) \(\newcommand{\coords}[2]{\left\{#1\right\}_{#2}}\) \(\newcommand{\gray}[1]{\color{gray}{#1}}\) \(\newcommand{\lgray}[1]{\color{lightgray}{#1}}\) \(\newcommand{\rank}{\operatorname{rank}}\) \(\newcommand{\row}{\text{Row}}\) \(\newcommand{\col}{\text{Col}}\) \(\renewcommand{\row}{\text{Row}}\) \(\newcommand{\nul}{\text{Nul}}\) \(\newcommand{\var}{\text{Var}}\) \(\newcommand{\corr}{\text{corr}}\) \(\newcommand{\len}[1]{\left|#1\right|}\) \(\newcommand{\bbar}{\overline{\bvec}}\) \(\newcommand{\bhat}{\widehat{\bvec}}\) \(\newcommand{\bperp}{\bvec^\perp}\) \(\newcommand{\xhat}{\widehat{\xvec}}\) \(\newcommand{\vhat}{\widehat{\vvec}}\) \(\newcommand{\uhat}{\widehat{\uvec}}\) \(\newcommand{\what}{\widehat{\wvec}}\) \(\newcommand{\Sighat}{\widehat{\Sigma}}\) \(\newcommand{\lt}{<}\) \(\newcommand{\gt}{>}\) \(\newcommand{\amp}{&}\) \(\definecolor{fillinmathshade}{gray}{0.9}\)What you’ll learn to do: Identify the impact of Gregor Mendel on the field of genetics and apply Mendel’s two laws of genetics
Gregor Mendel is often referred to as the Father of Genetics. But just what did he do to earn this honorary title? Though farmers had known for centuries that crossbreeding of animals and plants could favor certain desirable traits, Mendel’s pea plant experiments conducted between 1856 and 1863 established many of the rules of heredity.
While Mendel never enjoyed recognition in his lifetime, in the decades following his life, scientists would verify his research and learn more about genes and the special substance called DNA that carried each living thing’s specific traits.
In this outcome we’ll examine the work he did and how his work still impacts genetics today.
- Describe Mendel’s study of garden peas and hereditary
- Understand how the inheritance of a genotype generates a phenotype
- Apply the law of segregation
- Apply the law of independent assortment
Mendel’s Experiments and Heredity

Genetics is the study of heredity. Johann Gregor Mendel set the framework for genetics long before chromosomes or genes had been identified, at a time when meiosis was not well understood. Mendel selected a simple biological system and conducted methodical, quantitative analyses using large sample sizes. Because of Mendel’s work, the fundamental principles of heredity were revealed. We now know that genes, carried on chromosomes, are the basic functional units of heredity with the capability to be replicated, expressed, or mutated. Today, the postulates put forth by Mendel form the basis of classical, or Mendelian, genetics. Not all genes are transmitted from parents to offspring according to Mendelian genetics, but Mendel’s experiments serve as an excellent starting point for thinking about inheritance.
Mendel’s Experiments and the Laws of Probability

Johann Gregor Mendel (1822–1884) (Figure 2) was a lifelong learner, teacher, scientist, and man of faith. As a young adult, he joined the Augustinian Abbey of St. Thomas in Brno in what is now the Czech Republic. Supported by the monastery, he taught physics, botany, and natural science courses at the secondary and university levels. In 1856, he began a decade-long research pursuit involving inheritance patterns in honeybees and plants, ultimately settling on pea plants as his primary model system (a system with convenient characteristics used to study a specific biological phenomenon to be applied to other systems). In 1865, Mendel presented the results of his experiments with nearly 30,000 pea plants to the local Natural History Society. He demonstrated that traits are transmitted faithfully from parents to offspring independently of other traits and in dominant and recessive patterns. In 1866, he published his work, Experiments in Plant Hybridization, in the proceedings of the Natural History Society of Brünn.
Mendel’s work went virtually unnoticed by the scientific community that believed, incorrectly, that the process of inheritance involved a blending of parental traits that produced an intermediate physical appearance in offspring; this hypothetical process appeared to be correct because of what we know now as continuous variation. Continuous variation results from the action of many genes to determine a characteristic like human height. Offspring appear to be a “blend” of their parents’ traits when we look at characteristics that exhibit continuous variation. The blending theory of inheritance asserted that the original parental traits were lost or absorbed by the blending in the offspring, but we now know that this is not the case. Mendel was the first researcher to see it. Instead of continuous characteristics, Mendel worked with traits that were inherited in distinct classes (specifically, violet versus white flowers); this is referred to as discontinuous variation. Mendel’s choice of these kinds of traits allowed him to see experimentally that the traits were not blended in the offspring, nor were they absorbed, but rather that they kept their distinctness and could be passed on. In 1868, Mendel became abbot of the monastery and exchanged his scientific pursuits for his pastoral duties. He was not recognized for his extraordinary scientific contributions during his lifetime. In fact, it was not until 1900 that his work was rediscovered, reproduced, and revitalized by scientists on the brink of discovering the chromosomal basis of heredity.
Mendel’s Model System
Mendel’s seminal work was accomplished using the garden pea, Pisum sativum, to study inheritance. This species naturally self-fertilizes, such that pollen encounters ova within individual flowers. The flower petals remain sealed tightly until after pollination, preventing pollination from other plants. The result is highly inbred, or “true-breeding,” pea plants. These are plants that always produce offspring that look like the parent. By experimenting with true-breeding pea plants, Mendel avoided the appearance of unexpected traits in offspring that might occur if the plants were not true breeding. The garden pea also grows to maturity within one season, meaning that several generations could be evaluated over a relatively short time. Finally, large quantities of garden peas could be cultivated simultaneously, allowing Mendel to conclude that his results did not come about simply by chance.
Mendelian Crosses
Mendel performed hybridizations, which involve mating two true-breeding individuals that have different traits. In the pea, which is naturally self-pollinating, this is done by manually transferring pollen from the anther of a mature pea plant of one variety to the stigma of a separate mature pea plant of the second variety. In plants, pollen carries the male gametes (sperm) to the stigma, a sticky organ that traps pollen and allows the sperm to move down the pistil to the female gametes (ova) below. To prevent the pea plant that was receiving pollen from self-fertilizing and confounding his results, Mendel painstakingly removed all of the anthers from the plant’s flowers before they had a chance to mature.
Plants used in first-generation crosses were called P0, or parental generation one, plants (Figure 3). Mendel collected the seeds belonging to the P0 plants that resulted from each cross and grew them the following season. These offspring were called the F1, or the first filial (filial = offspring, daughter or son), generation. Once Mendel examined the characteristics in the F1 generation of plants, he allowed them to self-fertilize naturally. He then collected and grew the seeds from the F1 plants to produce the F2, or second filial, generation. Mendel’s experiments extended beyond the F2 generation to the F3 and F4generations, and so on, but it was the ratio of characteristics in the P0−F1−F2 generations that were the most intriguing and became the basis for Mendel’s postulates.

Garden Pea Characteristics Revealed the Basics of Heredity
In his 1865 publication, Mendel reported the results of his crosses involving seven different characteristics, each with two contrasting traits. A trait is defined as a variation in the physical appearance of a heritable characteristic. The characteristics included plant height, seed texture, seed color, flower color, pea pod size, pea pod color, and flower position. For the characteristic of flower color, for example, the two contrasting traits were white versus violet. To fully examine each characteristic, Mendel generated large numbers of F1 and F2 plants, reporting results from 19,959 F2 plants alone. His findings were consistent.
What results did Mendel find in his crosses for flower color? First, Mendel confirmed that he had plants that bred true for white or violet flower color. Regardless of how many generations Mendel examined, all self-crossed offspring of parents with white flowers had white flowers, and all self-crossed offspring of parents with violet flowers had violet flowers. In addition, Mendel confirmed that, other than flower color, the pea plants were physically identical.
Once these validations were complete, Mendel applied the pollen from a plant with violet flowers to the stigma of a plant with white flowers. After gathering and sowing the seeds that resulted from this cross, Mendel found that 100 percent of the F1 hybrid generation had violet flowers. Conventional wisdom at that time would have predicted the hybrid flowers to be pale violet or for hybrid plants to have equal numbers of white and violet flowers. In other words, the contrasting parental traits were expected to blend in the offspring. Instead, Mendel’s results demonstrated that the white flower trait in the F1 generation had completely disappeared.
Importantly, Mendel did not stop his experimentation there. He allowed the F1 plants to self-fertilize and found that, of F2-generation plants, 705 had violet flowers and 224 had white flowers. This was a ratio of 3.15 violet flowers per one white flower, or approximately 3:1. When Mendel transferred pollen from a plant with violet flowers to the stigma of a plant with white flowers and vice versa, he obtained about the same ratio regardless of which parent, male or female, contributed which trait. This is called a reciprocal cross—a paired cross in which the respective traits of the male and female in one cross become the respective traits of the female and male in the other cross. For the other six characteristics Mendel examined, the F1 and F2 generations behaved in the same way as they had for flower color. One of the two traits would disappear completely from the F1 generation only to reappear in the F2 generation at a ratio of approximately 3:1 (Table 1).
| Table 1. The Results of Mendel’s Garden Pea Hybridizations | ||||
|---|---|---|---|---|
| Characteristic | Contrasting P0 Traits | F1 Offspring Traits | F2 Offspring Traits | F2 Trait Ratios |
| Flower color | Violet vs. white | 100 percent violet |
|
3.15:1 |
| Flower position | Axial vs. terminal | 100 percent axial |
|
3.14:1 |
| Plant height | Tall vs. dwarf | 100 percent tall |
|
2.84:1 |
| Seed texture | Round vs. wrinkled | 100 percent round |
|
2.96:1 |
| Seed color | Yellow vs. green | 100 percent yellow |
|
3.01:1 |
| Pea pod texture | Inflated vs. constricted | 100 percent inflated |
|
2.95:1 |
| Pea pod color | Green vs. yellow | 100 percent green |
|
2.82:1 |
Upon compiling his results for many thousands of plants, Mendel concluded that the characteristics could be divided into expressed and latent traits. He called these, respectively, dominant and recessive traits. Dominant traits are those that are inherited unchanged in a hybridization. Recessive traits become latent, or disappear, in the offspring of a hybridization. The recessive trait does, however, reappear in the progeny of the hybrid offspring. An example of a dominant trait is the violet-flower trait. For this same characteristic (flower color), white-colored flowers are a recessive trait. The fact that the recessive trait reappeared in the F2 generation meant that the traits remained separate (not blended) in the plants of the F1 generation. Mendel also proposed that plants possessed two copies of the trait for the flower-color characteristic, and that each parent transmitted one of its two copies to its offspring, where they came together. Moreover, the physical observation of a dominant trait could mean that the genetic composition of the organism included two dominant versions of the characteristic or that it included one dominant and one recessive version. Conversely, the observation of a recessive trait meant that the organism lacked any dominant versions of this characteristic.
Working with garden pea plants, Mendel found that crosses between parents that differed by one trait produced F1 offspring that all expressed the traits of one parent. Observable traits are referred to as dominant, and non-expressed traits are described as recessive. When the offspring in Mendel’s experiment were self-crossed, the F2 offspring exhibited the dominant trait or the recessive trait in a 3:1 ratio, confirming that the recessive trait had been transmitted faithfully from the original P0 parent. Reciprocal crosses generated identical F1 and F2 offspring ratios. By examining large sample sizes, Mendel showed that his crosses behaved reproducibly according to the laws of probability, and that the traits were inherited as independent events.
Characteristics and Traits
The seven characteristics that Mendel evaluated in his pea plants were each expressed as one of two versions, or traits. The physical expression of characteristics is accomplished through the expression of genes carried on chromosomes. The genetic makeup of peas consists of two similar or homologous copies of each chromosome, one from each parent. Each pair of homologous chromosomes has the same linear order of genes. In other words, peas are diploid organisms in that they have two copies of each chromosome. The same is true for many other plants and for virtually all animals. Diploid organisms utilize meiosis to produce haploid gametes, which contain one copy of each homologous chromosome that unite at fertilization to create a diploid zygote.
For cases in which a single gene controls a single characteristic, a diploid organism has two genetic copies that may or may not encode the same version of that characteristic. Gene variants that arise by mutation and exist at the same relative locations on homologous chromosomes are called alleles. Mendel examined the inheritance of genes with just two allele forms, but it is common to encounter more than two alleles for any given gene in a natural population.
Phenotypes and Genotypes
Two alleles for a given gene in a diploid organism are expressed and interact to produce physical characteristics. The observable traits expressed by an organism are referred to as its phenotype. An organism’s underlying genetic makeup, consisting of both physically visible and non-expressed alleles, is called its genotype. Mendel’s hybridization experiments demonstrate the difference between phenotype and genotype. When true-breeding plants in which one parent had yellow pods and one had green pods were cross-fertilized, all of the F1 hybrid offspring had yellow pods. That is, the hybrid offspring were phenotypically identical to the true-breeding parent with yellow pods. However, we know that the allele donated by the parent with green pods was not simply lost because it reappeared in some of the F2 offspring. Therefore, the F1 plants must have been genotypically different from the parent with yellow pods.
The P0 plants that Mendel used in his experiments were each homozygous for the trait he was studying: that is what made them ‘true breeding’. Diploid organisms that are homozygous at a given gene, or locus, have two identical alleles for that gene on their homologous chromosomes. Mendel’s parental pea plants always bred true because both of the gametes produced carried the same trait. When P0 plants with contrasting traits were cross-fertilized, all of the offspring were heterozygous for the contrasting trait, meaning that their genotype reflected that they had different alleles for the gene being examined.
Dominant and Recessive Alleles
Our discussion of homozygous and heterozygous organisms brings us to why the F1 heterozygous offspring were identical to one of the parents, rather than expressing both alleles. In all seven pea-plant characteristics, one of the two contrasting alleles was dominant, and the other was recessive. Mendel called the dominant allele the expressed unit factor; the recessive allele was referred to as the latent unit factor. We now know that these so-called unit factors are actually genes on homologous chromosome pairs. For a gene that is expressed in a dominant and recessive pattern, homozygous dominant and heterozygous organisms will look identical (that is, they will have different genotypes but the same phenotype). The recessive allele will only be observed in homozygous recessive individuals (Table 2).
| Table 2. Human Inheritance in Dominant and Recessive Patterns | |
|---|---|
| Dominant Traits | Recessive Traits |
| Achondroplasia | Albinism |
| Brachydactyly | Cystic fibrosis |
| Huntington’s disease | Duchenne muscular dystrophy |
| Marfan syndrome | Galactosemia |
| Neurofibromatosis | Phenylketonuria |
| Widow’s peak | Sickle-cell anemia |
| Wooly hair | Tay-Sachs disease |
Several conventions exist for referring to genes and alleles. For the purposes of this chapter, we will abbreviate genes using the first letter of the gene’s corresponding dominant trait. For example, violet is the dominant trait for a pea plant’s flower color, so the flower-color gene would be abbreviated as V (note that it is customary to italicize gene designations). Furthermore, we will use uppercase and lowercase letters to represent dominant and recessive alleles, respectively.
Therefore, we would refer to the genotype of a homozygous dominant pea plant with violet flowers as VV, a homozygous recessive pea plant with white flowers as vv, and a heterozygous pea plant with violet flowers as Vv.
The Punnett Square Approach for a Monohybrid Cross
When fertilization occurs between two true-breeding parents that differ in only one characteristic, the process is called a monohybrid cross, and the resulting offspring are monohybrids. Mendel performed seven monohybrid crosses involving contrasting traits for each characteristic. On the basis of his results in F1 and F2 generations, Mendel postulated that each parent in the monohybrid cross contributed one of two paired unit factors to each offspring, and every possible combination of unit factors was equally likely.
To demonstrate a monohybrid cross, consider the case of true-breeding pea plants with yellow versus green pea seeds. The dominant seed color is yellow; therefore, the parental genotypes were YY for the plants with yellow seeds and yy for the plants with green seeds, respectively. A Punnett square, devised by the British geneticist Reginald Punnett, can be drawn that applies the rules of probability to predict the possible outcomes of a genetic cross or mating and their expected frequencies. To prepare a Punnett square, all possible combinations of the parental alleles are listed along the top (for one parent) and side (for the other parent) of a grid, representing their meiotic segregation into haploid gametes. Then the combinations of egg and sperm are made in the boxes in the table to show which alleles are combining. Each box then represents the diploid genotype of a zygote, or fertilized egg, that could result from this mating. Because each possibility is equally likely, genotypic ratios can be determined from a Punnett square. If the pattern of inheritance (dominant or recessive) is known, the phenotypic ratios can be inferred as well. For a monohybrid cross of two true-breeding parents, each parent contributes one type of allele. In this case, only one genotype is possible. All offspring are Yy and have yellow seeds (Figure 4).

A self-cross of one of the Yy heterozygous offspring can be represented in a 2 × 2 Punnett square because each parent can donate one of two different alleles. Therefore, the offspring can potentially have one of four allele combinations: YY, Yy, yY, or yy (Figure 4). Notice that there are two ways to obtain the Yy genotype: a Y from the egg and a y from the sperm, or a y from the egg and a Y from the sperm. Both of these possibilities must be counted. Recall that Mendel’s pea-plant characteristics behaved in the same way in reciprocal crosses. Therefore, the two possible heterozygous combinations produce offspring that are genotypically and phenotypically identical despite their dominant and recessive alleles deriving from different parents. They are grouped together. Because fertilization is a random event, we expect each combination to be equally likely and for the offspring to exhibit a ratio of YY:Yy:yy genotypes of 1:2:1 (Figure 4). Furthermore, because the YY and Yy offspring have yellow seeds and are phenotypically identical, applying the sum rule of probability, we expect the offspring to exhibit a phenotypic ratio of 3 yellow:1 green. Indeed, working with large sample sizes, Mendel observed approximately this ratio in every F2 generation resulting from crosses for individual traits.
Mendel validated these results by performing an F3 cross in which he self-crossed the dominant- and recessive-expressing F2 plants. When he self-crossed the plants expressing green seeds, all of the offspring had green seeds, confirming that all green seeds had homozygous genotypes of yy. When he self-crossed the F2 plants expressing yellow seeds, he found that one-third of the plants bred true, and two-thirds of the plants segregated at a 3:1 ratio of yellow:green seeds. In this case, the true-breeding plants had homozygous (YY) genotypes, whereas the segregating plants corresponded to the heterozygous (Yy) genotype. When these plants self-fertilized, the outcome was just like the F1 self-fertilizing cross.
The Test Cross Distinguishes the Dominant Phenotype
Beyond predicting the offspring of a cross between known homozygous or heterozygous parents, Mendel also developed a way to determine whether an organism that expressed a dominant trait was a heterozygote or a homozygote. Called the test cross, this technique is still used by plant and animal breeders. In a test cross, the dominant-expressing organism is crossed with an organism that is homozygous recessive for the same characteristic. If the dominant-expressing organism is a homozygote, then all F1 offspring will be heterozygotes expressing the dominant trait (Figure 5). Alternatively, if the dominant expressing organism is a heterozygote, the F1 offspring will exhibit a 1:1 ratio of heterozygotes and recessive homozygotes (Figure 5). The test cross further validates Mendel’s postulate that pairs of unit factors segregate equally.

In pea plants, round peas (R) are dominant to wrinkled peas (r). You do a test cross between a pea plant with wrinkled peas (genotype rr) and a plant of unknown genotype that has round peas. You end up with three plants, all which have round peas. From this data, can you tell if the round pea parent plant is homozygous dominant or heterozygous? If the round pea parent plant is heterozygous, what is the probability that a random sample of 3 progeny peas will all be round?
- Show Answer
-
You cannot be sure if the plant is homozygous or heterozygous as the data set is too small: by random chance, all three plants might have acquired only the dominant gene even if the recessive one is present. If the round pea parent is heterozygous, there is a one-eighth probability that a random sample of three progeny peas will all be round.
Many human diseases are genetically inherited. A healthy person in a family in which some members suffer from a recessive genetic disorder may want to know if he or she has the disease-causing gene and what risk exists of passing the disorder on to his or her offspring. Of course, doing a test cross in humans is unethical and impractical. Instead, geneticists use pedigree analysis to study the inheritance pattern of human genetic diseases (Figure 6).

Alkaptonuria is a recessive genetic disorder in which two amino acids, phenylalanine and tyrosine, are not properly metabolized. Affected individuals may have darkened skin and brown urine, and may suffer joint damage and other complications. In this pedigree, individuals with the disorder are indicated in blue and have the genotype aa. Unaffected individuals are indicated in yellow and have the genotype AA or Aa. Note that it is often possible to determine a person’s genotype from the genotype of their offspring. For example, if neither parent has the disorder but their child does, they must be heterozygous. Two individuals on the pedigree have an unaffected phenotype but unknown genotype. Because they do not have the disorder, they must have at least one normal allele, so their genotype gets the “A?” designation.
What are the genotypes of the individuals labeled 1, 2 and 3?
- Show Answer
-
Individual 1 has the genotype aa. Individual 2 has the genotype Aa. Individual 3 has the genotype Aa.
When true-breeding or homozygous individuals that differ for a certain trait are crossed, all of the offspring will be heterozygotes for that trait. If the traits are inherited as dominant and recessive, the F1 offspring will all exhibit the same phenotype as the parent homozygous for the dominant trait. If these heterozygous offspring are self-crossed, the resulting F2 offspring will be equally likely to inherit gametes carrying the dominant or recessive trait, giving rise to offspring of which one quarter are homozygous dominant, half are heterozygous, and one quarter are homozygous recessive. Because homozygous dominant and heterozygous individuals are phenotypically identical, the observed traits in the F2 offspring will exhibit a ratio of three dominant to one recessive.
Laws of Inheritance
Mendel generalized the results of his pea-plant experiments into four postulates, some of which are sometimes called “laws,” that describe the basis of dominant and recessive inheritance in diploid organisms. As you will learn, more complex extensions of Mendelism exist that do not exhibit the same F2 phenotypic ratios (3:1). Nevertheless, these laws summarize the basics of classical genetics.
Pairs of Unit Factors, or Genes
Mendel proposed first that paired unit factors of heredity were transmitted faithfully from generation to generation by the dissociation and reassociation of paired factors during gametogenesis and fertilization, respectively. After he crossed peas with contrasting traits and found that the recessive trait resurfaced in the F2 generation, Mendel deduced that hereditary factors must be inherited as discrete units. This finding contradicted the belief at that time that parental traits were blended in the offspring.
Alleles Can Be Dominant or Recessive

Mendel’s law of dominance states that in a heterozygote, one trait will conceal the presence of another trait for the same characteristic. Rather than both alleles contributing to a phenotype, the dominant allele will be expressed exclusively. The recessive allele will remain “latent” but will be transmitted to offspring by the same manner in which the dominant allele is transmitted. The recessive trait will only be expressed by offspring that have two copies of this allele (Figure 7), and these offspring will breed true when self-crossed.
Since Mendel’s experiments with pea plants, other researchers have found that the law of dominance does not always hold true. Instead, several different patterns of inheritance have been found to exist, which we will explore this later in the module.
Equal Segregation of Alleles
Observing that true-breeding pea plants with contrasting traits gave rise to F1 generations that all expressed the dominant trait and F2 generations that expressed the dominant and recessive traits in a 3:1 ratio, Mendel proposed the law of segregation. This law states that paired unit factors (genes) must segregate equally into gametes such that offspring have an equal likelihood of inheriting either factor. For the F2 generation of a monohybrid cross, the following three possible combinations of genotypes could result: homozygous dominant, heterozygous, or homozygous recessive. Because heterozygotes could arise from two different pathways (receiving one dominant and one recessive allele from either parent), and because heterozygotes and homozygous dominant individuals are phenotypically identical, the law supports Mendel’s observed 3:1 phenotypic ratio. The equal segregation of alleles is the reason we can apply the Punnett square to accurately predict the offspring of parents with known genotypes. The physical basis of Mendel’s law of segregation is the first division of meiosis, in which the homologous chromosomes with their different versions of each gene are segregated into daughter nuclei. The role of the meiotic segregation of chromosomes in sexual reproduction was not understood by the scientific community during Mendel’s lifetime.
Independent Assortment
Mendel’s law of independent assortment states that genes do not influence each other with regard to the sorting of alleles into gametes, and every possible combination of alleles for every gene is equally likely to occur. The independent assortment of genes can be illustrated by the dihybrid cross, a cross between two true-breeding parents that express different traits for two characteristics. Consider the characteristics of seed color and seed texture for two pea plants, one that has green, wrinkled seeds (yyrr) and another that has yellow, round seeds (YYRR). Because each parent is homozygous, the law of segregation indicates that the gametes for the green/wrinkled plant all are yr, and the gametes for the yellow/round plant are all YR. Therefore, the F1 generation of offspring all areYyRr (Figure 8).

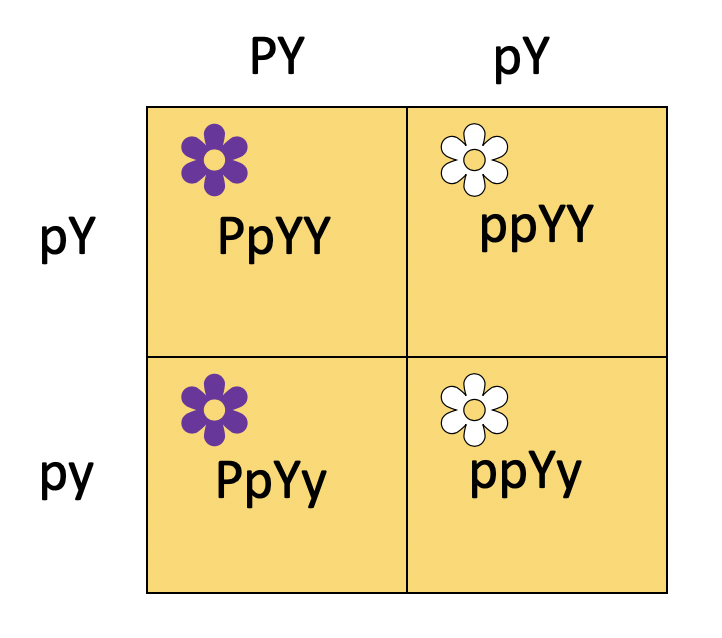
In pea plants, violet flowers (P) are dominant to white flowers (p) and yellow peas (Y) are dominant to green peas (y). What are the possible genotypes and phenotypes for a cross between PpYY and ppYy pea plants? How many squares do you need to do a Punnett square analysis of this cross?
- Show Answer
-
The possible genotypes are PpYY, PpYy, ppYY, and ppYy. The former two genotypes would result in plants with violet flowers and yellow peas, while the latter two genotypes would result in plants with white flowers with yellow peas, for a 1:1 ratio of each phenotype. You only need a 2 × 2 Punnett square (four squares total) to do this analysis because two of the alleles are homozygous.
For the F2 generation, the law of segregation requires that each gamete receive either an R allele or an r allele along with either a Y allele or a y allele. The law of independent assortment states that a gamete into which an r allele sorted would be equally likely to contain either a Y allele or a y allele. Thus, there are four equally likely gametes that can be formed when the YyRr heterozygote is self-crossed, as follows: YR, Yr, yR, and yr. Arranging these gametes along the top and left of a 4 × 4 Punnett square (Figure 8) gives us 16 equally likely genotypic combinations. From these genotypes, we infer a phenotypic ratio of 9 round/yellow:3 round/green:3 wrinkled/yellow:1 wrinkled/green (Figure 8). These are the offspring ratios we would expect, assuming we performed the crosses with a large enough sample size.
The law of independent assortment also indicates that a cross between yellow, wrinkled (YYrr) and green, round (yyRR) parents would yield the same F1 and F2 offspring as in the YYRR x yyrr cross.
The physical basis for the law of independent assortment also lies in meiosis I, in which the different homologous pairs line up in random orientations. Each gamete can contain any combination of paternal and maternal chromosomes (and therefore the genes on them) because the orientation of tetrads on the metaphase plane is random.
In pea plants, violet flowers (P) are dominant to white flowers (p) and yellow peas (Y) are dominant to green peas (y). What are the possible genotypes and phenotypes for a cross between PpYY and ppYy pea plants? How many squares do you need to do a Punnett square analysis of this cross? The possible genotypes are PpYY, PpYy, ppYY, and ppYy. The former two genotypes would result in plants with violet flowers and yellow peas, while the latter two genotypes would result in plants with white flowers with yellow peas, for a 1:1 ratio of each phenotype. You only need a 2 × 2 Punnett square (four squares total) to do this analysis because two of the alleles are homozygous.
Linked Genes Violate the Law of Independent Assortment
Although all of Mendel’s pea characteristics behaved according to the law of independent assortment, we now know that some allele combinations are not inherited independently of each other. Genes that are located on separate non-homologous chromosomes will always sort independently. However, each chromosome contains hundreds or thousands of genes, organized linearly on chromosomes like beads on a string. The segregation of alleles into gametes can be influenced by linkage, in which genes that are located physically close to each other on the same chromosome are more likely to be inherited as a pair. However, because of the process of recombination, or “crossover,” it is possible for two genes on the same chromosome to behave independently, or as if they are not linked. To understand this, let’s consider the biological basis of gene linkage and recombination.

Homologous chromosomes possess the same genes in the same linear order. The alleles may differ on homologous chromosome pairs, but the genes to which they correspond do not. In preparation for the first division of meiosis, homologous chromosomes replicate and synapse. Like genes on the homologs align with each other. At this stage, segments of homologous chromosomes exchange linear segments of genetic material (Figure 9). This process is called recombination, or crossover, and it is a common genetic process. Because the genes are aligned during recombination, the gene order is not altered. Instead, the result of recombination is that maternal and paternal alleles are combined onto the same chromosome. Across a given chromosome, several recombination events may occur, causing extensive shuffling of alleles.
When two genes are located in close proximity on the same chromosome, they are considered linked, and their alleles tend to be transmitted through meiosis together. To exemplify this, imagine a dihybrid cross involving flower color and plant height in which the genes are next to each other on the chromosome. If one homologous chromosome has alleles for tall plants and red flowers, and the other chromosome has genes for short plants and yellow flowers, then when the gametes are formed, the tall and red alleles will go together into a gamete and the short and yellow alleles will go into other gametes. These are called the parental genotypes because they have been inherited intact from the parents of the individual producing gametes. But unlike if the genes were on different chromosomes, there will be no gametes with tall and yellow alleles and no gametes with short and red alleles. If you create the Punnett square with these gametes, you will see that the classical Mendelian prediction of a 9:3:3:1 outcome of a dihybrid cross would not apply.
As the distance between two genes increases, the probability of one or more crossovers between them increases, and the genes behave more like they are on separate chromosomes. Geneticists have used the proportion of recombinant gametes (the ones not like the parents) as a measure of how far apart genes are on a chromosome. Using this information, they have constructed elaborate maps of genes on chromosomes for well-studied organisms, including humans.
To better appreciate the amount of labor and ingenuity that went into Mendel’s experiments, proceed through one of Mendel’s dihybrid crosses.
Question: What will be the offspring of a dihybrid cross?
Background: Consider that pea plants mature in one growing season, and you have access to a large garden in which you can cultivate thousands of pea plants. There are several true-breeding plants with the following pairs of traits: tall plants with inflated pods, and dwarf plants with constricted pods. Before the plants have matured, you remove the pollen-producing organs from the tall/inflated plants in your crosses to prevent self-fertilization. Upon plant maturation, the plants are manually crossed by transferring pollen from the dwarf/constricted plants to the stigmata of the tall/inflated plants.
Hypothesis: Both trait pairs will sort independently according to Mendelian laws. When the true-breeding parents are crossed, all of the F1 offspring are tall and have inflated pods, which indicates that the tall and inflated traits are dominant over the dwarf and constricted traits, respectively. A self-cross of the F1 heterozygotes results in 2,000 F2 progeny.
Test the hypothesis: Because each trait pair sorts independently, the ratios of tall:dwarf and inflated:constricted are each expected to be 3:1. The tall/dwarf trait pair is called T/t, and the inflated/constricted trait pair is designated I/i. Each member of the F1 generation therefore has a genotype of TtIi. Construct a grid analogous to Figure 10, in which you cross two TtIi individuals. Each individual can donate four combinations of two traits: TI, Ti, tI, or ti, meaning that there are 16 possibilities of offspring genotypes. Because the T and I alleles are dominant, any individual having one or two of those alleles will express the tall or inflated phenotypes, respectively, regardless if they also have a t or i allele. Only individuals that are tt or ii will express the dwarf and constricted alleles, respectively. As shown in Figure 10, you predict that you will observe the following offspring proportions: tall/inflated : tall/constricted : dwarf/inflated : dwarf/constricted in a 9:3:3:1 ratio. Notice from the grid that when considering the tall/dwarf and inflated/constricted trait pairs in isolation, they are each inherited in 3:1 ratios.
Table 3 shows all possible combinations of offspring resulting from a dihybrid cross of pea plants that are heterozygous for the tall/dwarf and inflated/constricted alleles.
| Table 3. Dihybrid Cross | |||||
|---|---|---|---|---|---|
| TtIi | |||||
| TI | Ti | tI | ti | ||
| TtIi | TI | TTII | TTIi | TtII | TtIi |
| Ti | TTIi | TTii | TtIi | Ttii | |
| tI | TtII | TtIi | ttII | ttIi | |
| ti | TtIi | Ttii | ttIi | ttii | |
Test the hypothesis: You cross the dwarf and tall plants and then self-cross the offspring. For best results, this is repeated with hundreds or even thousands of pea plants. What special precautions should be taken in the crosses and in growing the plants?
Analyze your data: You observe the following plant phenotypes in the F2 generation: 2706 tall/inflated, 930 tall/constricted, 888 dwarf/inflated, and 300 dwarf/constricted. Reduce these findings to a ratio and determine if they are consistent with Mendelian laws.
Form a conclusion: Were the results close to the expected 9:3:3:1 phenotypic ratio? Do the results support the prediction? What might be observed if far fewer plants were used, given that alleles segregate randomly into gametes? Try to imagine growing that many pea plants, and consider the potential for experimental error. For instance, what would happen if it was extremely windy one day?
Mendel postulated that genes (characteristics) are inherited as pairs of alleles (traits) that behave in a dominant and recessive pattern. Alleles segregate into gametes such that each gamete is equally likely to receive either one of the two alleles present in a diploid individual. In addition, genes are assorted into gametes independently of one another. That is, alleles are generally not more likely to segregate into a gamete with a particular allele of another gene. A dihybrid cross demonstrates independent assortment when the genes in question are on different chromosomes or distant from each other on the same chromosome. For crosses involving more than two genes, use the forked line or probability methods to predict offspring genotypes and phenotypes rather than a Punnett square.
Although chromosomes sort independently into gametes during meiosis, Mendel’s law of independent assortment refers to genes, not chromosomes, and a single chromosome may carry more than 1,000 genes. When genes are located in close proximity on the same chromosome, their alleles tend to be inherited together. This results in offspring ratios that violate Mendel’s law of independent assortment. However, recombination serves to exchange genetic material on homologous chromosomes such that maternal and paternal alleles may be recombined on the same chromosome. This is why alleles on a given chromosome are not always inherited together. Recombination is a random event occurring anywhere on a chromosome. Therefore, genes that are far apart on the same chromosome are likely to still assort independently because of recombination events that occurred in the intervening chromosomal space.
Heredity
Watch this video for a nice summary of Mendel’s contribution to the field of genetics and how a genotype leads to a phenotype.
Check Your Understanding
Answer the question(s) below to see how well you understand the topics covered in the previous section. This short quiz does not count toward your grade in the class, and you can retake it an unlimited number of times.
Use this quiz to check your understanding and decide whether to (1) study the previous section further or (2) move on to the next section.
Contributors and Attributions
- Introduction to the Father of Genetics. Authored by: Shelli Carter and Lumen Learning. Provided by: Lumen Learning. License: CC BY: Attribution
- Biology. Provided by: OpenStax CNX. Located at: http://cnx.org/contents/185cbf87-c72e-48f5-b51e-f14f21b5eabd@10.8. License: CC BY: Attribution. License Terms: Download for free at http://cnx.org/contents/185cbf87-c72...f21b5eabd@10.8
- Heredity: Crash Course Biology #9. Authored by: CrashCourse. Located at: https://youtu.be/CBezq1fFUEA. License: All Rights Reserved. License Terms: Standard YouTube License
- Gregor Mendel: The Father of Modern Genetics. Provided by: National Institutes of Health. Located at: https://history.nih.gov/exhibits/nirenberg/hs1_mendel.htm. Project: Deciphering the Genetic Code. License: Public Domain: No Known Copyright