
8: Activity 2-4 - Verification of Protein Purification via Polyacrylamide Gel Electrophoresis
- Page ID
- 158553
\( \newcommand{\vecs}[1]{\overset { \scriptstyle \rightharpoonup} {\mathbf{#1}} } \)
\( \newcommand{\vecd}[1]{\overset{-\!-\!\rightharpoonup}{\vphantom{a}\smash {#1}}} \)
\( \newcommand{\dsum}{\displaystyle\sum\limits} \)
\( \newcommand{\dint}{\displaystyle\int\limits} \)
\( \newcommand{\dlim}{\displaystyle\lim\limits} \)
\( \newcommand{\id}{\mathrm{id}}\) \( \newcommand{\Span}{\mathrm{span}}\)
( \newcommand{\kernel}{\mathrm{null}\,}\) \( \newcommand{\range}{\mathrm{range}\,}\)
\( \newcommand{\RealPart}{\mathrm{Re}}\) \( \newcommand{\ImaginaryPart}{\mathrm{Im}}\)
\( \newcommand{\Argument}{\mathrm{Arg}}\) \( \newcommand{\norm}[1]{\| #1 \|}\)
\( \newcommand{\inner}[2]{\langle #1, #2 \rangle}\)
\( \newcommand{\Span}{\mathrm{span}}\)
\( \newcommand{\id}{\mathrm{id}}\)
\( \newcommand{\Span}{\mathrm{span}}\)
\( \newcommand{\kernel}{\mathrm{null}\,}\)
\( \newcommand{\range}{\mathrm{range}\,}\)
\( \newcommand{\RealPart}{\mathrm{Re}}\)
\( \newcommand{\ImaginaryPart}{\mathrm{Im}}\)
\( \newcommand{\Argument}{\mathrm{Arg}}\)
\( \newcommand{\norm}[1]{\| #1 \|}\)
\( \newcommand{\inner}[2]{\langle #1, #2 \rangle}\)
\( \newcommand{\Span}{\mathrm{span}}\) \( \newcommand{\AA}{\unicode[.8,0]{x212B}}\)
\( \newcommand{\vectorA}[1]{\vec{#1}} % arrow\)
\( \newcommand{\vectorAt}[1]{\vec{\text{#1}}} % arrow\)
\( \newcommand{\vectorB}[1]{\overset { \scriptstyle \rightharpoonup} {\mathbf{#1}} } \)
\( \newcommand{\vectorC}[1]{\textbf{#1}} \)
\( \newcommand{\vectorD}[1]{\overrightarrow{#1}} \)
\( \newcommand{\vectorDt}[1]{\overrightarrow{\text{#1}}} \)
\( \newcommand{\vectE}[1]{\overset{-\!-\!\rightharpoonup}{\vphantom{a}\smash{\mathbf {#1}}}} \)
\( \newcommand{\vecs}[1]{\overset { \scriptstyle \rightharpoonup} {\mathbf{#1}} } \)
\(\newcommand{\longvect}{\overrightarrow}\)
\( \newcommand{\vecd}[1]{\overset{-\!-\!\rightharpoonup}{\vphantom{a}\smash {#1}}} \)
\(\newcommand{\avec}{\mathbf a}\) \(\newcommand{\bvec}{\mathbf b}\) \(\newcommand{\cvec}{\mathbf c}\) \(\newcommand{\dvec}{\mathbf d}\) \(\newcommand{\dtil}{\widetilde{\mathbf d}}\) \(\newcommand{\evec}{\mathbf e}\) \(\newcommand{\fvec}{\mathbf f}\) \(\newcommand{\nvec}{\mathbf n}\) \(\newcommand{\pvec}{\mathbf p}\) \(\newcommand{\qvec}{\mathbf q}\) \(\newcommand{\svec}{\mathbf s}\) \(\newcommand{\tvec}{\mathbf t}\) \(\newcommand{\uvec}{\mathbf u}\) \(\newcommand{\vvec}{\mathbf v}\) \(\newcommand{\wvec}{\mathbf w}\) \(\newcommand{\xvec}{\mathbf x}\) \(\newcommand{\yvec}{\mathbf y}\) \(\newcommand{\zvec}{\mathbf z}\) \(\newcommand{\rvec}{\mathbf r}\) \(\newcommand{\mvec}{\mathbf m}\) \(\newcommand{\zerovec}{\mathbf 0}\) \(\newcommand{\onevec}{\mathbf 1}\) \(\newcommand{\real}{\mathbb R}\) \(\newcommand{\twovec}[2]{\left[\begin{array}{r}#1 \\ #2 \end{array}\right]}\) \(\newcommand{\ctwovec}[2]{\left[\begin{array}{c}#1 \\ #2 \end{array}\right]}\) \(\newcommand{\threevec}[3]{\left[\begin{array}{r}#1 \\ #2 \\ #3 \end{array}\right]}\) \(\newcommand{\cthreevec}[3]{\left[\begin{array}{c}#1 \\ #2 \\ #3 \end{array}\right]}\) \(\newcommand{\fourvec}[4]{\left[\begin{array}{r}#1 \\ #2 \\ #3 \\ #4 \end{array}\right]}\) \(\newcommand{\cfourvec}[4]{\left[\begin{array}{c}#1 \\ #2 \\ #3 \\ #4 \end{array}\right]}\) \(\newcommand{\fivevec}[5]{\left[\begin{array}{r}#1 \\ #2 \\ #3 \\ #4 \\ #5 \\ \end{array}\right]}\) \(\newcommand{\cfivevec}[5]{\left[\begin{array}{c}#1 \\ #2 \\ #3 \\ #4 \\ #5 \\ \end{array}\right]}\) \(\newcommand{\mattwo}[4]{\left[\begin{array}{rr}#1 \amp #2 \\ #3 \amp #4 \\ \end{array}\right]}\) \(\newcommand{\laspan}[1]{\text{Span}\{#1\}}\) \(\newcommand{\bcal}{\cal B}\) \(\newcommand{\ccal}{\cal C}\) \(\newcommand{\scal}{\cal S}\) \(\newcommand{\wcal}{\cal W}\) \(\newcommand{\ecal}{\cal E}\) \(\newcommand{\coords}[2]{\left\{#1\right\}_{#2}}\) \(\newcommand{\gray}[1]{\color{gray}{#1}}\) \(\newcommand{\lgray}[1]{\color{lightgray}{#1}}\) \(\newcommand{\rank}{\operatorname{rank}}\) \(\newcommand{\row}{\text{Row}}\) \(\newcommand{\col}{\text{Col}}\) \(\renewcommand{\row}{\text{Row}}\) \(\newcommand{\nul}{\text{Nul}}\) \(\newcommand{\var}{\text{Var}}\) \(\newcommand{\corr}{\text{corr}}\) \(\newcommand{\len}[1]{\left|#1\right|}\) \(\newcommand{\bbar}{\overline{\bvec}}\) \(\newcommand{\bhat}{\widehat{\bvec}}\) \(\newcommand{\bperp}{\bvec^\perp}\) \(\newcommand{\xhat}{\widehat{\xvec}}\) \(\newcommand{\vhat}{\widehat{\vvec}}\) \(\newcommand{\uhat}{\widehat{\uvec}}\) \(\newcommand{\what}{\widehat{\wvec}}\) \(\newcommand{\Sighat}{\widehat{\Sigma}}\) \(\newcommand{\lt}{<}\) \(\newcommand{\gt}{>}\) \(\newcommand{\amp}{&}\) \(\definecolor{fillinmathshade}{gray}{0.9}\)- Define the purpose of PAGE and explain its role in protein analysis.
- Describe how SDS-PAGE separates proteins by size.
- Explain the function of key reagents such as SDS, β-mercaptoethanol (BME), and polyacrylamide.
- Identify the components and layers of a polyacrylamide gel.
- Predict how protein size influences migration in PAGE.
- Understand how to prepare, load, and run protein samples in a vertical gel system.
- Polyacrylamide Gel: A synthetic gel matrix used in electrophoresis to separate proteins based on size and charge.
- SDS (Sodium Dodecyl Sulfate): An anionic detergent that denatures proteins and gives them a uniform negative charge.
- β-Mercaptoethanol (BME): A reducing agent that breaks disulfide bonds, helping proteins unfold.
- Denaturation: The process of unfolding proteins by disrupting their secondary and tertiary structures.
- Stacking Gel (4%): The top layer of the gel with large pores, which compresses proteins into a tight band.
- Resolving Gel (10%): The bottom layer with smaller pores that separates proteins by size.
- Electrophoresis: A technique that uses an electric field to move molecules through a gel.
- Protein Ladder (Standard): A mixture of proteins with known molecular weights used as a size reference.
- Bromophenol Blue: A small, visible dye that tracks the progress of electrophoresis without indicating protein size.
- ChemiDoc Imager: A digital imaging system that visualizes protein bands on stain-free gels.
- Why do we denature proteins before electrophoresis?
- How does SDS ensure that proteins migrate based on size and not shape or charge?
- What does a single band versus multiple bands on your gel indicate about protein purity?
Polyacrylamide Gel Electrophoresis (PAGE)
Background:
Polyacrylamide Gel Electrophoresis (PAGE) is a widely used technique in molecular biology and biochemistry to separate proteins based on their size and charge. In this activity, you will apply PAGE to evaluate the purity of your protein samples—specifically the P450BM3 enzyme—by observing their migration through a polyacrylamide gel matrix. Each student group will run their own gel and visualize results using a ChemiDoc Imaging System, which enables quick, stain-free detection of protein bands, eliminating the need for traditional staining and de-staining steps using Coomassie blue.
PAGE separates proteins by exploiting their differential movement through a gel when subjected to an electric field. Proteins migrate at different rates depending on several factors: the gel's porosity, the pH and ionic strength of the buffer, temperature, and the protein's size and charge. In standard SDS-PAGE (Sodium Dodecyl Sulfate-PAGE), proteins are first denatured and coated with SDS, an anionic detergent. SDS disrupts secondary and tertiary structures, causing the proteins to unfold into linear shapes. It also imparts a uniform negative charge across the length of each polypeptide, ensuring that protein migration is primarily influenced by size—not by their intrinsic charge or shape. To further disrupt protein folding and break disulfide bonds, the sample buffer includes β-mercaptoethanol (BME) and the samples are boiled before loading onto the gel.
The gel itself consists of polyacrylamide, a synthetic polymer formed by cross-linking acrylamide and bisacrylamide. Polymerization is initiated by ammonium persulfate (APS), an oxidizing agent, and catalyzed by TEMED, which accelerates APS decomposition. The gel is cast in two layers:
- The stacking gel (4% acrylamide, upper layer) has large pores and functions to concentrate all proteins into a narrow band, improving resolution.
- The resolving (or separating) gel (10% acrylamide, lower layer) has smaller pores and separates proteins based on size during electrophoresis.

Image created by Diana Valdovinos.
Your gel will be run in a vertical electrophoresis system. This apparatus has two buffer chambers separated by the gel, with electrodes connected to a power supply (black = cathode, red = anode). When an electric current is applied, the negatively charged SDS-protein complexes migrate through the gel towards the positive anode. Smaller proteins move more quickly through the matrix, while larger proteins experience more resistance and migrate more slowly. For reference, Cytochrome P450BM3 has a molecular weight of approximately 119 kDa.
To monitor the progress of electrophoresis in real time, the loading buffer contains a tracking dye—bromophenol blue. This small dye molecule runs ahead of the proteins and is not used to determine size but gives a visual cue for when to stop the gel run. Once the dye front approaches the bottom of the gel, the electrophoresis can be halted.
After the run, you will use a ChemiDoc Imager, a high-resolution imaging system that allows you to detect and document your protein bands directly. By comparing the migration distance of your bands to a known Protein Standard ladder (which contains proteins of known molecular weights), you can estimate the molecular weights of your sample proteins and assess their purity. A single, distinct band at the expected molecular weight indicates a successful purification, while multiple bands suggest the presence of contaminants or incomplete purification.
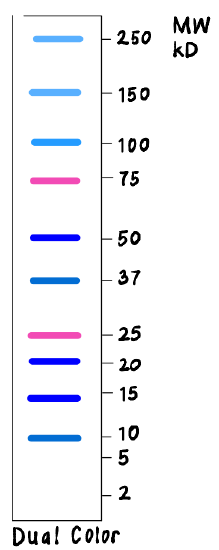
Image created by Diana Valdovinos.
This activity will help you validate whether your target protein was successfully purified and assess the integrity of the enzyme P450BM3 as part of your larger experimental workflow.
Materials Needed
- Electrophoresis system with power supply (Bio-Rad #1658005 and #1645050)
- 10% TGX stain-free polyacrylamide gels (Bio-Rad #4568034)
- 10X Running buffer (Bio-Rad #1610772)
- 4X Sample buffer (Bio-Rad #1610747)
- Protein samples (from previous labs):
- CFE A, CFE B, 30–60% (Dialyzed), and 30-60% (PURE)
- Protein standard (ladder) (Bio-Rad #1610363)
- Heat source (Boiling water or 100°C heating block – Carolina #217200 or #217205)
- Micropipettes and pipette tips
- 1.5 mL microcentrifuge tubes
- Gel opening lever (Bio-Rad #4560000)
- ChemiDoc MP Imaging System (Bio-Rad #12003154)
- β-mercaptoethanol (BME)
Procedure: Preparing and Running Your Gel
- Take new 1.5 mL microcentrifuge tubes and label one for each protein sample. Include your group name on the labels.
- In each labeled tube, combine:
- 30 µL of your protein sample
- 10 µL of 4X sample buffer (final concentration will be 1X)
- 2 µL of β-mercaptoethanol (BME)
- Cap the tubes tightly and place the tubes in boiling water or a 95°C heating block for 4 minutes to denature the proteins and reduce disulfide bonds.
- Let the tubes cool at room temperature for 1 minute.
- Briefly spin down the tubes (3 seconds) in a microcentrifuge to collect any condensation from the lid.
- Refer to the sample loading diagram provided below.
- Your TA or instructor will load 10 µL of the protein standard into well 1.
- Carefully and slowly load 40 µL of each prepared sample into separate wells on the gel.
- Place the lid securely on the electrophoresis tank.
- Set the power supply to 300 volts.
- Run the gel until the bromophenol blue tracking dye is approximately 1 cm from the bottom of the gel.
- Use the gel-opening lever to open the gel cassette.
- Place the gel in the ChemiDoc MP Imaging System to view and document your protein bands.

Image of a flow chart summarizing the Verification of Protein Purification via Polyacrylamide Gel Electrophoresis. Image created by Diana Valdovinos.
By the end of this activity, you should be able to:
- Interpret protein band patterns to assess purity and estimate molecular weight.
- Evaluate your experimental technique and identify potential loading or handling errors.
- Compare experimental bands to the protein ladder to determine approximate sizes.
- Troubleshoot common issues such as smeared bands or incomplete denaturation.
- Reflect on how PAGE supports broader experimental workflows in protein purification and analysis.
- Did the observed band for P450BM3 appear at the expected 119 kDa position? What does this suggest?
- Were there extra bands? If so, what could be the possible sources—contamination, partial purification, or degradation?
- How did the different fractions (e.g., 0–40%, 40–60%) compare in terms of band clarity and intensity?
- If you observed smeared or faint bands, what procedural steps might have contributed to that?
- How might the PAGE results guide your next experimental steps (e.g., additional purification, western blotting)?
Self-Evaluation
Rate your confidence on the following skills from 1 (Needs Work) to 5 (Confident):
| Skill | Rating (1–5) |
|---|---|
| Preparing protein samples with BME and sample buffer | ☐ |
| Correctly loading the gel without introducing bubbles | ☐ |
| Running the electrophoresis at appropriate voltage | ☐ |
| Identifying molecular weights using a protein ladder | ☐ |
| Operating the ChemiDoc Imager and capturing gel images | ☐ |