
18.4: What causes successional change?
- Page ID
- 81422
The trajectory of successional change can be influenced by site conditions, by the type of events initiating succession, by the interactions of the species present, and by more stochastic factors such as availability of propagules or weather conditions at the time of disturbance. Some of these factors contribute to predictability of succession dynamics; others add more probabilistic elements.
Autogenic succession can be brought by changes in the soil caused by the organisms there. These changes include accumulation of organic matter in litter or humic layer, alteration of soil nutrients, or change in the pH of soil due to the plants growing there. The structure of the plants themselves can also alter the community. For example, when larger species like trees mature, they produce shade on to the developing forest floor that tends to exclude light-requiring species. Shade-tolerant species will invade the area.
Allogenic succession is caused by external environmental influences and not by the vegetation. For example, soil changes due to erosion, leaching or the deposition of silt and clays can alter the nutrient content and water relationships in the ecosystems. Animals also play an important role in allogenic changes as they are pollinators, seed dispersers and herbivores. They can also increase nutrient content of the soil in certain areas, or shift soil about (as termites, ants, and moles do) creating patches in the habitat. This may create regeneration sites that favor certain species.
Climatic factors may be very important, but on a much longer time-scale than any other. Changes in temperature and rainfall patterns will promote changes in communities. As the climate warmed at the end of each ice age, great successional changes took place. The tundra vegetation and bare glacial till deposits underwent succession to mixed deciduous forest. The greenhouse effect resulting in increase in temperature is likely to bring profound Allogenic changes in the next century. Geological and climatic catastrophes such as volcanic eruptions, earthquakes, avalanches, meteors, floods, fires, and high wind also bring allogenic changes.
18.4.1: Models of Successional Change
Joseph Connell and Ralph Slatyer further developed the understanding of successional mechanisms in their 1977 paper and proposed that there were 3 main modes of successional development. These sequences could be understood in the context of the specific life-history theories of the individual species within an ecological community.
Facilitation model
The facilitation model is based on the assumption that only particular species with qualities ideal for "early succession" can colonize the newly exposed landforms after an ecological disturbance.
- These "colonizing" qualities include: highly effective methods of dispersal, the ability to remain dormant for long periods of time, and a rapid growth rate. However, the pioneer species are often subsequently less successful once an area has been heavily populated by surrounding species due to increased shade, litter or concentrated roots in the soil, etc.1
- Thus, the presence of early successional species often changes the environment so that the habitat is less hospitable for the original species’ own ecological demands and facilitates the invasion of later-successional species.
The facilitation model suggests that the presence of an initial species aids and increases the probability of the growth of a second species. For example, the presence of alder plants aids the growth of willow and poplar seedlings in an Alaskan floodplain.2 Alder roots contain nitrogen-fixing bacteria, which greatly increase the amount of inorganic nitrogen present in soils. This increased availability of nitrogen aids the growth of both willow and poplar seedlings in areas without other competition. Eventually, however, willow and poplar grow more rapidly than alder, leading to a reduction in the abundance of the pioneer species, and eventually, spruce becomes a later-succession species, due to its increased ability (over alder) to grow in shaded areas.
Another case of facilitation comes from the colonization of lakeshore sand dunes.1,3 Adjacent pioneer plants colonize the otherwise moving sands and alter the environmental constraints of the sandy environment to better suit other plant species, which can then allow for soil binding to take place.4 The giant saguaro cactus, in this respect, can only survive in the shade of other plants (or in some cases rocks) – pioneer species facilitate their existence by providing shade. (The argument has also been made that this type of interaction is exemplary of the tolerance model; see below).1
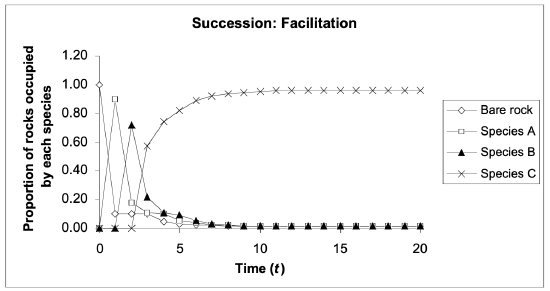
Figure \(\PageIndex{1}\): Bare rock is frequently replaced by species A, species A by species B, and species B by species C. All these species are equally likely to be replaced by bare rock. Species C is unique in that it is almost always replaced by itself, only rarely by bare rock, and never by other species. From Donovan and Welden.
Tolerance model
In this case, new pioneer species neither inhibit nor facilitate the growth and success of other species. The sequences of succession are thus entirely dependent on life-history characteristics such as the specific amount of energy a species allocates to growth.1
- The climax community is composed of the most "tolerant" species that can co-exist with other species in a more densely populated area. Eventually, dominant species replace or reduce pioneer species abundance through competition.
The tolerance model is completely dependent upon life history characteristics. Each species has an equally likely chance to establish itself in the early stages of succession and their establishment results in no environmental changes or impacts on other species.5 Eventually, early species, typically dominated by r-selected species, which prioritize fast rates of reproduction, are out-competed by K-selected species (species that become more dominant when there is competition for limited resources).
For example, we can examine succession in the Loess Plateau in China, where there is initial dominance of the Artemisia scoparia (virgate wormwood), the pioneer species. Over time, however, the Bothriochloa ischaemum (yellow bluestem) becomes the dominant species and the abundance of A. scoparia greatly declines. This is due to the rapid rate of reproduction of the A. scoparia, resulting in the species' early abundance, and the dominant competition from the K-selected B. ischaemum, resulting in that species' later abundance.6
A characteristic that is often associated with the tolerance model and well documented in forest succession is survival in conditions of shade. As an uninhabited area becomes populated by different plant species, shade increases – which makes less light available for the next generation. Species that are better adapted to shady conditions will then become dominant.
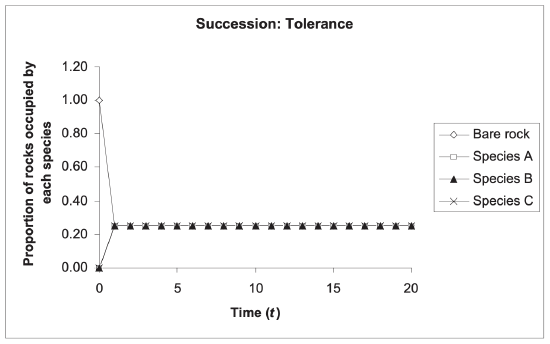
Figure \(\PageIndex{2}\): Any species is equally likely to replace any other, and equally susceptible to disturbance. From Donovan and Welden.
Inhibition model
Earlier successional species actually inhibit growth of later successional species and reduce growth of colonizing species already present.1
- Example: Pioneer species might modify the environment through rapid growth and make the area increasingly shady (essentially increasing competition for light).
- The environment is thus less hospitable to other potential colonizing species.
- The only possibility for new growth/colonization in this successional sequence arises when a disturbance leads to dominating species being destroyed, damaged, or removed. This frees up resources and allows for the invasion of other species that were not previously present
In this model, one species inhibits the presence of another, either through direct means, such as predation (by eating the other species or attacking them), or indirect means, such as competition for resources.
Sometimes in inhibition models, the time of establishment of a species determines which species becomes dominant. This phenomenon is referred to as the priority effect and suggests that the species that became established earlier are more likely to become the dominant species. One example of the inhibition model, and the priority effect, occurs in South Australia. In areas where bryozoans are established first, tunicates and sponges cannot grow.
The inhibition model has also been observed at work in forest ecosystems; in these systems the early arrivers hold a monopoly on the land, keeping other species out. Closed shrub canopies have been known to prevent tree growth and access to land for periods of up to 45 years – in an experimental study on inhibition it was found that areas occupied by large areas of Lantana (Lantana camara) sprawling shrubs excluded and inhibited the growth of tree species.1,7
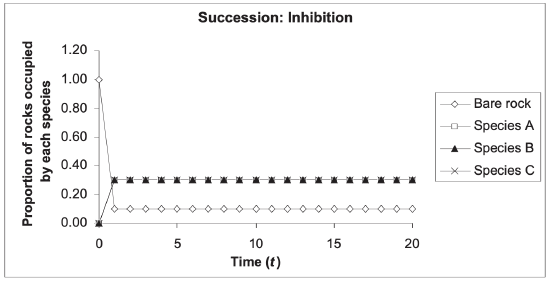
Figure \(\PageIndex{3}\): Each species is equally likely to colonize bare rock, and all species are equally susceptible to disturbance. Each species holds its site and inhibits occupancy by all others, so replacement occurs only by disturbance. From Donovan and Welden.
References
- Connell, J.H., & Slatyer, R.O. (1977). Mechanisms of succession in natural communities and their role in community stability and organization. The American Naturalist, 111(982), pp. 1119-1144.
- Walker, L.R., & Chapin, F.S. III. (1986). Physiological controls over seedling growth in primary succession on an Alaskan floodplain. Ecology, 67(6), pp. 1508-1523.
- Walker, L.R., et al. (1986). The role of life history processes in primary succession on an Alaskan Floodplain. Ecology, 67(5), pp. 1243-1253.
- “Sand Dunes.” National Biological Information Infrastructure- Home. Accessed 29 Apr. 2011. <https://web.archive.org/web/20110727031615/http://www.nbii.gov/portal/server.pt/community/sand_dunes/1311>.
- Moorcroft, P. (2011). Terrestrial succession. Organismic and Evolutionary Biology, 55. Maxwell Dworkin, Cambridge.
- Wang, G.H. (2002). Plant traits and soil chemical variables during a secondary vegetation succession in abandoned fields on the loess plateau. Acta Botanica Sinica, 44(8), pp. 990-998.
- Ricklefs, R.E. (2008). The economy of nature. New York, NY: W.H. Freeman and Co.
Contributors and Attributions
Modified by Castilleja Olmsted (University of Pittsburgh) and Kyle Whittinghill (University of Vermont) from the following sources: