
16.5: Infection
- Page ID
- 83712
\( \newcommand{\vecs}[1]{\overset { \scriptstyle \rightharpoonup} {\mathbf{#1}} } \)
\( \newcommand{\vecd}[1]{\overset{-\!-\!\rightharpoonup}{\vphantom{a}\smash {#1}}} \)
\( \newcommand{\dsum}{\displaystyle\sum\limits} \)
\( \newcommand{\dint}{\displaystyle\int\limits} \)
\( \newcommand{\dlim}{\displaystyle\lim\limits} \)
\( \newcommand{\id}{\mathrm{id}}\) \( \newcommand{\Span}{\mathrm{span}}\)
( \newcommand{\kernel}{\mathrm{null}\,}\) \( \newcommand{\range}{\mathrm{range}\,}\)
\( \newcommand{\RealPart}{\mathrm{Re}}\) \( \newcommand{\ImaginaryPart}{\mathrm{Im}}\)
\( \newcommand{\Argument}{\mathrm{Arg}}\) \( \newcommand{\norm}[1]{\| #1 \|}\)
\( \newcommand{\inner}[2]{\langle #1, #2 \rangle}\)
\( \newcommand{\Span}{\mathrm{span}}\)
\( \newcommand{\id}{\mathrm{id}}\)
\( \newcommand{\Span}{\mathrm{span}}\)
\( \newcommand{\kernel}{\mathrm{null}\,}\)
\( \newcommand{\range}{\mathrm{range}\,}\)
\( \newcommand{\RealPart}{\mathrm{Re}}\)
\( \newcommand{\ImaginaryPart}{\mathrm{Im}}\)
\( \newcommand{\Argument}{\mathrm{Arg}}\)
\( \newcommand{\norm}[1]{\| #1 \|}\)
\( \newcommand{\inner}[2]{\langle #1, #2 \rangle}\)
\( \newcommand{\Span}{\mathrm{span}}\) \( \newcommand{\AA}{\unicode[.8,0]{x212B}}\)
\( \newcommand{\vectorA}[1]{\vec{#1}} % arrow\)
\( \newcommand{\vectorAt}[1]{\vec{\text{#1}}} % arrow\)
\( \newcommand{\vectorB}[1]{\overset { \scriptstyle \rightharpoonup} {\mathbf{#1}} } \)
\( \newcommand{\vectorC}[1]{\textbf{#1}} \)
\( \newcommand{\vectorD}[1]{\overrightarrow{#1}} \)
\( \newcommand{\vectorDt}[1]{\overrightarrow{\text{#1}}} \)
\( \newcommand{\vectE}[1]{\overset{-\!-\!\rightharpoonup}{\vphantom{a}\smash{\mathbf {#1}}}} \)
\( \newcommand{\vecs}[1]{\overset { \scriptstyle \rightharpoonup} {\mathbf{#1}} } \)
\(\newcommand{\longvect}{\overrightarrow}\)
\( \newcommand{\vecd}[1]{\overset{-\!-\!\rightharpoonup}{\vphantom{a}\smash {#1}}} \)
\(\newcommand{\avec}{\mathbf a}\) \(\newcommand{\bvec}{\mathbf b}\) \(\newcommand{\cvec}{\mathbf c}\) \(\newcommand{\dvec}{\mathbf d}\) \(\newcommand{\dtil}{\widetilde{\mathbf d}}\) \(\newcommand{\evec}{\mathbf e}\) \(\newcommand{\fvec}{\mathbf f}\) \(\newcommand{\nvec}{\mathbf n}\) \(\newcommand{\pvec}{\mathbf p}\) \(\newcommand{\qvec}{\mathbf q}\) \(\newcommand{\svec}{\mathbf s}\) \(\newcommand{\tvec}{\mathbf t}\) \(\newcommand{\uvec}{\mathbf u}\) \(\newcommand{\vvec}{\mathbf v}\) \(\newcommand{\wvec}{\mathbf w}\) \(\newcommand{\xvec}{\mathbf x}\) \(\newcommand{\yvec}{\mathbf y}\) \(\newcommand{\zvec}{\mathbf z}\) \(\newcommand{\rvec}{\mathbf r}\) \(\newcommand{\mvec}{\mathbf m}\) \(\newcommand{\zerovec}{\mathbf 0}\) \(\newcommand{\onevec}{\mathbf 1}\) \(\newcommand{\real}{\mathbb R}\) \(\newcommand{\twovec}[2]{\left[\begin{array}{r}#1 \\ #2 \end{array}\right]}\) \(\newcommand{\ctwovec}[2]{\left[\begin{array}{c}#1 \\ #2 \end{array}\right]}\) \(\newcommand{\threevec}[3]{\left[\begin{array}{r}#1 \\ #2 \\ #3 \end{array}\right]}\) \(\newcommand{\cthreevec}[3]{\left[\begin{array}{c}#1 \\ #2 \\ #3 \end{array}\right]}\) \(\newcommand{\fourvec}[4]{\left[\begin{array}{r}#1 \\ #2 \\ #3 \\ #4 \end{array}\right]}\) \(\newcommand{\cfourvec}[4]{\left[\begin{array}{c}#1 \\ #2 \\ #3 \\ #4 \end{array}\right]}\) \(\newcommand{\fivevec}[5]{\left[\begin{array}{r}#1 \\ #2 \\ #3 \\ #4 \\ #5 \\ \end{array}\right]}\) \(\newcommand{\cfivevec}[5]{\left[\begin{array}{c}#1 \\ #2 \\ #3 \\ #4 \\ #5 \\ \end{array}\right]}\) \(\newcommand{\mattwo}[4]{\left[\begin{array}{rr}#1 \amp #2 \\ #3 \amp #4 \\ \end{array}\right]}\) \(\newcommand{\laspan}[1]{\text{Span}\{#1\}}\) \(\newcommand{\bcal}{\cal B}\) \(\newcommand{\ccal}{\cal C}\) \(\newcommand{\scal}{\cal S}\) \(\newcommand{\wcal}{\cal W}\) \(\newcommand{\ecal}{\cal E}\) \(\newcommand{\coords}[2]{\left\{#1\right\}_{#2}}\) \(\newcommand{\gray}[1]{\color{gray}{#1}}\) \(\newcommand{\lgray}[1]{\color{lightgray}{#1}}\) \(\newcommand{\rank}{\operatorname{rank}}\) \(\newcommand{\row}{\text{Row}}\) \(\newcommand{\col}{\text{Col}}\) \(\renewcommand{\row}{\text{Row}}\) \(\newcommand{\nul}{\text{Nul}}\) \(\newcommand{\var}{\text{Var}}\) \(\newcommand{\corr}{\text{corr}}\) \(\newcommand{\len}[1]{\left|#1\right|}\) \(\newcommand{\bbar}{\overline{\bvec}}\) \(\newcommand{\bhat}{\widehat{\bvec}}\) \(\newcommand{\bperp}{\bvec^\perp}\) \(\newcommand{\xhat}{\widehat{\xvec}}\) \(\newcommand{\vhat}{\widehat{\vvec}}\) \(\newcommand{\uhat}{\widehat{\uvec}}\) \(\newcommand{\what}{\widehat{\wvec}}\) \(\newcommand{\Sighat}{\widehat{\Sigma}}\) \(\newcommand{\lt}{<}\) \(\newcommand{\gt}{>}\) \(\newcommand{\amp}{&}\) \(\definecolor{fillinmathshade}{gray}{0.9}\)
An infection is the invasion of an organism's body tissues by disease-causing agents, their multiplication, and the reaction of host tissues to the infectious agents and the toxins they produce. An infectious disease, also known as a transmissible disease or communicable disease, is an illness resulting from an infection.
Infections can be caused by a wide range of pathogens, most prominently bacteria and viruses (Sehgal & Ladd, 2020). Hosts can fight infections using their immune system. Mammalian hosts react to infections with an innate response, often involving inflammation, followed by an adaptive response.
16.5.1 Pathophysiology
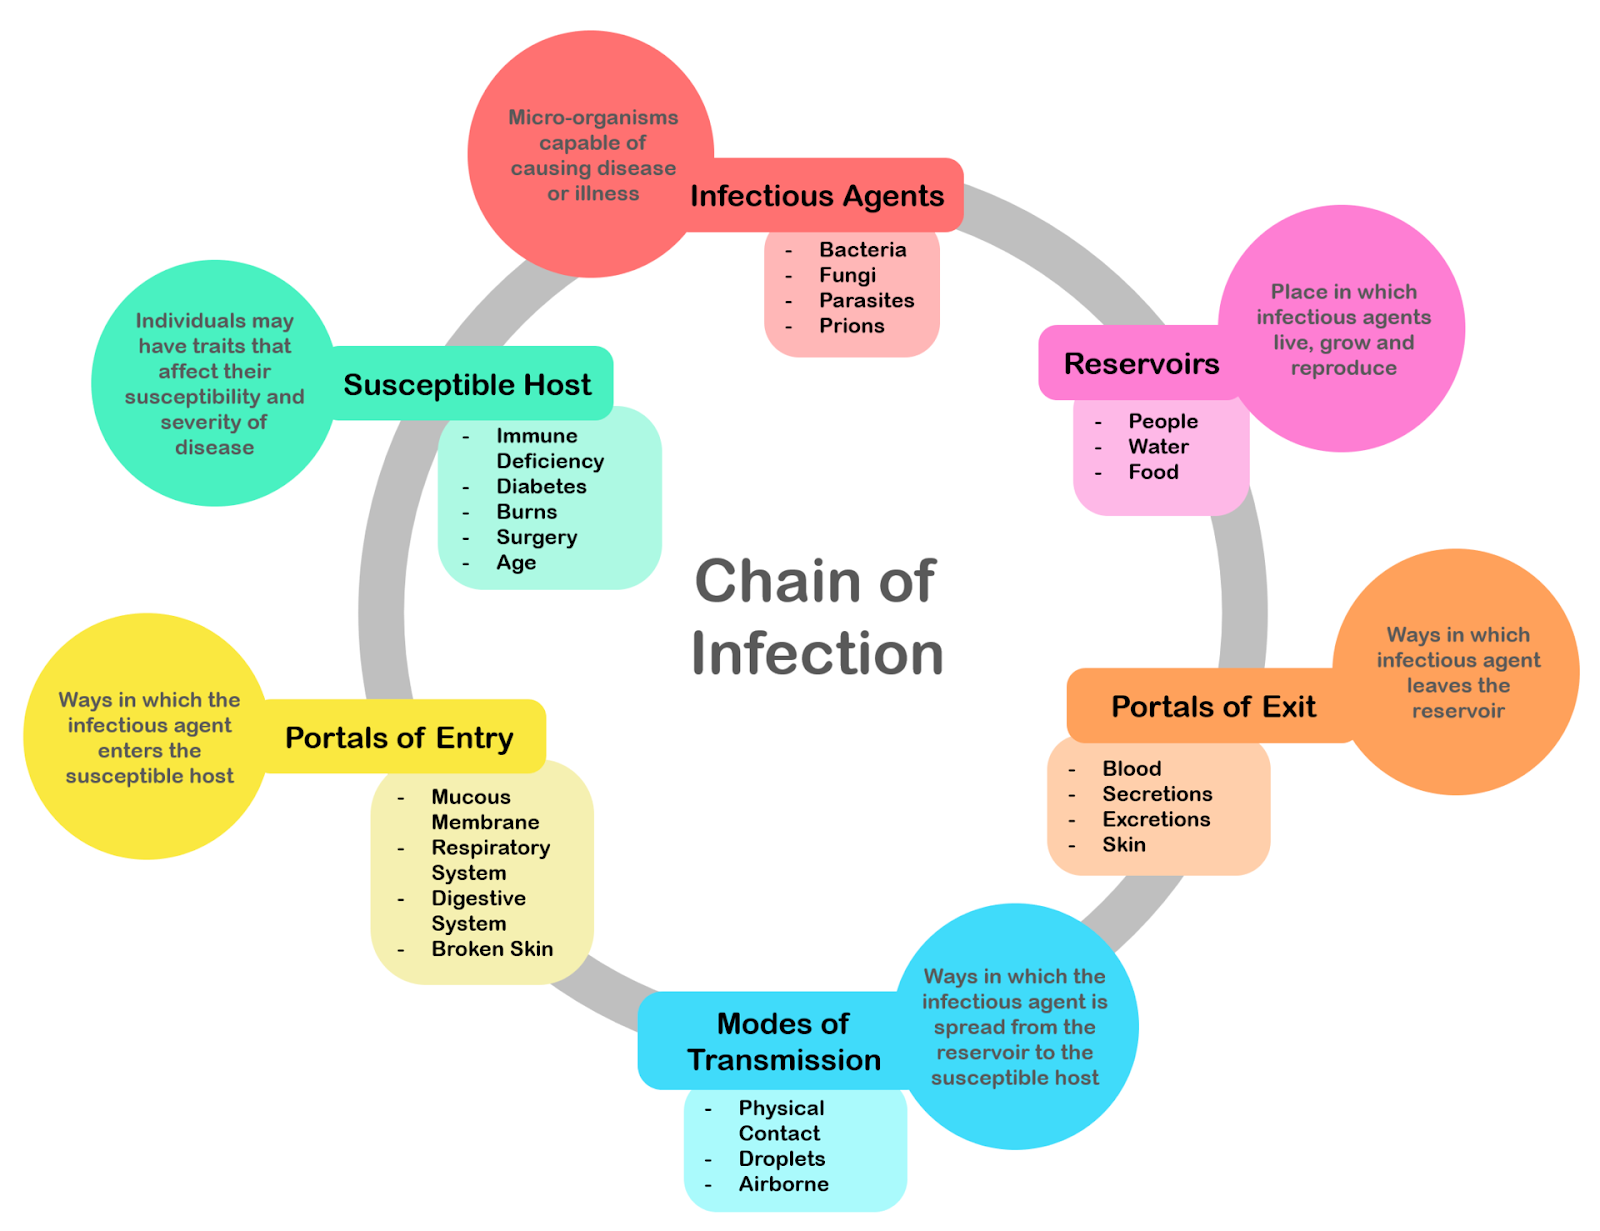
Figure \(\PageIndex{1}\): Chain of infection; the chain of events that lead to infection.
There is a general chain of events that applies to infections, sometimes called the chain of infection. The chain of events involves several steps – which include the infectious agent, reservoir, entering a susceptible host, exit and transmission to new hosts. Each of the links must be present in a chronological order for an infection to develop. Understanding these steps helps health care workers target the infection and prevent it from occurring in the first place.
Colonization
Infection begins when an organism successfully enters the body, grows and multiplies. This is referred to as colonization. Individuals with compromised or weakened immune systems have an increased susceptibility to chronic or persistent infections. Individuals who have a suppressed immune system are particularly susceptible to opportunistic infections. Entrance to the host at host-pathogen interface, generally occurs through the mucosa in orifices like the oral cavity, nose, eyes, genitalia, anus, or the microbe can enter through open wounds. While a few organisms can grow at the initial site of entry, many migrate and cause systemic infection in different organs. Some pathogens grow within the host cells (intracellular) whereas others grow freely in bodily fluids.
Wound colonization refers to non-replicating microorganisms within the wound, while in infected wounds, replicating organisms exist and tissue is injured (Negut et al., 2020). All multicellular organisms are colonized to some degree by extrinsic organisms, and the vast majority of these exist in either a mutualistic or commensal relationship with the host. An example of the former is the anaerobic bacteria species, which colonizes the mammalian colon, and an example of the latter are the various species of staphylococcus that exist on human skin. Neither of these colonizations are considered infections. The difference between an infection and a colonization is often only a matter of circumstance. Non-pathogenic organisms can become pathogenic given specific conditions, and even the most virulent organism requires certain circumstances to cause a compromising infection. Some colonizing bacteria, such as Corynebacteria sp. and viridans streptococci, prevent the adhesion and colonization of pathogenic bacteria and thus have a symbiotic relationship with the host, preventing infection and speeding wound healing.

Figure \(\PageIndex{2}\): This image depicts the steps of pathogenic infection.
The variables involved in the outcome of a host becoming inoculated by a pathogen and the ultimate outcome include:
-
the route of entry of the pathogen and the access to host regions that it gains
-
the intrinsic virulence of the particular organism
-
the quantity or load of the initial inoculant
-
the immune status of the host being colonized
As an example, several staphylococcal species remain harmless on the skin, but, when present in a normally sterile space, such as in the capsule of a joint or the peritoneum, multiply without resistance and cause harm.
Disease
Disease can arise if the host's protective immune mechanisms are compromised and the organism inflicts damage on the host. Microorganisms can cause tissue damage by releasing a variety of toxins or destructive enzymes. For example, Clostridium tetani releases a toxin that paralyzes muscles, and staphylococcus releases toxins that produce shock and sepsis. Not all infectious agents cause disease in all hosts. For example, less than 5% of individuals infected with polio develop disease. On the other hand, some infectious agents are highly virulent. The prion causing mad cow disease and Creutzfeldt–Jakob disease invariably kills all animals and people that are infected.
Persistent infections occur because the body is unable to clear the organism after the initial infection. Persistent infections are characterized by the continual presence of the infectious organism, often as latent infection with occasional recurrent relapses of active infection. There are some viruses that can maintain a persistent infection by infecting different cells of the body. Some viruses once acquired never leave the body. A typical example is the herpes virus, which tends to hide in nerves and become reactivated when specific circumstances arise.
Transmission
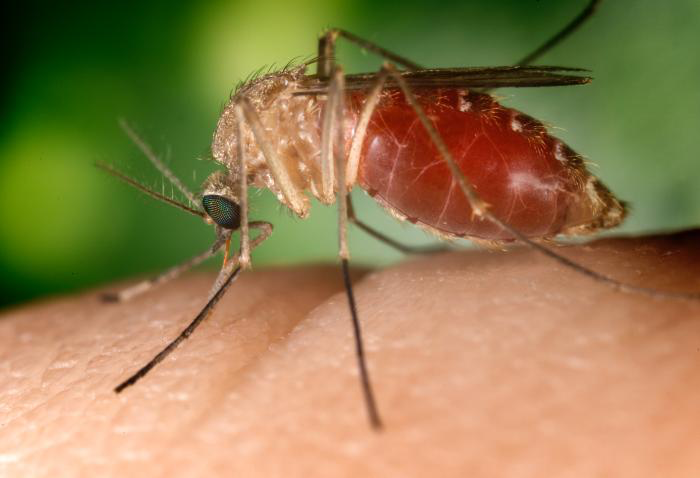
Figure \(\PageIndex{3}\): A southern house mosquito (Culex quinquefasciatus) is a vector that transmits the pathogens that cause West Nile fever and avian malaria among others.
For infecting organisms to survive and repeat the infection cycle in other hosts, they (or their progeny) must leave an existing reservoir and cause infection elsewhere. The relationship between virulence versus transmissibility is complex; if a disease is rapidly fatal, the host may die before the microbe can be passed along to another host. Infection transmission can take place via many potential routes:
-
Droplet contact, also known as the respiratory route, and the resultant infection can be termed airborne disease. If an infected individual coughs or sneezes on another individual the microorganisms, suspended in warm, moist droplets, may enter the body through the nose, mouth or eye surfaces.
-
Fecal-oral transmission, wherein food or water become contaminated and individuals who eat and drink them become infected. Common fecal-oral transmitted pathogens include Vibrio cholerae, Giardia species, rotaviruses, Entameba histolytica, Escherichia coli, and tapeworms. Most of these pathogens cause gastroenteritis.
-
Sexual transmission, with the resulting disease being called sexually transmitted disease.
-
Oral transmission, diseases that are transmitted primarily by oral means may be caught through direct or indirect oral contact between individuals.
-
Transmission by direct contact, some diseases that are transmissible by direct contact include athlete's foot, impetigo and warts.
-
Vehicle transmission, transmission by an inanimate reservoir (food, water, soil).
-
Vertical transmission, directly from the mother to an embryo, fetus or offspring during pregnancy or birth. It can occur as a result of a pre-existing infection or one acquired during pregnancy.
-
Latrogenic transmission, due to medical procedures such as injection or transplantation of infected material.
-
Vector-borne transmission, transmitted by a vector, which is an organism that does not cause disease itself but that transmits infection by conveying pathogens from one host to another.
16.5.2 Modeling Infectious Disease
Mathematical modeling of infectious diseases often assigns individuals within populations to specific compartments – for example, S, I, or R, (Susceptible, Infectious, or Recovered). Individuals may progress between these compartments over time. The SIR model is one of the simplest compartmental models, and many models are derivatives of this basic form (Harko et al., 2014).
The flow of this model may be considered as follows:
S -> I -> R
Specifically, the three compartments represent:
S: The number of susceptible individuals. When a susceptible and an infectious individual come into "infectious contact", the susceptible individual contracts the disease and transitions to the infectious compartment.
I: The number of infectious individuals. These are individuals who have been infected and are capable of infecting susceptible individuals.
R: The number of recovered (and immune) or deceased individuals. These are individuals who have been infected and have either recovered from the disease and entered the removed compartment, or died. It is assumed that the number of deaths is negligible with respect to the total population. This compartment may also be called "removed" or "resistant".
These variables (S, I, and R) represent the number of people in each compartment at a particular time. To represent that the number of susceptible, infectious and recovered individuals may vary over time (even if the total population size remains constant), we make the precise numbers a function of t (time): S(t), I(t) and R(t). For a specific disease in a specific population, these functions may be worked out in order to predict possible outbreaks (Yang et al., 2020).
As implied by the variable function of t, the model is dynamic in that the numbers in each compartment may fluctuate over time. The importance of this dynamic aspect is most obvious in an endemic disease with a short infectious period, such as measles in the UK prior to the introduction of a vaccine in 1968. Such diseases tend to occur in cycles of outbreaks due to the variation in number of susceptibles (S(t)) over time. During an epidemic, the number of susceptible individuals falls rapidly as more of them are infected and thus enter the infectious and removed compartments. The disease cannot break out again until the number of susceptibles has built back up, e.g. as a result of offspring being born into the susceptible compartment. This model is reasonably predictive for infectious diseases that are transmitted from human to human, and where recovery confers lasting resistance, such as measles, mumps and rubella.
The dynamics of an epidemic, for example, the flu, are often much faster than the dynamics of birth and death, therefore, birth and death are often omitted in simple compartmental models. The SIR system without so-called vital dynamics (birth and death, sometimes called demography) described above can be expressed by the following system of ordinary differential equations (Hethcote, 2000), which include transition rates (described below):

Transition rates
For the full specification of the SIR model, the arrows should be labeled with the transition rates between compartments. Between S and I, the transition rate is assumed to be d(S/N)/dt = -βSI/N2, where N is the total population, β is the average number of contacts per person per time, multiplied by the probability of disease transmission in a contact between a susceptible and an infectious subject, and SI/N2 is the fraction of those contacts between an infectious and susceptible individual which result in the susceptible person becoming infected.
Between I and R, the transition rate is assumed to be proportional to the number of infectious individuals which is γI. This is equivalent to assuming that the probability of an infectious individual recovering in any time interval dt is simply γdt. For the special case in which there is no recovery from the infectious compartment (γ = 0), the SIR model reduces to a very simple SI model, which has a logistic solution, in which every individual eventually becomes infected.
Each member of the population typically progresses from susceptible to infectious to recovered. This can be shown as a flow diagram in which the boxes represent the different compartments and the arrows the transition between compartments.

Figure \(\PageIndex{4}\): States in an SIR epidemic model and the rates at which individuals transition between them.
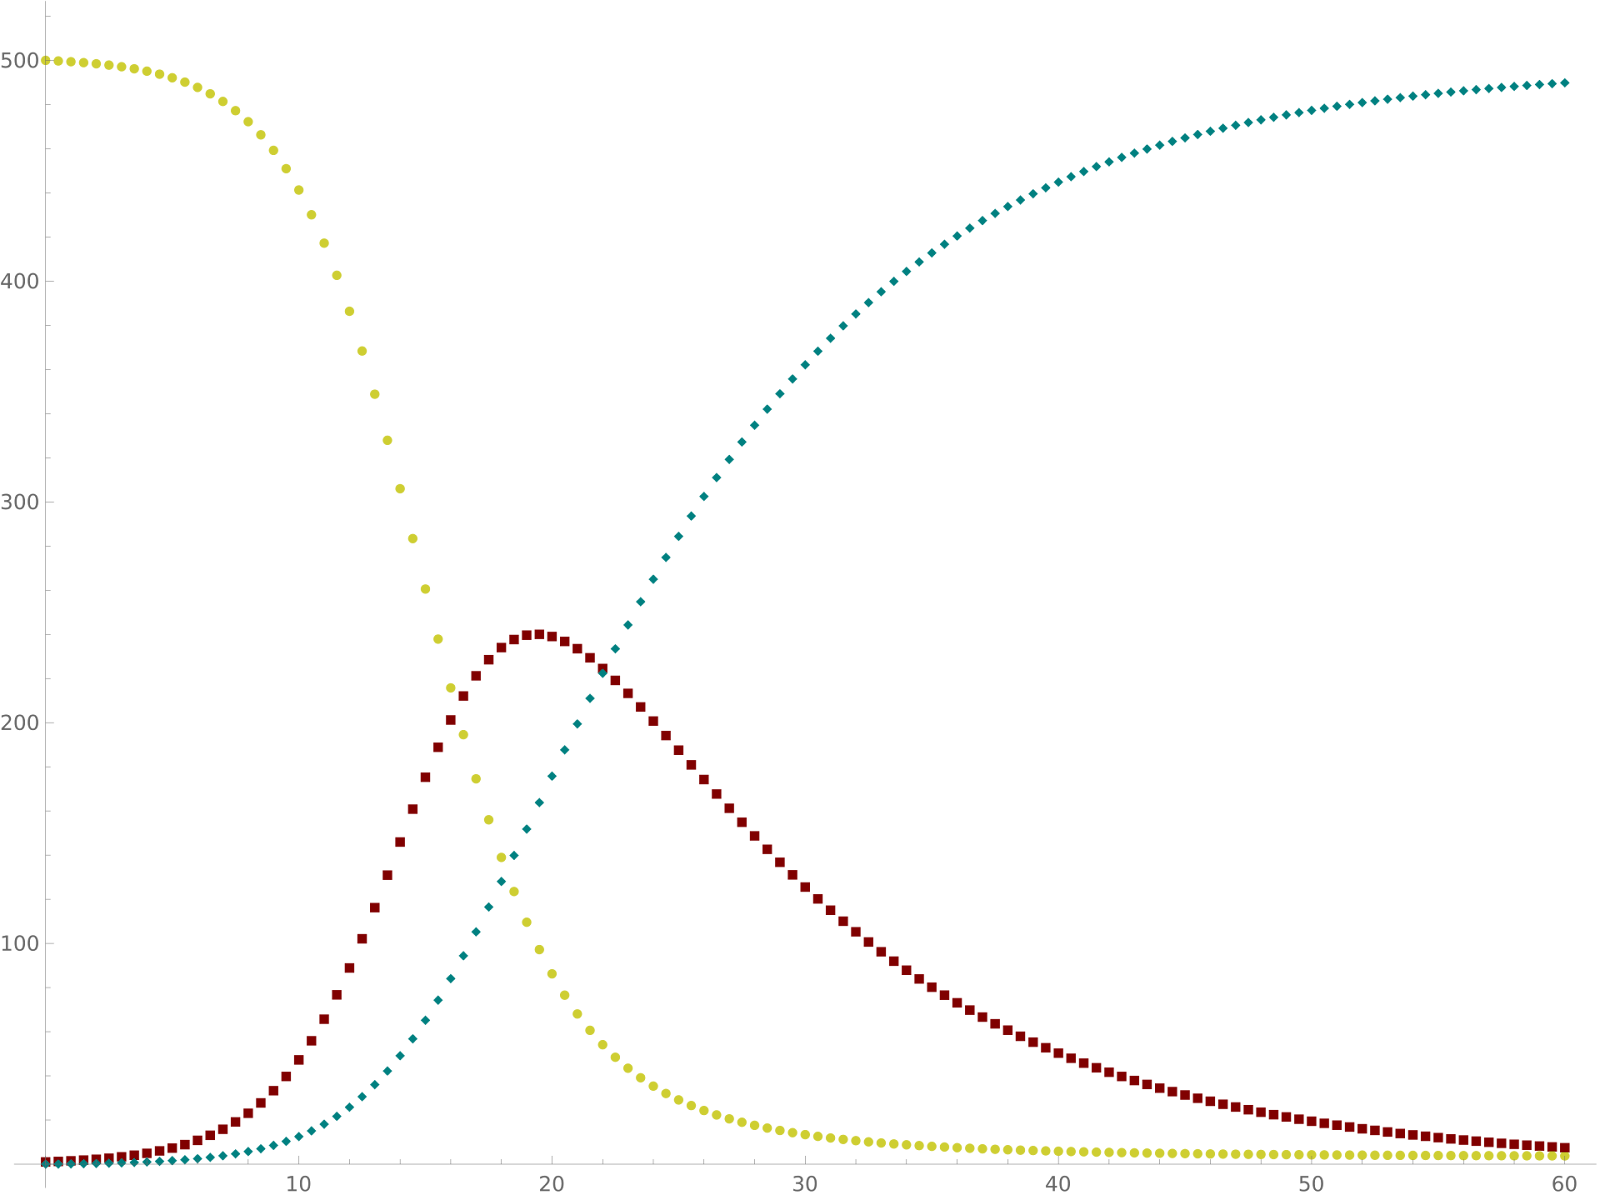
Figure 5: Dynamics of SIR model occurring over time. Yellow = Susceptible, Maroon = Infectious, Teal = Recovered
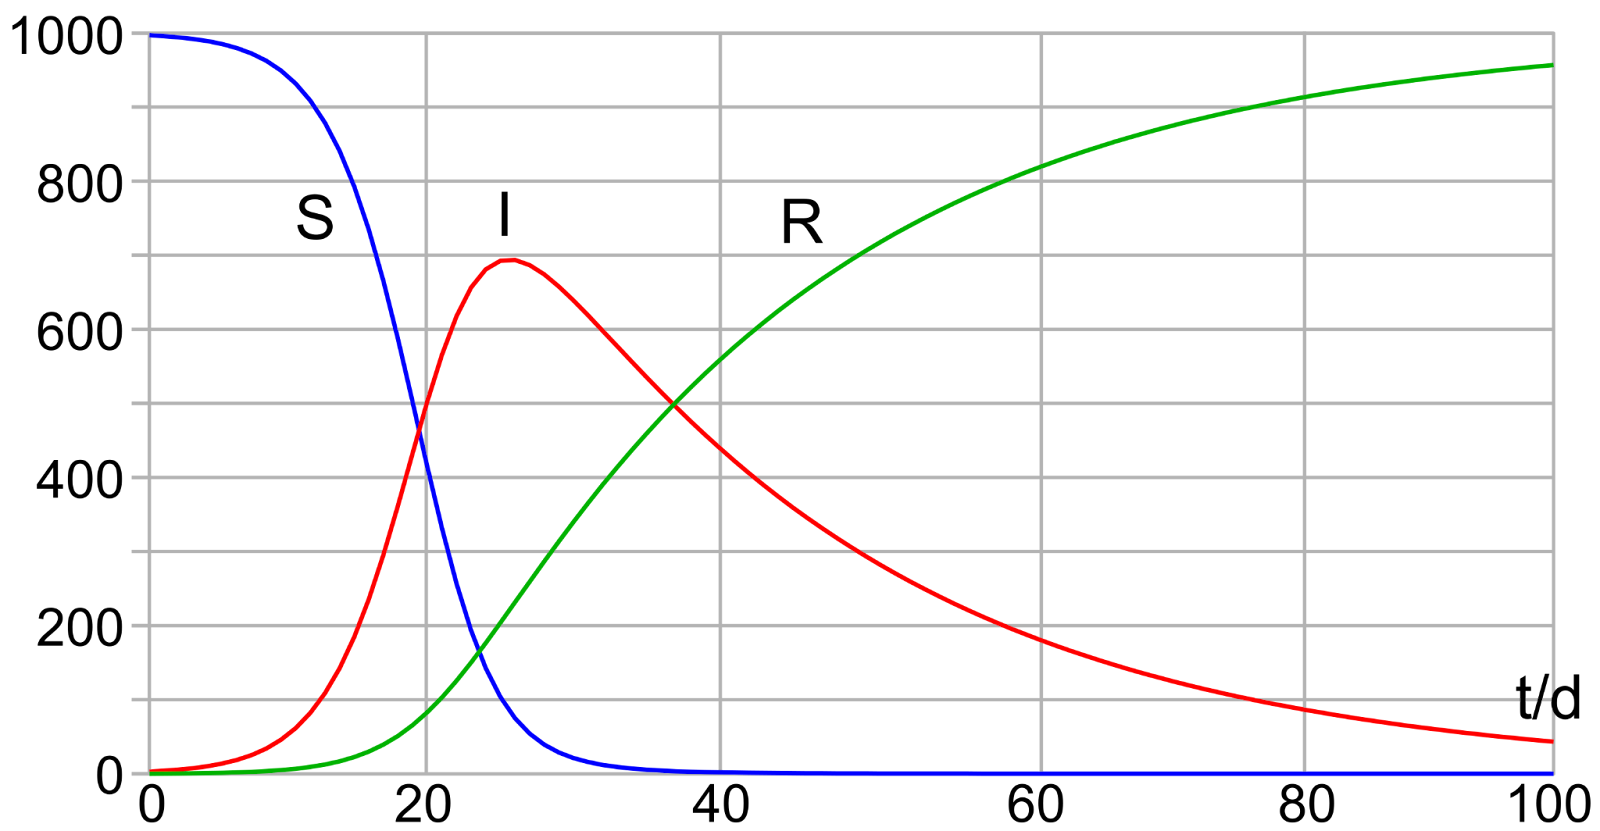
Figure 6: Diagram of the SIR model with initial values S(0) = 997, I(0) = 3, R(0) = 0 and rates for infection β = 0.4 and for recovery γ = 0.04.
Figure \(\PageIndex{7}\): Animation of the SIR model with initial values S(0) = 997, I(0) = 3, R(0) = 0, and rate of recovery γ = 0.04. The animation shows the effect of reducing the rate of infection from β = 0.5 to β = 0.12. If there is no medicine or vaccination available, it is only possible to reduce the infection rate (often referred to as "flattening the curve") by appropriate measures such as social distancing.
Note that the dynamics of the infectious class depends on the following ratio:
\[ R_{0}=\frac{\beta}{\gamma} \nonumber\]
The so-called basic reproduction number or basic reproduction ratio (denoted as R0 - pronounced R nought or R zero) (Milligan & Barrett, 2015) is derived as the expected number of new infections (these new infections are sometimes called secondary infections) from a single infection in a population where all subjects are susceptible (Bailey, 1975). The most important uses of R0 are determining if an emerging infectious disease can spread in a population and determining what proportion of the population should be immunized through vaccination to eradicate a disease. In commonly used infection models, when R0 > 1 the infection will be able to start spreading in a population, but not if R0 < 1. Generally, the larger the value of R0, the harder it is to control the epidemic. For simple models, the proportion of the population that needs to be effectively immunized (meaning not susceptible to infection) to prevent sustained spread of the infection has to be larger than 1 - 1/R0 (Kröger, 2020). Conversely, the proportion of the population that remains susceptible to infection in the endemic equilibrium is 1/R0.
The basic reproduction number is affected by several factors, including the duration of infectivity of affected people, the infectiousness of the microorganism, and the number of susceptible people in the population that the infected people contact.
Sources
Bailey, N.T.J. (1975). The mathematical theory of infectious diseases and its applications (2nd ed.). London: Griffin. ISBN 0-85264-231-8.
Harko, T., Lobo, F.S., & Mak, M.K. (2014). Exact analytical solutions of the Susceptible-Infected-Recovered (SIR) epidemic model and of the SIR model with equal death and birth rates. Applied Mathematics and Computation, 236, pp. 184–194. doi:10.1016/j.amc.2014.03.030
Hethcote, H. (2000). The mathematics of infectious diseases. SIAM Review, 42(4), pp. 599–653. doi:10.1137/s0036144500371907
Milligan, G.N., & Barrett, A.D. (2015). Vaccinology: An essential guide. Chichester, West Sussex: Wiley Blackwell, p. 310. ISBN 978-1-118-63652-7.
Negut, I., Grumezescu, V., & Grumezescu, A.M. (2018). Treatment strategies for infected wounds. Molecules, 23(9), pp. 2392. doi:10.3390/molecules23092392
Sehgal, M., Ladd, H.J., & Totapally, B. (2020). Trends in epidemiology and microbiology of severe sepsis and septic shock in children. Hospital Pediatrics, 10(12), pp. 1021–1030. doi:10.1542/hpeds.2020-0174
Yang, W., Zhang, D., Peng, L., Zhuge, C., & Hong, L. (2020). Rational evaluation of various epidemic models based on the COVID-19 data of China. arXiv:2003.05666v1