13.3: Estimating Extinction Risk
- Page ID
- 71514

\( \newcommand{\vecs}[1]{\overset { \scriptstyle \rightharpoonup} {\mathbf{#1}} } \)
\( \newcommand{\vecd}[1]{\overset{-\!-\!\rightharpoonup}{\vphantom{a}\smash {#1}}} \)
\( \newcommand{\id}{\mathrm{id}}\) \( \newcommand{\Span}{\mathrm{span}}\)
( \newcommand{\kernel}{\mathrm{null}\,}\) \( \newcommand{\range}{\mathrm{range}\,}\)
\( \newcommand{\RealPart}{\mathrm{Re}}\) \( \newcommand{\ImaginaryPart}{\mathrm{Im}}\)
\( \newcommand{\Argument}{\mathrm{Arg}}\) \( \newcommand{\norm}[1]{\| #1 \|}\)
\( \newcommand{\inner}[2]{\langle #1, #2 \rangle}\)
\( \newcommand{\Span}{\mathrm{span}}\)
\( \newcommand{\id}{\mathrm{id}}\)
\( \newcommand{\Span}{\mathrm{span}}\)
\( \newcommand{\kernel}{\mathrm{null}\,}\)
\( \newcommand{\range}{\mathrm{range}\,}\)
\( \newcommand{\RealPart}{\mathrm{Re}}\)
\( \newcommand{\ImaginaryPart}{\mathrm{Im}}\)
\( \newcommand{\Argument}{\mathrm{Arg}}\)
\( \newcommand{\norm}[1]{\| #1 \|}\)
\( \newcommand{\inner}[2]{\langle #1, #2 \rangle}\)
\( \newcommand{\Span}{\mathrm{span}}\) \( \newcommand{\AA}{\unicode[.8,0]{x212B}}\)
\( \newcommand{\vectorA}[1]{\vec{#1}} % arrow\)
\( \newcommand{\vectorAt}[1]{\vec{\text{#1}}} % arrow\)
\( \newcommand{\vectorB}[1]{\overset { \scriptstyle \rightharpoonup} {\mathbf{#1}} } \)
\( \newcommand{\vectorC}[1]{\textbf{#1}} \)
\( \newcommand{\vectorD}[1]{\overrightarrow{#1}} \)
\( \newcommand{\vectorDt}[1]{\overrightarrow{\text{#1}}} \)
\( \newcommand{\vectE}[1]{\overset{-\!-\!\rightharpoonup}{\vphantom{a}\smash{\mathbf {#1}}}} \)
\( \newcommand{\vecs}[1]{\overset { \scriptstyle \rightharpoonup} {\mathbf{#1}} } \)
\( \newcommand{\vecd}[1]{\overset{-\!-\!\rightharpoonup}{\vphantom{a}\smash {#1}}} \)
\(\newcommand{\avec}{\mathbf a}\) \(\newcommand{\bvec}{\mathbf b}\) \(\newcommand{\cvec}{\mathbf c}\) \(\newcommand{\dvec}{\mathbf d}\) \(\newcommand{\dtil}{\widetilde{\mathbf d}}\) \(\newcommand{\evec}{\mathbf e}\) \(\newcommand{\fvec}{\mathbf f}\) \(\newcommand{\nvec}{\mathbf n}\) \(\newcommand{\pvec}{\mathbf p}\) \(\newcommand{\qvec}{\mathbf q}\) \(\newcommand{\svec}{\mathbf s}\) \(\newcommand{\tvec}{\mathbf t}\) \(\newcommand{\uvec}{\mathbf u}\) \(\newcommand{\vvec}{\mathbf v}\) \(\newcommand{\wvec}{\mathbf w}\) \(\newcommand{\xvec}{\mathbf x}\) \(\newcommand{\yvec}{\mathbf y}\) \(\newcommand{\zvec}{\mathbf z}\) \(\newcommand{\rvec}{\mathbf r}\) \(\newcommand{\mvec}{\mathbf m}\) \(\newcommand{\zerovec}{\mathbf 0}\) \(\newcommand{\onevec}{\mathbf 1}\) \(\newcommand{\real}{\mathbb R}\) \(\newcommand{\twovec}[2]{\left[\begin{array}{r}#1 \\ #2 \end{array}\right]}\) \(\newcommand{\ctwovec}[2]{\left[\begin{array}{c}#1 \\ #2 \end{array}\right]}\) \(\newcommand{\threevec}[3]{\left[\begin{array}{r}#1 \\ #2 \\ #3 \end{array}\right]}\) \(\newcommand{\cthreevec}[3]{\left[\begin{array}{c}#1 \\ #2 \\ #3 \end{array}\right]}\) \(\newcommand{\fourvec}[4]{\left[\begin{array}{r}#1 \\ #2 \\ #3 \\ #4 \end{array}\right]}\) \(\newcommand{\cfourvec}[4]{\left[\begin{array}{c}#1 \\ #2 \\ #3 \\ #4 \end{array}\right]}\) \(\newcommand{\fivevec}[5]{\left[\begin{array}{r}#1 \\ #2 \\ #3 \\ #4 \\ #5 \\ \end{array}\right]}\) \(\newcommand{\cfivevec}[5]{\left[\begin{array}{c}#1 \\ #2 \\ #3 \\ #4 \\ #5 \\ \end{array}\right]}\) \(\newcommand{\mattwo}[4]{\left[\begin{array}{rr}#1 \amp #2 \\ #3 \amp #4 \\ \end{array}\right]}\) \(\newcommand{\laspan}[1]{\text{Span}\{#1\}}\) \(\newcommand{\bcal}{\cal B}\) \(\newcommand{\ccal}{\cal C}\) \(\newcommand{\scal}{\cal S}\) \(\newcommand{\wcal}{\cal W}\) \(\newcommand{\ecal}{\cal E}\) \(\newcommand{\coords}[2]{\left\{#1\right\}_{#2}}\) \(\newcommand{\gray}[1]{\color{gray}{#1}}\) \(\newcommand{\lgray}[1]{\color{lightgray}{#1}}\) \(\newcommand{\rank}{\operatorname{rank}}\) \(\newcommand{\row}{\text{Row}}\) \(\newcommand{\col}{\text{Col}}\) \(\renewcommand{\row}{\text{Row}}\) \(\newcommand{\nul}{\text{Nul}}\) \(\newcommand{\var}{\text{Var}}\) \(\newcommand{\corr}{\text{corr}}\) \(\newcommand{\len}[1]{\left|#1\right|}\) \(\newcommand{\bbar}{\overline{\bvec}}\) \(\newcommand{\bhat}{\widehat{\bvec}}\) \(\newcommand{\bperp}{\bvec^\perp}\) \(\newcommand{\xhat}{\widehat{\xvec}}\) \(\newcommand{\vhat}{\widehat{\vvec}}\) \(\newcommand{\uhat}{\widehat{\uvec}}\) \(\newcommand{\what}{\widehat{\wvec}}\) \(\newcommand{\Sighat}{\widehat{\Sigma}}\) \(\newcommand{\lt}{<}\) \(\newcommand{\gt}{>}\) \(\newcommand{\amp}{&}\) \(\definecolor{fillinmathshade}{gray}{0.9}\)Biologists often use the positive relationship between population size and likelihood of persistence to predict the probability that a population may go extinct at some point in the future. One of the most popular tools for making such predictions is population viability analysis (PVA). A PVA can be thought of as a type of extinction risk assessment; it uses demographic data and mathematical methods to predict at what point in the future a population or species is likely to perish. In addition, by considering a species’ resource requirements and the availability of limiting resources, biologists can use the results of a PVA to identify a species’ most vulnerable life stages, and to estimate how management techniques may influence population size and extinction risk. In this way, PVAs can guide conservation decisions by highlighting the need to, for example, modify harvesting regulations, perform translocations, or provide and protect a greater amount of suitable habitat. Even the IUCN’s Red List Criteria uses PVA as a criterion to help prioritize conservation targets: populations with low extinction risk may not require immediate attention, while those approaching extinction thresholds will gain higher priority.
Probability of extinction
Population viability analysis (PVA) uses demographic data and mathematical methods to predict if a population or species is likely to persist or perish.
The main purpose of a PVA is to estimate the viability (or time to extinction) of a species or population from observed population sizes and growth rates. Consider a population with 100 individuals that loses 50% of its individuals each year. A simple model will suggest that this population will lose 50 individuals the first year, 25 individuals the second year, and so on, until no individuals are left in the seventh year. The probability of extinction for this population is thus 100%, and the time to extinction is seven years. But how do we deal with the more realistic complex variations in population sizes we see in nature?
A more realistic PVA begins by constructing a mathematical model representing the population of interest using data obtained from a demographic study, which may include the current age (or size) structure of the population, average birth rates, and average survival rates of each age class. This dataset would be organized in a format suitable for PVA modeling using a database package, and then analyzed using the methods of matrix algebra. Because results from this initial model have only one outcome—a population that is either stable or growing/declining at a fixed rate—it is called a deterministic model. Typically, deterministic models are then tailored to include a variety of independent environmental parameters, such as food availability, storm frequency, or invasive competitors. Variability can also be added into the model by allowing some or all the model elements (e.g. survival rate or habitat availability) to vary within their observed ranges of values. Catastrophic events, such as a fire that kills a large proportion of the population, can also be programed to occur at random points in time. Hundreds or even thousands of simulations of this complex model can then be run to determine changes in population size over time, the probability of population extinction within a certain period, and the median time to extinction. Because of the variability built into this more complex model, each iteration’s output will vary from the next; for that reason, it is called a stochastic model. The choice of models and the parameters included depend on the goals of the analysis and the management options under consideration.
Minimum viable population
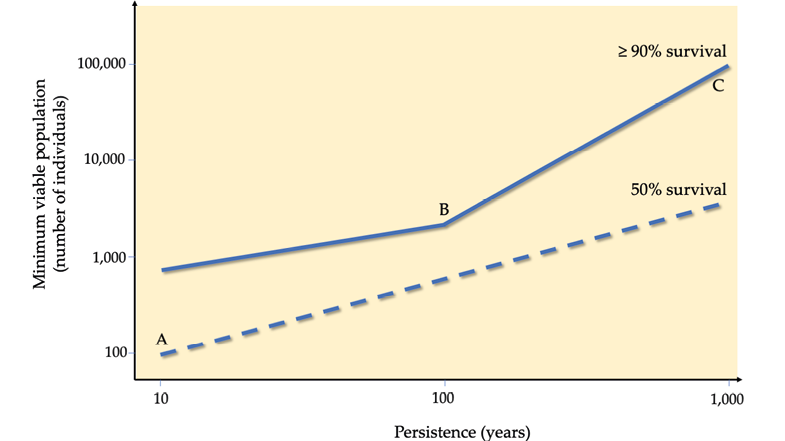
When a PVA shows that a population has a relatively high risk of extinction, a logical next step would be to determine what could be done to prevent the extinction from happening. In general, protecting larger populations reduces extinction probability (Figure 13.3.1). To understand exactly how large is large enough, a PVA can also be used to estimate a minimum viable population (MVP). As the name implies, an MVP is the smallest number of individuals necessary for a population to have a chance of long-term persistence, despite the potential effects of demographic, environmental, and genetic stochasticity, and natural catastrophes faced by small populations. This is well illustrated in the influential paper by Shaffer (1981), who compared setting MVP targets to planning for floods; engineers cannot rely on the average annual rainfall when designing flood control systems near rivers and wetlands. Instead, they must design systems that can also handle extreme rainfall and flooding events. These extreme events may occur rarely, perhaps once every 50 years, but they will likely occur during the lifetime of a flood control system. Similarly, to maximize the long-term protection of a threatened species, we must take actions that protect them in both average and extreme years characterized by catastrophic events such as cyclones/hurricanes, forest fires, and disease epidemics (Anderson et al., 2017). This is especially true considering future climate change scenarios, where every year may be uncharacteristically harsh, in effect a 50-year event.