
21.3: Lab Report
- Page ID
- 105889
\( \newcommand{\vecs}[1]{\overset { \scriptstyle \rightharpoonup} {\mathbf{#1}} } \)
\( \newcommand{\vecd}[1]{\overset{-\!-\!\rightharpoonup}{\vphantom{a}\smash {#1}}} \)
\( \newcommand{\id}{\mathrm{id}}\) \( \newcommand{\Span}{\mathrm{span}}\)
( \newcommand{\kernel}{\mathrm{null}\,}\) \( \newcommand{\range}{\mathrm{range}\,}\)
\( \newcommand{\RealPart}{\mathrm{Re}}\) \( \newcommand{\ImaginaryPart}{\mathrm{Im}}\)
\( \newcommand{\Argument}{\mathrm{Arg}}\) \( \newcommand{\norm}[1]{\| #1 \|}\)
\( \newcommand{\inner}[2]{\langle #1, #2 \rangle}\)
\( \newcommand{\Span}{\mathrm{span}}\)
\( \newcommand{\id}{\mathrm{id}}\)
\( \newcommand{\Span}{\mathrm{span}}\)
\( \newcommand{\kernel}{\mathrm{null}\,}\)
\( \newcommand{\range}{\mathrm{range}\,}\)
\( \newcommand{\RealPart}{\mathrm{Re}}\)
\( \newcommand{\ImaginaryPart}{\mathrm{Im}}\)
\( \newcommand{\Argument}{\mathrm{Arg}}\)
\( \newcommand{\norm}[1]{\| #1 \|}\)
\( \newcommand{\inner}[2]{\langle #1, #2 \rangle}\)
\( \newcommand{\Span}{\mathrm{span}}\) \( \newcommand{\AA}{\unicode[.8,0]{x212B}}\)
\( \newcommand{\vectorA}[1]{\vec{#1}} % arrow\)
\( \newcommand{\vectorAt}[1]{\vec{\text{#1}}} % arrow\)
\( \newcommand{\vectorB}[1]{\overset { \scriptstyle \rightharpoonup} {\mathbf{#1}} } \)
\( \newcommand{\vectorC}[1]{\textbf{#1}} \)
\( \newcommand{\vectorD}[1]{\overrightarrow{#1}} \)
\( \newcommand{\vectorDt}[1]{\overrightarrow{\text{#1}}} \)
\( \newcommand{\vectE}[1]{\overset{-\!-\!\rightharpoonup}{\vphantom{a}\smash{\mathbf {#1}}}} \)
\( \newcommand{\vecs}[1]{\overset { \scriptstyle \rightharpoonup} {\mathbf{#1}} } \)
\( \newcommand{\vecd}[1]{\overset{-\!-\!\rightharpoonup}{\vphantom{a}\smash {#1}}} \)
Part 1: Natural Selection Exercise—Generation 1
- Hypothesize which predator will be the most successful? (As with all hypotheses, be sure to include a reason for your thoughts.)
- Hypothesize which prey species will be the most successful? (As with all hypotheses, be sure to include a reason for your thoughts.)
Data Sheet: Generation 1
| Prey Type | Black bean | Pinto bean | Red bean | White bean | Total | % Captured |
|---|---|---|---|---|---|---|
| Population Size | 100 | 100 | 100 | 100 | 400 | — |
| Forceps | ||||||
| Spoon | ||||||
| Fork | ||||||
| Knife |
| Prey Type | Black bean | Pinto bean | Red bean | White bean | Total | % Captured |
|---|---|---|---|---|---|---|
| Total Kills | ||||||
| # Survived | ||||||
| % Survived | ||||||
| % Total Population |
Part 2: Natural Selection Exercise—Generation 2
Data Sheet: Generation 2
| Prey Type | Black bean | Pinto bean | Red bean | White bean | Total | % Captured |
|---|---|---|---|---|---|---|
| Population Size | 100 | 100 | 100 | 100 | 400 | — |
| Forceps | ||||||
| Spoon | ||||||
| Fork | ||||||
| Knife |
| Prey Type | Black bean | Pinto bean | Red bean | White bean | Total | % Captured |
|---|---|---|---|---|---|---|
| Total Kills | ||||||
| # Survived | ||||||
| % Survived | ||||||
| % Total Population |
Part 3: Natural Selection Exercise—Generation 3
Data Sheet: Generation 3
| Prey Type | Black bean | Pinto bean | Red bean | White bean | Total | % Captured |
|---|---|---|---|---|---|---|
| Population Size | 100 | 100 | 100 | 100 | 400 | — |
| Forceps | ||||||
| Spoon | ||||||
| Fork | ||||||
| Knife |
| Prey Type | Black bean | Pinto bean | Red bean | White bean | Total | % Captured |
|---|---|---|---|---|---|---|
| Total Kills | ||||||
| # Survived | ||||||
| % Survived | ||||||
| % Total Population |
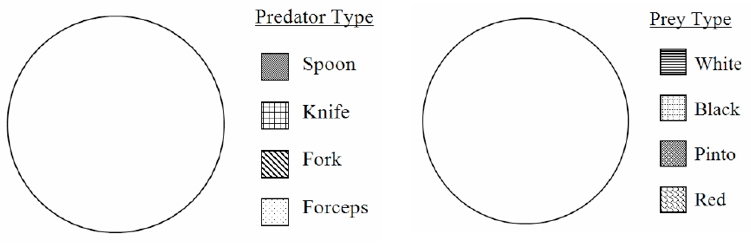
Part 4: Pie Chart Analysis of Predator and Prey Populations
End of First Generation:

End of Second Generation:
End of Third Generation:

Questions:
- Explain in your own words the process of natural selection.
- What conclusions can you draw regarding the effect of natural selection on the predator populations in this exercise?
- What conclusions can you draw regarding the effect of natural selection on the prey populations in this exercise?
- Why did we start with 4 predators but 200 prey? What happen if numbers of predators and prey are equal? Explain.
- Imagine a scenario where the one of the predator groups has very low genetic variability. A disease comes through and modifies the prey-capturing tool, decreasing the predator’s ability to hunt. Predict what would happen to that particular predator group.
- Relate the concept of natural selection to the process of evolution.
- Apart from natural selection, the real evolution process will also be influenced by (a) mutations, (b) migrations from other populations and (c) random processes (“genetic drift”). How you would change the rules of game in order to accommodate one or more of these processes?
-
mutations
-
migration
-
genetic drift
-
Licenses and Attributions
CC licensed content, Original
- Biology Labs. Authored by: Wendy Riggs. Provided by: College of the Redwoods. Located at: http://www.redwoods.edu. License: CC BY: Attribution
Cladistics and Phylogenetics
- Name each organism on the cladogram.
- Place a dot at every point that represents a common ancestor.
- Indicate one shared derived characteristic that distinguishes each branch.
- Who is more closely related: the shark and bony fish, or the bony fish and frog?

Figure \(\PageIndex{1}\): Cladogram for Subphylum Vertebrata.
Phylogenetics of Metal Objects
- Define phylogenetics:
- What object did you choose for your common ancestor? Why?
- Record your tree.
- Choose one path and explain the sequence of events/line that led to the “most recent” object. For example, L → B → R is a line that depicts an increase in size.
- Does your tree illustrate an example of convergent evolution? Explain.