12.1: Organizing Life on Earth
- Page ID
- 7043
All life on Earth evolved from a common ancestor. Biologists map how organisms are related by constructing phylogenetic trees. In other words, a “tree of life” can be constructed to illustrate when different organisms evolved and to show the relationships among different organisms, as shown in Figure \(\PageIndex{1}\). Notice that from a single point, the three domains of Archaea, Bacteria, and Eukarya diverge and then branch repeatedly. The small branch that plants and animals (including humans) occupy in this diagram shows how recently these groups had their origin compared with other groups.

The phylogenetic tree in Figure \(\PageIndex{1}\) illustrates the pathway of evolutionary history. The pathway can be traced from the origin of life to any individual species by navigating through the evolutionary branches between the two points. Also, by starting with a single species and tracing backward to any branch point, the organisms related to it by various degrees of closeness can be identified.
A phylogeny is the evolutionary history and the relationships among a species or group of species. The study of organisms with the purpose of deriving their relationships is called systematics.
Many disciplines within the study of biology contribute to understanding how past and present life evolved over time, and together they contribute to building, updating, and maintaining the “tree of life.” Information gathered may include data collected from fossils, from studying morphology, from the structure of body parts, or from molecular structure, such as the sequence of amino acids in proteins or DNA nucleotides. By considering the trees generated by different sets of data scientists can put together the phylogeny of a species.
Scientists continue to discover new species of life on Earth as well as new character information, thus trees change as new data arrive.
The Levels of Classification
Taxonomy (which literally means “arrangement law”) is the science of naming and grouping species to construct an internationally shared classification system. The taxonomic classification system (also called the Linnaean system after its inventor, Carl Linnaeus, a Swedish naturalist) uses a hierarchical model. A hierarchical system has levels and each group at one of the levels includes groups at the next lowest level, so that at the lowest level each member belongs to a series of nested groups. An analogy is the nested series of directories on the main disk drive of a computer. For example, in the most inclusive grouping, scientists divide organisms into three domains: Bacteria, Archaea, and Eukarya. Within each domain is a second level called a kingdom. Each domain contains several kingdoms. Within kingdoms, the subsequent categories of increasing specificity are: phylum, class, order, family, genus, and species.
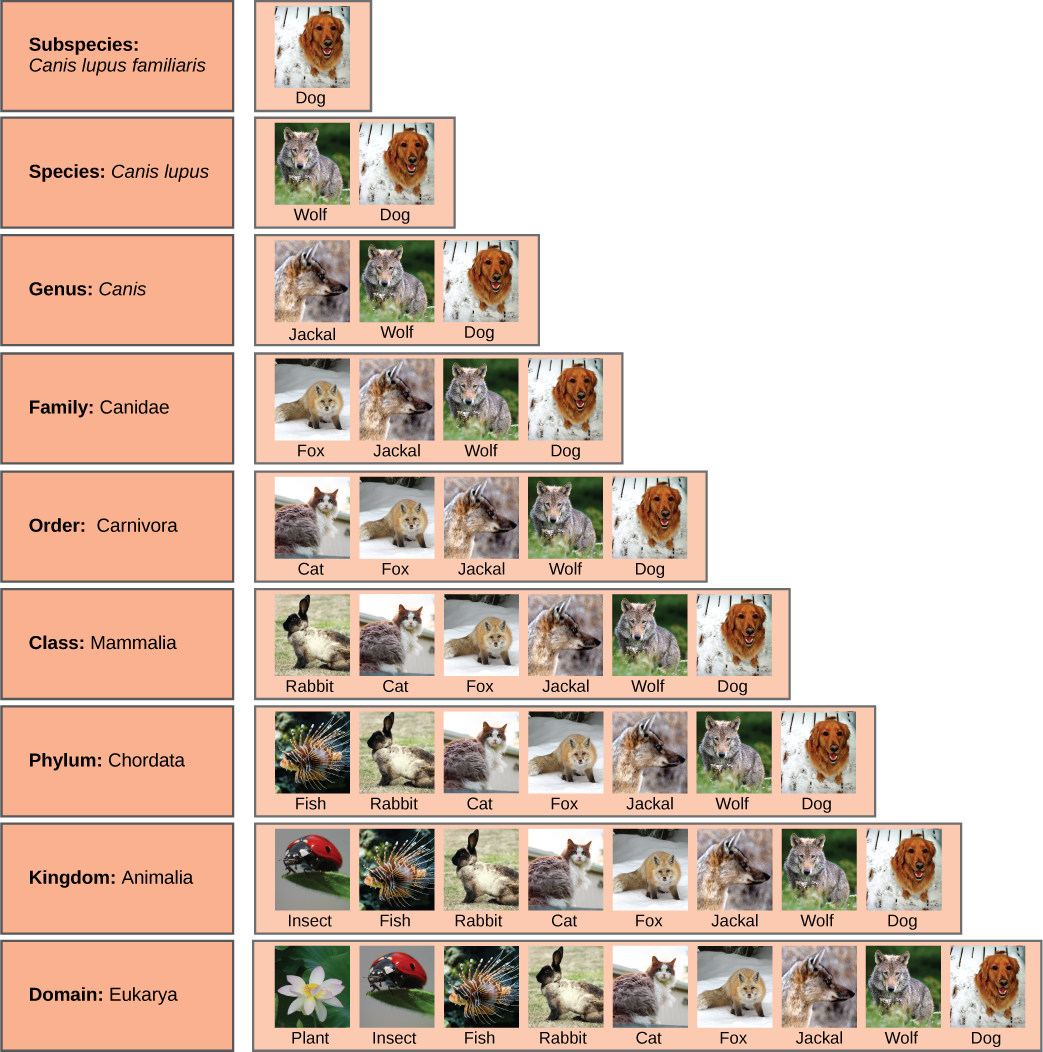
As an example, the classification levels for the domestic dog are shown in Figure \(\PageIndex{2}\). The group at each level is called a taxon (plural: taxa). In other words, for the dog, Carnivora is the taxon at the order level, Canidae is the taxon at the family level, and so forth. Organisms also have a common name that people typically use, such as domestic dog, or wolf. Each taxon name is capitalized except for species, and the genus and species names are italicized. Scientists refer to an organism by its genus and species names together, commonly called a scientific name, or Latin name. This two-name system is called binomial nomenclature. The scientific name of the wolf is therefore Canis lupus. Recent study of the DNA of domestic dogs and wolves suggest that the domestic dog is a subspecies of the wolf, not its own species, thus it is given an extra name to indicate its subspecies status, Canis lupus familiaris.
Figure \(\PageIndex{2}\) also shows how taxonomic levels move toward specificity. Notice how within the domain we find the dog grouped with the widest diversity of organisms. These include plants and other organisms not pictured, such as fungi and protists. At each sublevel, the organisms become more similar because they are more closely related. Before Darwin’s theory of evolution was developed, naturalists sometimes classified organisms using arbitrary similarities, but since the theory of evolution was proposed in the 19th century, biologists work to make the classification system reflect evolutionary relationships. This means that all of the members of a taxon should have a common ancestor and be more closely related to each other than to members of other taxa.
Recent genetic analysis and other advancements have found that some earlier taxonomic classifications do not reflect actual evolutionary relationships, and therefore, changes and updates must be made as new discoveries take place. One dramatic and recent example was the breaking apart of prokaryotic species, which until the 1970s were all classified as bacteria. Their division into Archaea and Bacteria came about after the recognition that their large genetic differences warranted their separation into two of three fundamental branches of life.
ART CONNECTION

In what levels are cats and dogs considered to be part of the same group?
Classification and Phylogeny
Scientists use a tool called a phylogenetic tree to show the evolutionary pathways and relationships between organisms. A phylogenetic tree is a diagram used to reflect evolutionary relationships among organisms or groups of organisms. The hierarchical classification of groups nested within more inclusive groups is reflected in diagrams. Scientists consider phylogenetic trees to be a hypothesis of the evolutionary past because one cannot go back through time to confirm the proposed relationships.
Unlike with a taxonomic classification, a phylogenetic tree can be read like a map of evolutionary history, as shown in Figure \(\PageIndex{3}\). Shared characteristics are used to construct phylogenetic trees. The point where a split occurs in a tree, called a branch point, represents where a single lineage evolved into distinct new ones. Many phylogenetic trees have a single branch point at the base representing a common ancestor of all the branches in the tree. Scientists call such trees rooted, which means there is a single ancestral taxon at the base of a phylogenetic tree to which all organisms represented in the diagram descend from. When two lineages stem from the same branch point, they are called sister taxa, for example the two species of orangutans. A branch point with more than two groups illustrates a situation for which scientists have not definitively determined relationships. An example is illustrated by the three branches leading to the gorilla subspecies; their exact relationships are not yet understood. It is important to note that sister taxa share an ancestor, which does not mean that one taxon evolved from the other. The branch point, or split, represents a common ancestor that existed in the past, but that no longer exists. Humans did not evolve from chimpanzees (nor did chimpanzees evolve from humans) although they are our closest living relatives. Both humans and chimpanzees evolved from a common ancestor that lived, scientists believe, six million years ago and looked different from both modern chimpanzees and modern humans.

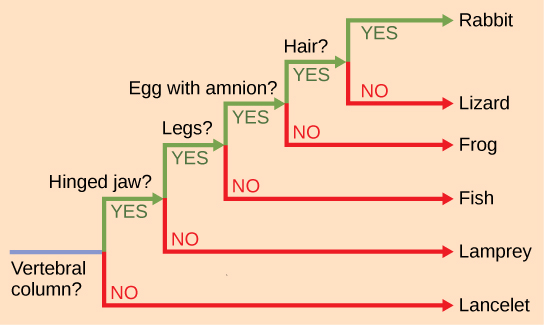
The branch points and the branches in phylogenetic tree structure also imply evolutionary change. Sometimes the significant character changes are identified on a branch or branch point. For example, in Figure \(\PageIndex{4}\), the branch point that gives rise to the mammal and reptile lineage from the frog lineage shows the origin of the amniotic egg character. Also the branch point that gives rise to organisms with legs is indicated at the common ancestor of mammals, reptiles, amphibians, and jawed fishes.

Limitations of Phylogenetic Trees
It is easy to assume that more closely related organisms look more alike, and while this is often the case, it is not always true. If two closely related lineages evolved under significantly different surroundings or after the evolution of a major new adaptation, they may look quite different from each other, even more so than other groups that are not as closely related. For example, the phylogenetic tree in Figure \(\PageIndex{4}\) shows that lizards and rabbits both have amniotic eggs, whereas salamanders (within the frog lineage) do not; yet on the surface, lizards and salamanders appear more similar than the lizards and rabbits.
Another aspect of phylogenetic trees is that, unless otherwise indicated, the branches do not show length of time, they show only the order in time of evolutionary events. In other words, a long branch does not necessarily mean more time passed, nor does a short branch mean less time passed— unless specified on the diagram. For example, in Figure \(\PageIndex{4}\), the tree does not indicate how much time passed between the evolution of amniotic eggs and hair. What the tree does show is the order in which things took place. Again using Figure \(\PageIndex{4}\), the tree shows that the oldest trait is the vertebral column, followed by hinged jaws, and so forth. Remember that any phylogenetic tree is a part of the greater whole, and similar to a real tree, it does not grow in only one direction after a new branch develops. So, for the organisms in Figure \(\PageIndex{4}\), just because a vertebral column evolved does not mean that invertebrate evolution ceased, it only means that a new branch formed. Also, groups that are not closely related, but evolve under similar conditions, may appear more similar to each other than to a close relative.
Section Summary
Scientists continually obtain new information that helps to understand the evolutionary history of life on Earth. Each group of organisms went through its own evolutionary journey, called its phylogeny. Each organism shares relatedness with others, and based on morphologic and genetic evidence scientists attempt to map the evolutionary pathways of all life on Earth. Historically, organisms were organized into a taxonomic classification system. However, today many scientists build phylogenetic trees to illustrate evolutionary relationships and the taxonomic classification system is expected to reflect evolutionary relationships.
Art Connections
Figure \(\PageIndex{2}\): In what levels are cats and dogs considered to be part of the same group?
- Answer
-
Cats and dogs are part of the same group at five levels: both are in the domain Eukarya, the kingdom Animalia, the phylum Chordata, the class Mammalia, and the order Carnivora.
Glossary
- binomial nomenclature
- a system of two-part scientific names for an organism, which includes genus and species names
- branch point
- a point on a phylogenetic tree where a single lineage splits to distinct new ones
- class
- the category in the taxonomic classification system that falls within phylum and includes orders
- domain
- the highest level category in the classification system and that includes all taxonomic classifications below it; it is the most inclusive taxon
- family
- the category in the taxonomic classification system that falls within order and includes genera
- genus
- the category in the taxonomic classification system that falls within family and includes species; the first part of the scientific name
- kingdom
- the category in the taxonomic classification system that falls within domain and includes phyla
- order
- the category in the taxonomic classification system that falls within class and includes families
- phylogenetic tree
- diagram used to reflect the evolutionary relationships between organisms or groups of organisms
- phylogeny
- evolutionary history and relationship of an organism or group of organisms
- phylum
- the category in the taxonomic classification system that falls within kingdom and includes classes
- rooted
- describing a phylogenetic tree with a single ancestral lineage to which all organisms represented in the diagram relate
- sister taxa
- two lineages that diverged from the same branch point
- species
- the most specific category of classification
- systematics
- the science of determining the evolutionary relationships of organisms
- taxon
- a single level in the taxonomic classification system
- taxonomy
- the science of classifying organisms
Contributors
Samantha Fowler (Clayton State University), Rebecca Roush (Sandhills Community College), James Wise (Hampton University). Original content by OpenStax (CC BY 4.0; Access for free at https://cnx.org/contents/b3c1e1d2-83...4-e119a8aafbdd).


