
1.8: Introduction to heredity review
- Page ID
- 73825
\( \newcommand{\vecs}[1]{\overset { \scriptstyle \rightharpoonup} {\mathbf{#1}} } \)
\( \newcommand{\vecd}[1]{\overset{-\!-\!\rightharpoonup}{\vphantom{a}\smash {#1}}} \)
\( \newcommand{\id}{\mathrm{id}}\) \( \newcommand{\Span}{\mathrm{span}}\)
( \newcommand{\kernel}{\mathrm{null}\,}\) \( \newcommand{\range}{\mathrm{range}\,}\)
\( \newcommand{\RealPart}{\mathrm{Re}}\) \( \newcommand{\ImaginaryPart}{\mathrm{Im}}\)
\( \newcommand{\Argument}{\mathrm{Arg}}\) \( \newcommand{\norm}[1]{\| #1 \|}\)
\( \newcommand{\inner}[2]{\langle #1, #2 \rangle}\)
\( \newcommand{\Span}{\mathrm{span}}\)
\( \newcommand{\id}{\mathrm{id}}\)
\( \newcommand{\Span}{\mathrm{span}}\)
\( \newcommand{\kernel}{\mathrm{null}\,}\)
\( \newcommand{\range}{\mathrm{range}\,}\)
\( \newcommand{\RealPart}{\mathrm{Re}}\)
\( \newcommand{\ImaginaryPart}{\mathrm{Im}}\)
\( \newcommand{\Argument}{\mathrm{Arg}}\)
\( \newcommand{\norm}[1]{\| #1 \|}\)
\( \newcommand{\inner}[2]{\langle #1, #2 \rangle}\)
\( \newcommand{\Span}{\mathrm{span}}\) \( \newcommand{\AA}{\unicode[.8,0]{x212B}}\)
\( \newcommand{\vectorA}[1]{\vec{#1}} % arrow\)
\( \newcommand{\vectorAt}[1]{\vec{\text{#1}}} % arrow\)
\( \newcommand{\vectorB}[1]{\overset { \scriptstyle \rightharpoonup} {\mathbf{#1}} } \)
\( \newcommand{\vectorC}[1]{\textbf{#1}} \)
\( \newcommand{\vectorD}[1]{\overrightarrow{#1}} \)
\( \newcommand{\vectorDt}[1]{\overrightarrow{\text{#1}}} \)
\( \newcommand{\vectE}[1]{\overset{-\!-\!\rightharpoonup}{\vphantom{a}\smash{\mathbf {#1}}}} \)
\( \newcommand{\vecs}[1]{\overset { \scriptstyle \rightharpoonup} {\mathbf{#1}} } \)
\( \newcommand{\vecd}[1]{\overset{-\!-\!\rightharpoonup}{\vphantom{a}\smash {#1}}} \)
Key terms
| Term | Meaning |
|---|---|
| Genetics | The study of biological inheritance |
| Trait | A specific characteristic of an individual |
| Gene | A unit of heredity that is passed from parent to offspring |
| Allele | One of different forms of a gene |
| Genotype | The genetic makeup of an organism (ex: TT) |
| Phenotype | The physical characteristics of an organism (ex: tall) |
| Dominant allele | Allele that is phenotypically expressed over another allele |
| Recessive allele | Allele that is only expressed in absence of a dominant allele |
| Homozygous | Having two identical alleles for a particular gene |
| Heterozygous | Having two different alleles for a particular gene |
| Punnett square | Diagram that can be used to predict the genotypes and phenotypes resulting from a genetic cross |
Mendelian inheritance
Gregor Mendel's principles of heredity, observed through patterns of inheritance in pea plants, form the basis of modern genetics.
Mendel proposed that traits were specified by "heritable elements" called genes. Genes come in different versions, or alleles, with dominant alleles being expressed over recessive alleles. Recessive alleles are only expressed when no dominant allele is present.
In most sexually reproducing organisms, each individual has two alleles for each gene (one from each parent). This pair of alleles is called a genotype and determines the organism's appearance, or phenotype.
Mendel's laws

When an organism makes gametes, each gamete receives just one gene copy, which is selected randomly. This is known as the law of segregation.
Mendel's second law is the law of independent assortment, which states that the alleles for one gene sort into gametes independently of the alleles of another gene.
Punnett squares and probability
A Punnett square can be used to predict genotype and phenotypes of offspring from genetic crosses. A single-gene, or monohybrid cross is pictured below.

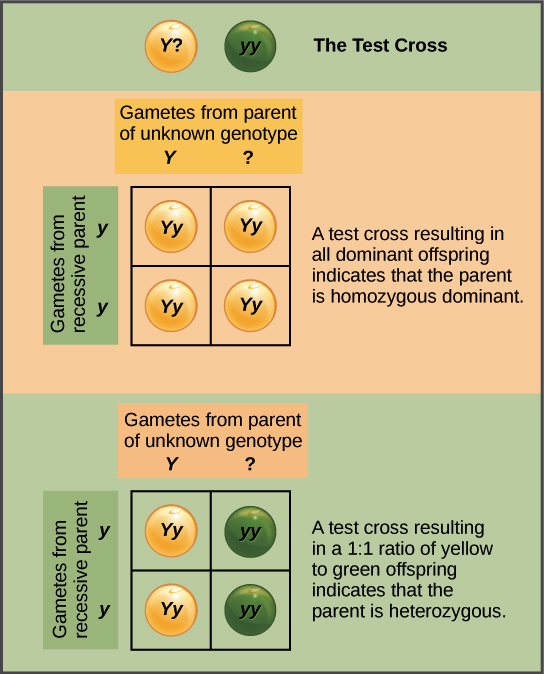
A test cross can be used to determine whether an organism with a dominant phenotype is homozygous or heterozygous.
Punnett squares can be used for two-gene crosses, or dihybrid crosses by following the same basic rules as for a monohybrid cross. However, since there are now more gamete types, there must also be more squares in the table.

Probabilities in genetics
The two probability rules that are most relevant to Punnett squares are the product rule and the sum rule.
The product rule states that the probability of two (or more) independent events occurring together can be calculated by multiplying the individual probabilities of the events.

In some genetics problems, you may need to calculate the probability that any one of several events will occur. In this case, you’ll need to apply another rule of probability, the sum rule. According to the sum rule, the probability that any of several mutually exclusive events will occur is equal to the sum of the events’ individual probabilities.

Common mistakes and misconceptions
- Dominant traits are not always the most common. Some people may think that dominant trait is the most likely to be found in the population, but the term "dominant" only refers to the fact that the allele is expressed over another allele. An example of this is Huntington's disease. Even though Huntington's is caused by a dominant allele, it only affects about 30,000 people in the United States1.
- Traits are not always the product of a single gene. For example, there are at least 3 different genes that are associated with eye color in humans. In addition, there are sometimes more than two alleles for each gene. For example, there are 3 different alleles of one gene that determine coat color of cats.
Contributors and Attributions
Khan Academy (CC BY-NC-SA 3.0; All Khan Academy content is available for free at www.khanacademy.org)