
6.3: Absorbance Spectra of Photosynthetic Pigments
- Page ID
- 24767

\( \newcommand{\vecs}[1]{\overset { \scriptstyle \rightharpoonup} {\mathbf{#1}} } \)
\( \newcommand{\vecd}[1]{\overset{-\!-\!\rightharpoonup}{\vphantom{a}\smash {#1}}} \)
\( \newcommand{\dsum}{\displaystyle\sum\limits} \)
\( \newcommand{\dint}{\displaystyle\int\limits} \)
\( \newcommand{\dlim}{\displaystyle\lim\limits} \)
\( \newcommand{\id}{\mathrm{id}}\) \( \newcommand{\Span}{\mathrm{span}}\)
( \newcommand{\kernel}{\mathrm{null}\,}\) \( \newcommand{\range}{\mathrm{range}\,}\)
\( \newcommand{\RealPart}{\mathrm{Re}}\) \( \newcommand{\ImaginaryPart}{\mathrm{Im}}\)
\( \newcommand{\Argument}{\mathrm{Arg}}\) \( \newcommand{\norm}[1]{\| #1 \|}\)
\( \newcommand{\inner}[2]{\langle #1, #2 \rangle}\)
\( \newcommand{\Span}{\mathrm{span}}\)
\( \newcommand{\id}{\mathrm{id}}\)
\( \newcommand{\Span}{\mathrm{span}}\)
\( \newcommand{\kernel}{\mathrm{null}\,}\)
\( \newcommand{\range}{\mathrm{range}\,}\)
\( \newcommand{\RealPart}{\mathrm{Re}}\)
\( \newcommand{\ImaginaryPart}{\mathrm{Im}}\)
\( \newcommand{\Argument}{\mathrm{Arg}}\)
\( \newcommand{\norm}[1]{\| #1 \|}\)
\( \newcommand{\inner}[2]{\langle #1, #2 \rangle}\)
\( \newcommand{\Span}{\mathrm{span}}\) \( \newcommand{\AA}{\unicode[.8,0]{x212B}}\)
\( \newcommand{\vectorA}[1]{\vec{#1}} % arrow\)
\( \newcommand{\vectorAt}[1]{\vec{\text{#1}}} % arrow\)
\( \newcommand{\vectorB}[1]{\overset { \scriptstyle \rightharpoonup} {\mathbf{#1}} } \)
\( \newcommand{\vectorC}[1]{\textbf{#1}} \)
\( \newcommand{\vectorD}[1]{\overrightarrow{#1}} \)
\( \newcommand{\vectorDt}[1]{\overrightarrow{\text{#1}}} \)
\( \newcommand{\vectE}[1]{\overset{-\!-\!\rightharpoonup}{\vphantom{a}\smash{\mathbf {#1}}}} \)
\( \newcommand{\vecs}[1]{\overset { \scriptstyle \rightharpoonup} {\mathbf{#1}} } \)
\(\newcommand{\longvect}{\overrightarrow}\)
\( \newcommand{\vecd}[1]{\overset{-\!-\!\rightharpoonup}{\vphantom{a}\smash {#1}}} \)
\(\newcommand{\avec}{\mathbf a}\) \(\newcommand{\bvec}{\mathbf b}\) \(\newcommand{\cvec}{\mathbf c}\) \(\newcommand{\dvec}{\mathbf d}\) \(\newcommand{\dtil}{\widetilde{\mathbf d}}\) \(\newcommand{\evec}{\mathbf e}\) \(\newcommand{\fvec}{\mathbf f}\) \(\newcommand{\nvec}{\mathbf n}\) \(\newcommand{\pvec}{\mathbf p}\) \(\newcommand{\qvec}{\mathbf q}\) \(\newcommand{\svec}{\mathbf s}\) \(\newcommand{\tvec}{\mathbf t}\) \(\newcommand{\uvec}{\mathbf u}\) \(\newcommand{\vvec}{\mathbf v}\) \(\newcommand{\wvec}{\mathbf w}\) \(\newcommand{\xvec}{\mathbf x}\) \(\newcommand{\yvec}{\mathbf y}\) \(\newcommand{\zvec}{\mathbf z}\) \(\newcommand{\rvec}{\mathbf r}\) \(\newcommand{\mvec}{\mathbf m}\) \(\newcommand{\zerovec}{\mathbf 0}\) \(\newcommand{\onevec}{\mathbf 1}\) \(\newcommand{\real}{\mathbb R}\) \(\newcommand{\twovec}[2]{\left[\begin{array}{r}#1 \\ #2 \end{array}\right]}\) \(\newcommand{\ctwovec}[2]{\left[\begin{array}{c}#1 \\ #2 \end{array}\right]}\) \(\newcommand{\threevec}[3]{\left[\begin{array}{r}#1 \\ #2 \\ #3 \end{array}\right]}\) \(\newcommand{\cthreevec}[3]{\left[\begin{array}{c}#1 \\ #2 \\ #3 \end{array}\right]}\) \(\newcommand{\fourvec}[4]{\left[\begin{array}{r}#1 \\ #2 \\ #3 \\ #4 \end{array}\right]}\) \(\newcommand{\cfourvec}[4]{\left[\begin{array}{c}#1 \\ #2 \\ #3 \\ #4 \end{array}\right]}\) \(\newcommand{\fivevec}[5]{\left[\begin{array}{r}#1 \\ #2 \\ #3 \\ #4 \\ #5 \\ \end{array}\right]}\) \(\newcommand{\cfivevec}[5]{\left[\begin{array}{c}#1 \\ #2 \\ #3 \\ #4 \\ #5 \\ \end{array}\right]}\) \(\newcommand{\mattwo}[4]{\left[\begin{array}{rr}#1 \amp #2 \\ #3 \amp #4 \\ \end{array}\right]}\) \(\newcommand{\laspan}[1]{\text{Span}\{#1\}}\) \(\newcommand{\bcal}{\cal B}\) \(\newcommand{\ccal}{\cal C}\) \(\newcommand{\scal}{\cal S}\) \(\newcommand{\wcal}{\cal W}\) \(\newcommand{\ecal}{\cal E}\) \(\newcommand{\coords}[2]{\left\{#1\right\}_{#2}}\) \(\newcommand{\gray}[1]{\color{gray}{#1}}\) \(\newcommand{\lgray}[1]{\color{lightgray}{#1}}\) \(\newcommand{\rank}{\operatorname{rank}}\) \(\newcommand{\row}{\text{Row}}\) \(\newcommand{\col}{\text{Col}}\) \(\renewcommand{\row}{\text{Row}}\) \(\newcommand{\nul}{\text{Nul}}\) \(\newcommand{\var}{\text{Var}}\) \(\newcommand{\corr}{\text{corr}}\) \(\newcommand{\len}[1]{\left|#1\right|}\) \(\newcommand{\bbar}{\overline{\bvec}}\) \(\newcommand{\bhat}{\widehat{\bvec}}\) \(\newcommand{\bperp}{\bvec^\perp}\) \(\newcommand{\xhat}{\widehat{\xvec}}\) \(\newcommand{\vhat}{\widehat{\vvec}}\) \(\newcommand{\uhat}{\widehat{\uvec}}\) \(\newcommand{\what}{\widehat{\wvec}}\) \(\newcommand{\Sighat}{\widehat{\Sigma}}\) \(\newcommand{\lt}{<}\) \(\newcommand{\gt}{>}\) \(\newcommand{\amp}{&}\) \(\definecolor{fillinmathshade}{gray}{0.9}\)Prelab Exercise
- Fill the Color field in the table below
- Use plot.ly to create a line graph with the 3 samples below (A, B, C)
- Plot % Reflectance on the Y-axis and Wavelength (nm) on the X-axis
-
% Reflectance
Color
nm
A
B
C
400
68
92
78
425
40
71
77
450
90
38
51
475
97
49
57
500
100
92
45
525
100
100
66
550
96
97
100
575
98
96
100
600
96
98
100
625
97
80
100
650
79
71
100
675
56
96
100
700
88
100
100
Stop and Think: Reflectance
A sign of plant health is viewed through the near infra-red. While we cannot see this spectrum of light with our eyes, we can use other sensors to detect this light. Compare the images of the Black & White with the Infra-red image. What differences can you see in the 2 images that will help you understand how this is a useful measure of plant health? How do you think this corresponds to the table above?
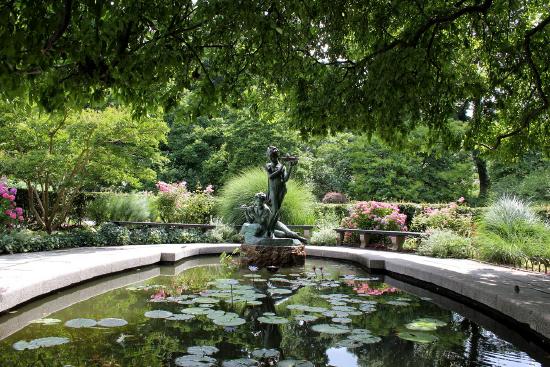
The English Garden
Reflectance Slider shows an overlay of the next images.
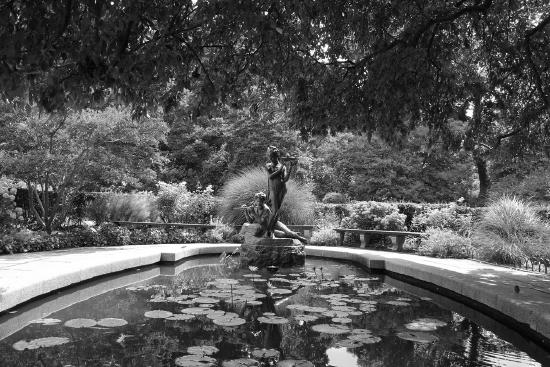
The English Garden (black & white)
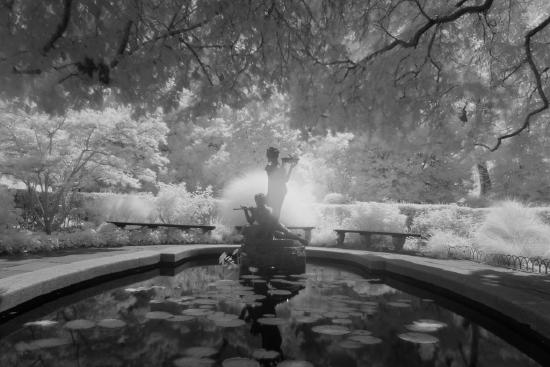
The English Garden (near infra-red)
Visible light wavelengths (between 400nm-700nm) are strongly absorbed by the pigments in leaves (Chlorophylls, Xanthophylls, and Carotenoids). These pigments utilize the energy of these wavelengths to take part in the light reactions. The cellular structure of leaves does not absorb wavelengths longer than these wavelengths (>700nm in the infra-red range). By comparing the amount of visible light to the amount of near infra-red lights that are reflected, one can gauge the relative health of leaves, forests, or jungles. This is the rough description of the Normalized Differential Vegetation Index (NDVI) that scientists use in conjunction with satellite imagery to assess the health of vegetation.
The Role of Light in Carbohydrate Synthesis
- Pick a leaf from a geranium exposed to light and one kept in the dark for 48 hours.
- Keep the stem on the leaf grown in the light.
- Remove the stem from the leaf grown in the dark.
- Hydrolyze the cell walls of the geranium leaves by boiling in a water bath for 5 minutes or until it looks like over-cooked vegetables).
- “Bleach“ the leaves by removing the pigments. Place the leaves in hot alcohol for 7 minutes or until they turn white.
- Save this green solution for Absorbance Spectrum exercise.
- Remove the leaves and place it in a petri dish.
- Add iodine to the dish. If starch is present, the leaf will turn a deep bluish-black color.
- Photograph the leaf with your phone to document the effects of light on carbohydrate storage.
Measuring the Absorbance
- Connect the Spectrovis to the LabQuest2.
- Turn on the Labquest2 units.
- Choose the Labquest app.
- Select the icon that looks like X|Y.
- Press the green Play button on the bottom left.
- Press OK to calibrate.
- Let the machine calibrate for 90 seconds.
- Choose “Finish calibration”.
- Insert the Geranium pigment from the bleaching reaction.
- Do NOT use Acetone in these plastic cuvettes since it will frost over the plastic.
- Press the Red Stop button.
- Students should record the absorbance values at every 10 nm from 380nm-700nm.
- The professor will prepare Spirulina extract diluted in ethanol in a cuvette and obtain the continuous absorbance spectrum.
- Plot Relative Absorbance against wavelength using a line graph and compare the absorption spectrum of the extracts.
- Relative Absorbance sets the maximum value in each dataset as a denominator.
- Every value is divided by this maximum value.