
6.1: Introduction
- Page ID
- 24876

\( \newcommand{\vecs}[1]{\overset { \scriptstyle \rightharpoonup} {\mathbf{#1}} } \)
\( \newcommand{\vecd}[1]{\overset{-\!-\!\rightharpoonup}{\vphantom{a}\smash {#1}}} \)
\( \newcommand{\dsum}{\displaystyle\sum\limits} \)
\( \newcommand{\dint}{\displaystyle\int\limits} \)
\( \newcommand{\dlim}{\displaystyle\lim\limits} \)
\( \newcommand{\id}{\mathrm{id}}\) \( \newcommand{\Span}{\mathrm{span}}\)
( \newcommand{\kernel}{\mathrm{null}\,}\) \( \newcommand{\range}{\mathrm{range}\,}\)
\( \newcommand{\RealPart}{\mathrm{Re}}\) \( \newcommand{\ImaginaryPart}{\mathrm{Im}}\)
\( \newcommand{\Argument}{\mathrm{Arg}}\) \( \newcommand{\norm}[1]{\| #1 \|}\)
\( \newcommand{\inner}[2]{\langle #1, #2 \rangle}\)
\( \newcommand{\Span}{\mathrm{span}}\)
\( \newcommand{\id}{\mathrm{id}}\)
\( \newcommand{\Span}{\mathrm{span}}\)
\( \newcommand{\kernel}{\mathrm{null}\,}\)
\( \newcommand{\range}{\mathrm{range}\,}\)
\( \newcommand{\RealPart}{\mathrm{Re}}\)
\( \newcommand{\ImaginaryPart}{\mathrm{Im}}\)
\( \newcommand{\Argument}{\mathrm{Arg}}\)
\( \newcommand{\norm}[1]{\| #1 \|}\)
\( \newcommand{\inner}[2]{\langle #1, #2 \rangle}\)
\( \newcommand{\Span}{\mathrm{span}}\) \( \newcommand{\AA}{\unicode[.8,0]{x212B}}\)
\( \newcommand{\vectorA}[1]{\vec{#1}} % arrow\)
\( \newcommand{\vectorAt}[1]{\vec{\text{#1}}} % arrow\)
\( \newcommand{\vectorB}[1]{\overset { \scriptstyle \rightharpoonup} {\mathbf{#1}} } \)
\( \newcommand{\vectorC}[1]{\textbf{#1}} \)
\( \newcommand{\vectorD}[1]{\overrightarrow{#1}} \)
\( \newcommand{\vectorDt}[1]{\overrightarrow{\text{#1}}} \)
\( \newcommand{\vectE}[1]{\overset{-\!-\!\rightharpoonup}{\vphantom{a}\smash{\mathbf {#1}}}} \)
\( \newcommand{\vecs}[1]{\overset { \scriptstyle \rightharpoonup} {\mathbf{#1}} } \)
\(\newcommand{\longvect}{\overrightarrow}\)
\( \newcommand{\vecd}[1]{\overset{-\!-\!\rightharpoonup}{\vphantom{a}\smash {#1}}} \)
\(\newcommand{\avec}{\mathbf a}\) \(\newcommand{\bvec}{\mathbf b}\) \(\newcommand{\cvec}{\mathbf c}\) \(\newcommand{\dvec}{\mathbf d}\) \(\newcommand{\dtil}{\widetilde{\mathbf d}}\) \(\newcommand{\evec}{\mathbf e}\) \(\newcommand{\fvec}{\mathbf f}\) \(\newcommand{\nvec}{\mathbf n}\) \(\newcommand{\pvec}{\mathbf p}\) \(\newcommand{\qvec}{\mathbf q}\) \(\newcommand{\svec}{\mathbf s}\) \(\newcommand{\tvec}{\mathbf t}\) \(\newcommand{\uvec}{\mathbf u}\) \(\newcommand{\vvec}{\mathbf v}\) \(\newcommand{\wvec}{\mathbf w}\) \(\newcommand{\xvec}{\mathbf x}\) \(\newcommand{\yvec}{\mathbf y}\) \(\newcommand{\zvec}{\mathbf z}\) \(\newcommand{\rvec}{\mathbf r}\) \(\newcommand{\mvec}{\mathbf m}\) \(\newcommand{\zerovec}{\mathbf 0}\) \(\newcommand{\onevec}{\mathbf 1}\) \(\newcommand{\real}{\mathbb R}\) \(\newcommand{\twovec}[2]{\left[\begin{array}{r}#1 \\ #2 \end{array}\right]}\) \(\newcommand{\ctwovec}[2]{\left[\begin{array}{c}#1 \\ #2 \end{array}\right]}\) \(\newcommand{\threevec}[3]{\left[\begin{array}{r}#1 \\ #2 \\ #3 \end{array}\right]}\) \(\newcommand{\cthreevec}[3]{\left[\begin{array}{c}#1 \\ #2 \\ #3 \end{array}\right]}\) \(\newcommand{\fourvec}[4]{\left[\begin{array}{r}#1 \\ #2 \\ #3 \\ #4 \end{array}\right]}\) \(\newcommand{\cfourvec}[4]{\left[\begin{array}{c}#1 \\ #2 \\ #3 \\ #4 \end{array}\right]}\) \(\newcommand{\fivevec}[5]{\left[\begin{array}{r}#1 \\ #2 \\ #3 \\ #4 \\ #5 \\ \end{array}\right]}\) \(\newcommand{\cfivevec}[5]{\left[\begin{array}{c}#1 \\ #2 \\ #3 \\ #4 \\ #5 \\ \end{array}\right]}\) \(\newcommand{\mattwo}[4]{\left[\begin{array}{rr}#1 \amp #2 \\ #3 \amp #4 \\ \end{array}\right]}\) \(\newcommand{\laspan}[1]{\text{Span}\{#1\}}\) \(\newcommand{\bcal}{\cal B}\) \(\newcommand{\ccal}{\cal C}\) \(\newcommand{\scal}{\cal S}\) \(\newcommand{\wcal}{\cal W}\) \(\newcommand{\ecal}{\cal E}\) \(\newcommand{\coords}[2]{\left\{#1\right\}_{#2}}\) \(\newcommand{\gray}[1]{\color{gray}{#1}}\) \(\newcommand{\lgray}[1]{\color{lightgray}{#1}}\) \(\newcommand{\rank}{\operatorname{rank}}\) \(\newcommand{\row}{\text{Row}}\) \(\newcommand{\col}{\text{Col}}\) \(\renewcommand{\row}{\text{Row}}\) \(\newcommand{\nul}{\text{Nul}}\) \(\newcommand{\var}{\text{Var}}\) \(\newcommand{\corr}{\text{corr}}\) \(\newcommand{\len}[1]{\left|#1\right|}\) \(\newcommand{\bbar}{\overline{\bvec}}\) \(\newcommand{\bhat}{\widehat{\bvec}}\) \(\newcommand{\bperp}{\bvec^\perp}\) \(\newcommand{\xhat}{\widehat{\xvec}}\) \(\newcommand{\vhat}{\widehat{\vvec}}\) \(\newcommand{\uhat}{\widehat{\uvec}}\) \(\newcommand{\what}{\widehat{\wvec}}\) \(\newcommand{\Sighat}{\widehat{\Sigma}}\) \(\newcommand{\lt}{<}\) \(\newcommand{\gt}{>}\) \(\newcommand{\amp}{&}\) \(\definecolor{fillinmathshade}{gray}{0.9}\)Chloroplasts

Credit: elvinsong [CC-BY-SA 3.0]
Chloroplasts arose through a second endosymbiotic event in plants and various protists. These light-harvesting organelles share a similarity in structure and genome to photoautotrophic cyanobacteria.
Light-Harvesting

The thylakoid membranes of chloroplasts and cyanobacteria provide additional surface area for energy capture of light to occur. The light-dependent reactions in chloroplasts utilize two protein complexes referred to as Photosystem I (PSI) and Photosystem II (PSII) located on the thylakoid membranes. At the center of each photosystem complexes are photopigments optimized to absorb specific wavelengths of light. When light is absorbed in a photosystem, an electron is excited and transferred to the electron transport chain. In PSII, the electron is regenerated by splitting of two water molecules into 4H+ + 4e– + O2. As the electrons move through the ETC, protons are pumped into the thylakoid space. The ETC leads to the reduction of a high energy electron carrier NADP+ to NADPH. Since this pathway uses consumes water in a chemical reaction, the apparent loss of water in the thylakoid space is referred to as chemiosmosis.
PSI is also known as the cyclic pathway since the excited electron runs through a closed circuit of the ETC to regenerate the lost electron. This closed circuit also generates a proton gradient through powering of a proton pump but does not lead to the reduction of NADPH. As with the ETC-powered proton pump in mitochondria, the proton gradient is used to power ATP-synthase in producing ATP molecules.
Light Independent Reactions
Credit: Mike Jones [CC-BY-SA 3.0]
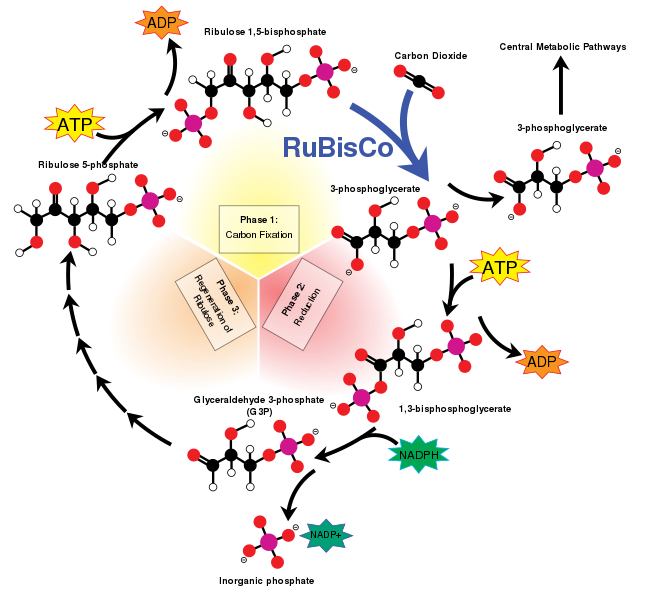
The light-independent reactions are also known as the dark reactions or Calvin Cycle and utilize the ATP and NADPH from the light-dependent reactions to fix gaseous CO2 into carbohydrate backbones. Photosynthesis is often simplified into 6CO2 + 6H2O + light –> C6H12O6 + 6O2 . However, the true product is 3-phosphoglycerate that can be used to generate longer carbohydrates like glucose. The starting point of carbon fixation is the carbohydrate Ribulose 1,5-bisphosphate. The enzyme Ribulose Bisphosphate Carboxylase (RuBisCO) captures a CO2 molecule onto Ribulose 1,5-bisphosphate to generate 2 molecules of 3-phosphoglycerate which can enter the process of gluconeogenesis to generate glucose. ATP from the light reactions can then facilitate the conversion of 3-phosphoglycerate to 1,3 bisphosphoglycerate which can be reduced by NADPH to glyceraldehyde-3-phosphate (G3P). G3P can then be used to regenerate Ribulose 1,5-bisphosphate.

1: Carbon fixation by RuBisCO

2: Reduction by NADPH

3: Ribulose, 5-bisphosphate regeneration
The Great Oxygenation Event
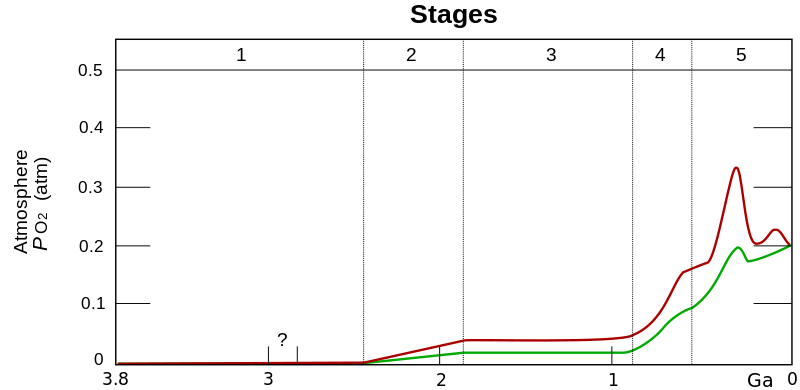
Two estimates of the evolution of atmospheric O2. The upper red and lower green lines represent the range of the estimates. Stage 1 (3.85–2.45 Ga) represents the primordial reducing atmosphere. Stage 2 (2.45–1.85 Ga) coincides with the emergence of oceanic cyanobacteria where O2 was being absorbed by the oceans and sediment. O2 escaped the oceans during Stage 3 (1.85–0.85 Ga). O2sinks filled in Stage 4 (0.85–0.54 Ga ) and Stage 5 (0.54 Ga–present) leading to atmospheric accumulation.

Banded iron formations in 2.1 billion-year-old rock illustrate the oxidation of dissolved oceanic iron that precipitated in response to accumulating O2 concentrations.
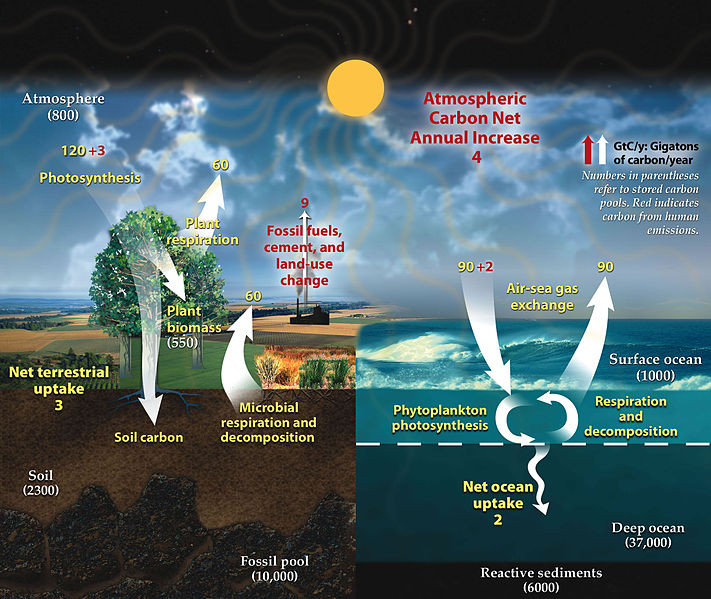
The Carbon Cycle illustrates carbon sequestration and release between various carbon sinks.

Projection of atmospheric CO2 accumulation without reduction of fossil fuel reduction by NASA.