
3.1: Gel Electrophoresis
- Page ID
- 18133

\( \newcommand{\vecs}[1]{\overset { \scriptstyle \rightharpoonup} {\mathbf{#1}} } \)
\( \newcommand{\vecd}[1]{\overset{-\!-\!\rightharpoonup}{\vphantom{a}\smash {#1}}} \)
\( \newcommand{\dsum}{\displaystyle\sum\limits} \)
\( \newcommand{\dint}{\displaystyle\int\limits} \)
\( \newcommand{\dlim}{\displaystyle\lim\limits} \)
\( \newcommand{\id}{\mathrm{id}}\) \( \newcommand{\Span}{\mathrm{span}}\)
( \newcommand{\kernel}{\mathrm{null}\,}\) \( \newcommand{\range}{\mathrm{range}\,}\)
\( \newcommand{\RealPart}{\mathrm{Re}}\) \( \newcommand{\ImaginaryPart}{\mathrm{Im}}\)
\( \newcommand{\Argument}{\mathrm{Arg}}\) \( \newcommand{\norm}[1]{\| #1 \|}\)
\( \newcommand{\inner}[2]{\langle #1, #2 \rangle}\)
\( \newcommand{\Span}{\mathrm{span}}\)
\( \newcommand{\id}{\mathrm{id}}\)
\( \newcommand{\Span}{\mathrm{span}}\)
\( \newcommand{\kernel}{\mathrm{null}\,}\)
\( \newcommand{\range}{\mathrm{range}\,}\)
\( \newcommand{\RealPart}{\mathrm{Re}}\)
\( \newcommand{\ImaginaryPart}{\mathrm{Im}}\)
\( \newcommand{\Argument}{\mathrm{Arg}}\)
\( \newcommand{\norm}[1]{\| #1 \|}\)
\( \newcommand{\inner}[2]{\langle #1, #2 \rangle}\)
\( \newcommand{\Span}{\mathrm{span}}\) \( \newcommand{\AA}{\unicode[.8,0]{x212B}}\)
\( \newcommand{\vectorA}[1]{\vec{#1}} % arrow\)
\( \newcommand{\vectorAt}[1]{\vec{\text{#1}}} % arrow\)
\( \newcommand{\vectorB}[1]{\overset { \scriptstyle \rightharpoonup} {\mathbf{#1}} } \)
\( \newcommand{\vectorC}[1]{\textbf{#1}} \)
\( \newcommand{\vectorD}[1]{\overrightarrow{#1}} \)
\( \newcommand{\vectorDt}[1]{\overrightarrow{\text{#1}}} \)
\( \newcommand{\vectE}[1]{\overset{-\!-\!\rightharpoonup}{\vphantom{a}\smash{\mathbf {#1}}}} \)
\( \newcommand{\vecs}[1]{\overset { \scriptstyle \rightharpoonup} {\mathbf{#1}} } \)
\(\newcommand{\longvect}{\overrightarrow}\)
\( \newcommand{\vecd}[1]{\overset{-\!-\!\rightharpoonup}{\vphantom{a}\smash {#1}}} \)
\(\newcommand{\avec}{\mathbf a}\) \(\newcommand{\bvec}{\mathbf b}\) \(\newcommand{\cvec}{\mathbf c}\) \(\newcommand{\dvec}{\mathbf d}\) \(\newcommand{\dtil}{\widetilde{\mathbf d}}\) \(\newcommand{\evec}{\mathbf e}\) \(\newcommand{\fvec}{\mathbf f}\) \(\newcommand{\nvec}{\mathbf n}\) \(\newcommand{\pvec}{\mathbf p}\) \(\newcommand{\qvec}{\mathbf q}\) \(\newcommand{\svec}{\mathbf s}\) \(\newcommand{\tvec}{\mathbf t}\) \(\newcommand{\uvec}{\mathbf u}\) \(\newcommand{\vvec}{\mathbf v}\) \(\newcommand{\wvec}{\mathbf w}\) \(\newcommand{\xvec}{\mathbf x}\) \(\newcommand{\yvec}{\mathbf y}\) \(\newcommand{\zvec}{\mathbf z}\) \(\newcommand{\rvec}{\mathbf r}\) \(\newcommand{\mvec}{\mathbf m}\) \(\newcommand{\zerovec}{\mathbf 0}\) \(\newcommand{\onevec}{\mathbf 1}\) \(\newcommand{\real}{\mathbb R}\) \(\newcommand{\twovec}[2]{\left[\begin{array}{r}#1 \\ #2 \end{array}\right]}\) \(\newcommand{\ctwovec}[2]{\left[\begin{array}{c}#1 \\ #2 \end{array}\right]}\) \(\newcommand{\threevec}[3]{\left[\begin{array}{r}#1 \\ #2 \\ #3 \end{array}\right]}\) \(\newcommand{\cthreevec}[3]{\left[\begin{array}{c}#1 \\ #2 \\ #3 \end{array}\right]}\) \(\newcommand{\fourvec}[4]{\left[\begin{array}{r}#1 \\ #2 \\ #3 \\ #4 \end{array}\right]}\) \(\newcommand{\cfourvec}[4]{\left[\begin{array}{c}#1 \\ #2 \\ #3 \\ #4 \end{array}\right]}\) \(\newcommand{\fivevec}[5]{\left[\begin{array}{r}#1 \\ #2 \\ #3 \\ #4 \\ #5 \\ \end{array}\right]}\) \(\newcommand{\cfivevec}[5]{\left[\begin{array}{c}#1 \\ #2 \\ #3 \\ #4 \\ #5 \\ \end{array}\right]}\) \(\newcommand{\mattwo}[4]{\left[\begin{array}{rr}#1 \amp #2 \\ #3 \amp #4 \\ \end{array}\right]}\) \(\newcommand{\laspan}[1]{\text{Span}\{#1\}}\) \(\newcommand{\bcal}{\cal B}\) \(\newcommand{\ccal}{\cal C}\) \(\newcommand{\scal}{\cal S}\) \(\newcommand{\wcal}{\cal W}\) \(\newcommand{\ecal}{\cal E}\) \(\newcommand{\coords}[2]{\left\{#1\right\}_{#2}}\) \(\newcommand{\gray}[1]{\color{gray}{#1}}\) \(\newcommand{\lgray}[1]{\color{lightgray}{#1}}\) \(\newcommand{\rank}{\operatorname{rank}}\) \(\newcommand{\row}{\text{Row}}\) \(\newcommand{\col}{\text{Col}}\) \(\renewcommand{\row}{\text{Row}}\) \(\newcommand{\nul}{\text{Nul}}\) \(\newcommand{\var}{\text{Var}}\) \(\newcommand{\corr}{\text{corr}}\) \(\newcommand{\len}[1]{\left|#1\right|}\) \(\newcommand{\bbar}{\overline{\bvec}}\) \(\newcommand{\bhat}{\widehat{\bvec}}\) \(\newcommand{\bperp}{\bvec^\perp}\) \(\newcommand{\xhat}{\widehat{\xvec}}\) \(\newcommand{\vhat}{\widehat{\vvec}}\) \(\newcommand{\uhat}{\widehat{\uvec}}\) \(\newcommand{\what}{\widehat{\wvec}}\) \(\newcommand{\Sighat}{\widehat{\Sigma}}\) \(\newcommand{\lt}{<}\) \(\newcommand{\gt}{>}\) \(\newcommand{\amp}{&}\) \(\definecolor{fillinmathshade}{gray}{0.9}\)Gel electrophoresis is used to characterize one of the most basic properties - molecular mass - of both polynucleotides and polypeptides. Gel electrophoresis can also be used to determine: (1) the purity of these samples, (2) heterogeneity/extent of degradation, and (3) subunit composition.
DNA
The most common gel electrophoresis materials for DNA molecules is agarose and acrylamide.
DNA agarose gels
The electrophoretic migration rate of DNA through agarose gels is dependent upon four main parameters:
1. The molecular size of the DNA. Molecules of linear duplex DNA travel through agarose gels at a rate which is inversely proportional to the log of their molecular weight.
\[M_r \propto 1/log (Mw)\]
Example: Compare molecular mass vs. expected migration rate:
|
Molecular Mass (Da) |
log (Molec. Mass) |
1/log (Molec. Mass) |
|---|---|---|
|
100,000 |
5.0 |
0.20 |
|
50,000 |
4.7 |
0.21 |
|
10,000 |
4.0 |
0.25 |
|
5,000 |
3.7 |
0.27 |
|
1,000 |
3.0 |
0.33 |
.png?revision=1&size=bestfit&width=334&height=377)
Figure 3.1.1: Relative migration rate with molecular mass
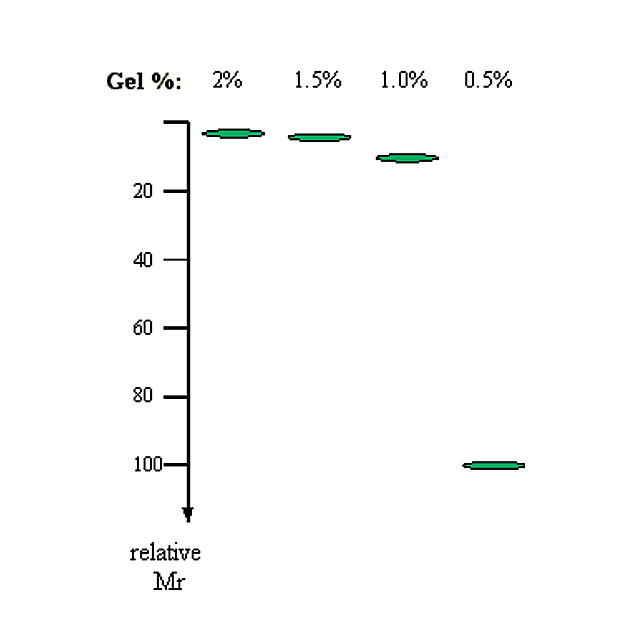
2. The agarose concentration. There is an inverse linear relationship between the logarithm of the electrophoretic mobility and gel concentration.
\[\log (M_r) \propto 1/[gel]\]
|
Gel % |
1/Gel % |
inv log(1/Gel %) (i.e. relative Mr) |
|---|---|---|
|
2.0 |
0.50 |
3.2 |
|
1.5 |
0.67 |
4.6 |
|
1.0 |
1.00 |
10.0 |
|
0.5 |
2.00 |
100.0 |
.png?revision=1&size=bestfit&width=438&height=439)
Figure 3.1.2: Relative migration rate with gel concentration
3. The conformation of the DNA.
- closed circular DNA (form-I) - typically supercoiled
- nicked circular (form-II)
- linear DNA (form-III)
These different forms of the same DNA migrate at different rates through an agarose gel. Almost always the linear form (form-III) migrates at the slowest rate of the three forms and supercoiled DNA (form-I) usually migrates the fastest.
4. The applied voltage.
- Typical value for running an agarose gel is 5 volts per cm (length of gel).
|
Agarose (%) |
Range of separation of linear DNA (in kilobases) |
|---|---|
|
0.3 |
60 - 5 |
|
0.6 |
20 - 1 |
|
0.7 |
10 - 0.8 |
|
0.9 |
7 - 0.5 |
|
1.2 |
6 - 0.4 |
|
1.5 |
4 - 0.2 |
|
2.0 |
3 - 0.1 |
- Agarose gels are usually poured and run horizontally
Finally, the DNA being an acidic molecule, migrates towards the positively charged electrode (cathode).
.png?revision=1&size=bestfit&width=613&height=423)
Figure 3.1.3: Gel electrophoresis setup
DNA acrylamide Gels
Acrylamide gels are useful for separation of small DNA fragments typically oligonucleotides <100 base pairs. These gels are usually of a low acrylamide concentration (<=6%) and contain the non-ionic denaturing agent Urea (6M). The denaturing agent prevents secondary structure formation in oligonucleotides and allows a relatively accurate determination of molecular mass.
Gel Electrophoresis for Proteins
Gel electrophoresis of proteins almost exclusively utilizes polyacrylamide. The acrylamide solution usually contains two components: acrylamide and bis acrylamide. A typical value for the acrylamide:bis ratio is 19:1. The bis acrylamide is essentially a cross-linking component of the acrylamide polymer. The total acrylamide concentration in the gel affects the migration of proteins through the matrix (as with the concentration of agarose).
Protein gels are usually performed under denaturing conditions in the presence of the detergent sodium dodecyl sulfate (SDS). The proteins are denatured by heat in the presence of SDS. The SDS binds, via hydrophobic interactions, to the proteins in an amount approximately proportional to the size of the protein. Due to the charged nature of the SDS molecule the proteins thus have a somewhat constant charge to mass ratio and migrate through the gel at a rate proportional to their molecular mass, The proteins migrate towards the anode.
|
Acrylamide (%) |
Range of separation of Polypeptides (in kilodaltons) |
|---|---|
|
8 |
200 - 25 |
|
10 |
100 - 15 |
|
12.5 |
70 - 10 |
|
15 |
60 - 6 |
|
20 |
40 - 4 |
Since the SDS treatment will dissociate non-covalent protein complexes, they may thus exhibit a much lower than expected molecular mass on SDS polyacrylamide gel electrophoresis (SDS PAGE). Protein PAGE gels are usually polymerized between two glass plates and run in the vertical direction.
.png?revision=1&size=bestfit&width=515&height=340)
Figure 3.1.4: Effect of SDS treatment
PAGE may also be run in the presence of reducing agents, such as b-mercaptoethanol (BME). BME is a reducing agent which will reduce any disulfide bonds (e.g. as exists between some pairs of cysteine residues in a protein). This helps to remove residual secondary structure in the SDS treated protein, but it may also allow the separation of polypeptide fragments from each other (i.e. their covalent interaction was entirely made up of one or more disulfide bonds). Thus, an apparently single protein may exhibit a set of small fragments under reducing PAGE conditions.
Stains for DNA
Ethidium
The most convenient method to visualize DNA in gel electrophoresis is staining with the fluorescent dye ethidium bromide. This compound contains a planar group that intercalates between the stacked bases of DNA. The orientation and proximity of ethidium with the stacked bases causes the dye to display an increased florescence compared to free dye (in solution). U.V. radiation at 254 nm is absorbed by the DNA and transmitted to the bound dye and the energy is re-emitted at 590 nm in the red-orange region of the spectrum.
.png?revision=1&size=bestfit&width=259&height=197)
Figure 3.1.5: Ethidium
Ethidium bromide is usually prepared as a stock solution of 10 mg/ml in water, stored at room temp and protected from light. The dye is usually incorporated into the gel and running buffer, or conversely, the gel is stained after running by soaking in a solution of ethidium bromide (0.5 ug/ml for 30 min). The stain is visualized by irradiating with a UV light source (i.e. using a transiluminator) and photgraphing with polaroid film. The usual sensitivity of detection is better than 0.1 ug of DNA.
Because ethidium is a DNA intercalating agent, it is a powerful mutagen. Incorporation of ethidium in the DNA of living organisms (i.e. you and I) can cause (unwanted) mutations.
Note:
- The intercalation of ethidium bromide causes a reduction in the number of effective basepairs per twist.
- Thus, the DNA wants to adopt a conformation with fewer base pairs per twist.
- The number of twists will increase for the given length of DNA
- Writhe will decrease if the Linkage number remains unchanged
- The net result is that addition of ethidium bromide will introduce negative supercoils into the DNA
- Addition of ethidium bromide to a DNA sample prior to electrophoresis can cause positively supercoiled DNA to migrate as relaxed (nicked, or form II) DNA
- After replication DNA is typically underwound (negative supercoils), thus it will become more underwound with EtBr treatment (migration rate may actually increase due to more compact state)
Flourescence shadowing:
- DNA fragments resolved on polyacrylamide gels can also be visualized by the method of UV shadowing.
- In this method the gel is placed on top of a fluorescent material, usually a flourescent TLC silica plate.
- The gel is then illuminated by a UV light source.
- DNA bands in the gel will block transmittance of the UV light to the substrate.
- This will result in a dark area (i.e. non-fluorescing) area on the substrate.
- This method is usually used in gel purification of oligonucleotides (i.e. the dark bands can be cut out with a razor blade and the oligonucleotide extracted)
Stains for Proteins
Coomassie brilliant blue
- Coomassie blue is a triphenylmethane textile dye which is able to stain proteins.
- After a polyacrylamide gel is run it is usually "fixed" by placing in a 50% methanol/10 acetic acid solution for 30 minutes (to precipitate the proteins and prevent diffusion out of the gel).
- The fixed gel is then soaked in a methanol/acetic acid solution containing 2.5 gm/liter of Coosmassie blue.
- Destaining of the background gel is accomplished by soaking in changes of 10% methanol/7 % acetic acid. This method can typically detect protein samples of 0.1 ug or greater.
Silver stain
- Silver staining is a method which utilizes a silver nitrate solution to stain proteins in an acrylamide gel.
- The method is similar in nature to the use of silver in photographic plates.
- The sensitivity is approximately two orders of magnitude more sensitive than coomassie staining (i.e. one can detect approximately 1ng of protein).
- Due to its high sensitivity this method is usually used to determine the presence of trace contaminants in protein samples.
Molecular Weight Standards
- Both DNA and protein gel electrophoresis utilize molecular weight standards to calibrate the size(s) of samples being analyzed
- DNA molecular weight standards will consist of a mixture of DNA fragments of known sizes (molecular mass)
- One convenient DNA molecular weight standard is constructed by partial ligation of a 100 base pair fragment of duplex DNA
- Partial ligation will result in formation of dimers (200 bp), trimers (300 bp) and so on, as well as some amount of the original (100 bp) fragment
- This produces a DNA "ladder" after gel electrophoresis
- Another DNA fragment standard might be a known DNA sequence, such as the plasmid pBR322, which has been digested with a four-cutter restriction endonuclease (e.g. Alu I).
- This produces a variety of fragments with different sizes
- It is easily reproduced (just cut more pBR322)
- One convenient DNA molecular weight standard is constructed by partial ligation of a 100 base pair fragment of duplex DNA
- Protein molecular weight markers usually consist of a mixture of a half dozen or so pure proteins with known molecular masses
|
Protein |
Molecular Mass (Da) |
|---|---|
|
Phosphorylase B |
94,000 |
|
Bovine Serum Albumin |
67,000 |
|
Ovalbumin |
43,000 |
|
Carbonic Anhydrase |
30,000 |
|
Soybean Trypsin Inhibitor |
20,100 |
|
a-Lactalbumin |
14,400 |
- In both DNA and protein gels, molecular weight markers are run in a lane at one end of the gel
.png?revision=1&size=bestfit&width=647&height=365)
Figure 3.1.6: DNA size standards